Comparison of saturation vapor pressures of α-pinene - ACP ...
←
→
Page content transcription
If your browser does not render page correctly, please read the page content below
Research article
Atmos. Chem. Phys., 22, 1195–1208, 2022
https://doi.org/10.5194/acp-22-1195-2022
© Author(s) 2022. This work is distributed under
the Creative Commons Attribution 4.0 License.

         Comparison of saturation vapor pressures of α -pinene
           + O3 oxidation products derived from COSMO-RS
          computations and thermal desorption experiments
          Noora Hyttinen1,a , Iida Pullinen1 , Aki Nissinen1 , Siegfried Schobesberger1 , Annele Virtanen1 , and
                                                     Taina Yli-Juuti1
          1 Department    of Applied Physics, University of Eastern Finland, P.O. Box 1627, 70211 Kuopio, Finland
         a now   at: Department of Chemistry, Nanoscience Center, University of Jyväskylä, 40014 Jyväskylä, Finland
                                 Correspondence: Noora Hyttinen (noora.x.hyttinen@jyu.fi)

                                Received: 10 September 2021 – Discussion started: 20 September 2021
                        Revised: 8 December 2021 – Accepted: 8 December 2021 – Published: 24 January 2022

      Abstract. Accurate information on gas-to-particle partitioning is needed to model secondary organic aerosol
      formation. However, determining reliable saturation vapor pressures of atmospherically relevant multifunctional
      organic compounds is extremely difficult. We estimated saturation vapor pressures of α-pinene-ozonolysis-
      derived secondary organic aerosol constituents using Filter Inlet for Gases and AEROsols (FIGAERO)–
      chemical ionization mass spectrometer (CIMS) experiments and conductor-like screening model for real solvents
      (COSMO-RS). We found a good agreement between experimental and computational saturation vapor pressures
      for molecules with molar masses around 190 g mol−1 and higher, most within a factor of 3 comparing the aver-
      age of the experimental vapor pressures and the COSMO-RS estimate of the isomer closest to the experiments.
      Smaller molecules likely have saturation vapor pressures that are too high to be measured using our experi-
      mental setup. The molecules with molar masses below 190 g mol−1 that have differences of several orders of
      magnitude between the computational and experimental saturation vapor pressures observed in our experiments
      are likely products of thermal decomposition occurring during thermal desorption. For example, dehydration and
      decarboxylation reactions are able to explain some of the discrepancies between experimental and computational
      saturation vapor pressures. Based on our estimates, FIGAERO–CIMS can best be used to determine saturation
      vapor pressures of compounds with low and extremely low volatilities at least down to 10−10 Pa in saturation
      vapor pressure.

1   Introduction                                                   ate to initiate SOA formation (Kirkby et al., 2016; Bianchi
                                                                   et al., 2016), while ELVOCs, LVOCs and SVOCs can con-
Secondary organic aerosol (SOA) is formed in the gas               dense on existing particles to contribute to the growth of
phase by the condensing of organic molecules with low              SOA (Ehn et al., 2014). A large source of organic compounds
volatilities. In atmospheric science, organic compounds            in the atmosphere comprises biogenic volatile organic com-
are often grouped based on their saturation vapor pres-            pounds (BVOCs) emitted by plants (Jimenez et al., 2009;
sures into volatile organic compounds (VOCs), intermediate-        Hallquist et al., 2009). These BVOCs are oxidized in the gas
volatility organic compounds (IVOCs), semi-volatile or-            phase by oxidants, such as OH, O3 and NO3 , to form less
ganic compounds (SVOCs), low-volatility organic com-               volatile compounds through addition of oxygen-containing
pounds (LVOCs), extremely low volatility organic com-              functional groups. In order to determine the role of different
pounds (ELVOCs) and ultra-low-volatility organic com-              oxidation products in SOA formation, it is essential to have
pounds (ULVOCs) (Donahue et al., 2012; Schervish and               reliable methods to estimate the volatility of complex organic
Donahue, 2020). In the ambient air, ULVOCs can nucle-              molecules formed in the atmosphere.

Published by Copernicus Publications on behalf of the European Geosciences Union.
1196 N. Hyttinen et al.: Vapor pressures of α -pinene + O3 products Monoterpenes (C10 H16 ) are an abundant class of BVOCs on which saturation vapor pressures could be further con- emitted by various plants (Guenther et al., 1995). The oxida- strained. tion mechanisms of monoterpene reactants vary significantly, Another possible complication in thermal desorption ex- leading to products with different SOA formation capabili- periments is thermal decomposition reactions during the ties (Thomsen et al., 2021). Additionally, the initial oxidant heating of the sample. For example, Stark et al. (2017) (i.e., OH, O3 and NO3 ) affects the SOA formation rates of studied the effect of thermal decomposition on the deter- the oxidation products (Kurtén et al., 2017). For example, α- mination of volatility distributions from FIGAERO–CIMS pinene, a very abundant monoterpene in the atmosphere, has measurements. They concluded that most of the condensed- been widely studied in both laboratory and field experiments phase species decompose during thermal desorption experi- (Docherty et al., 2005; Hall and Johnston, 2011; Hao et al., ments, in agreement with several other studies of laboratory 2011; Ehn et al., 2012, 2014; Kristensen et al., 2014; Lopez- and ambient FIGAERO measurements (Lopez-Hilfiker et al., Hilfiker et al., 2015; McVay et al., 2016; D’Ambro et al., 2015, 2016; Schobesberger et al., 2018). Most recently, Yang 2018; Huang et al., 2018; Claflin et al., 2018; Ye et al., 2019), et al. (2021) found that decarboxylation and dehydration re- and α-pinene oxidation, with both O3 and OH, is efficient at actions are significant in FIGAERO measurements for multi- producing oxygenated organic molecules and SOA. Conse- functional carboxylic acids that have more than four oxygen quently, the oxidation mechanism and potential structures of atoms, a degree of unsaturation between 2 and 4, and a max- α-pinene + O3 products have been extensively studied both imum desorption temperature (Tmax ) higher than 345 K. experimentally and computationally (Rissanen et al., 2015; Among theoretical models, the conductor-like screening Berndt et al., 2018; Kurtén et al., 2015; Iyer et al., 2021; model for real solvents (COSMO-RS; Klamt, 1995; Klamt Lignell et al., 2013; Aljawhary et al., 2016; Mutzel et al., et al., 1998; Eckert and Klamt, 2002) has been seen as the 2016; Kristensen et al., 2020; Thomsen et al., 2021). Vari- most promising method for calculating partitioning proper- ous methods have been used for estimating the saturation va- ties because it does not require calibration, unlike group- por pressures or saturation mass concentrations of α-pinene contribution methods (Wania et al., 2014). During recent ozonolysis products (Ehn et al., 2014; Kurtén et al., 2016; years, this quantum-chemistry-based method has been used D’Ambro et al., 2018; Buchholz et al., 2019; Peräkylä et al., to estimate saturation vapor pressures of atmospherically rel- 2020; Räty et al., 2021). However, measuring these satura- evant multifunctional compounds (Wania et al., 2014, 2015; tion vapor pressures accurately is extremely difficult (Sein- Kurtén et al., 2016; Wang et al., 2017; Krieger et al., 2018; feld and Pankow, 2003). Additionally, different experimental Kurtén et al., 2018; D’Ambro et al., 2019; Hyttinen et al., and theoretical methods are known to produce very different 2020, 2021b). For example, Kurtén et al. (2016) compared saturation vapor pressures (Bilde et al., 2015; Kurtén et al., COSMO-RS-derived saturation vapor pressures of 16 α- 2016; Bannan et al., 2017; Wania et al., 2017; Ylisirniö et al., pinene ozonolysis products with those estimated with vari- 2021). For example, the agreement between different experi- ous group-contribution methods. They found that COSMO- ments is better measuring at a subcooled state compared to a RS (parametrization BP_TZVPD_FINE_C30_1501 imple- solid state, perhaps due to ambiguity of the physical state of mented in the COSMOtherm program; COSMOtherm, 2015) the solid-state samples (Bilde et al., 2015). predicts saturation vapor pressures of up to 8 orders of During recent years, saturation vapor pressures of atmo- magnitude higher than group-contribution methods, such as spherically relevant multifunctional organics have been de- EVAPORATION (Compernolle et al., 2011) and SIMPOL.1 rived from their desorption temperatures using mass spec- (Pankow and Asher, 2008). The COSMOtherm15-estimated trometers equipped with the Filter Inlet for Gases and saturation vapor pressures indicated that the studied highly AEROsols (FIGAERO; Lopez-Hilfiker et al., 2014). Using oxidized monomers derived from the ozonolysis of α-pinene this method, the saturation vapor pressures can be estimated were likely classified as SVOCs with saturation vapor pres- from the desorption temperatures of the molecules. However, sures higher than 10−5 Pa (Kurtén et al., 2016). However, the measurements need to be calibrated using compounds the parametrization in COSMOtherm has a large effect on with known saturation vapor pressures in order to find the the calculated properties since the model is parametrized correlation between saturation vapor pressure and desorp- using a set of well-known compounds with experimental tion temperature. For example, a recent experimental study properties available. There have been significant improve- highlighted how different sample preparation methods af- ments since the BP_TZVPD_FINE_C30_1501 parametriza- fect measured desorption temperatures of FIGAERO calibra- tion used by Kurtén et al. (2016), especially with better de- tion experiments (Ylisirniö et al., 2021), and aerosol parti- scription of the effect of hydrogen bonding on thermody- cle size and operational parameters generally affect the mea- namic properties. This is an important factor in calculat- surement results as well (Schobesberger et al., 2018; Thorn- ing properties of multifunctional compounds that are able ton et al., 2020). Additionally, when the desorbed molecules to form intramolecular hydrogen bonds (H-bonds). For ex- are detected using a chemical ionization mass spectrome- ample, Hyttinen et al. (2021b) found that with an improved ter (CIMS), only the elemental compositions are obtained conformer sampling method (recommended by Kurtén et al., without any information on the chemical structures, based 2018) and a newer parametrization (BP_TZVPD_FINE_19), Atmos. Chem. Phys., 22, 1195–1208, 2022 https://doi.org/10.5194/acp-22-1195-2022
N. Hyttinen et al.: Vapor pressures of α -pinene + O3 products                                                              1197

COSMOtherm-estimated saturation vapor pressures of the            30 ppb of externally generated ozone (using an ozone gen-
two most highly oxygenated α-pinene ozonolysis monomer            erator with a UV lamp of wavelength 185 nm) was intro-
products studied by Kurtén et al. (2016) are up to 2 or-          duced into the reaction chamber to start the chemistry. The
ders of magnitude lower than SIMPOL.1 estimates, while            experiment duration was 8 h from when the chemistry started
COSMOtherm predicted higher saturation vapor pressures            (ozone was added). There was practically no change in the
than SIMPOL.1 for 15 different α-pinene + OH-derived              chamber size during the experiment due to the low sampling
dimers.                                                           flows compared to the total chamber volume.
   In this study, we investigate the saturation vapor pres-
sures of SOA constituents formed in α-pinene ozonolysis,          2.1.1   Instrumentation
using both FIGAERO–CIMS experiments and the COSMO-
RS theory. We are especially interested in whether the cal-       In this study, we analyzed particle-phase composition mea-
ibration done using compounds with saturation vapor pres-         surements performed with a Filter Inlet for Gases and
sures limited to the LVOC–SVOC range is valid for estimat-        AEROsols (FIGAERO) inlet system coupled with a time-of-
ing saturation vapor pressures of ELVOCs and ULVOCs. We           flight chemical ionization mass spectrometer with iodide ion-
compare saturation vapor pressures derived from both exper-       ization (I-CIMS, Aerodyne Research Inc.), a system that al-
iments and calculations (different isomers) in order to evalu-    lows for measurement of both gas-phase and particle-phase
ate the experimental method. Additionally, we investigate the     compounds with a single instrument (Lopez-Hilfiker et al.,
prevalence of thermal decomposition in our experiment.            2014, 2015; Ylisirniö et al., 2021). In the FIGAERO inlet, the
                                                                  aerosol particles are collected on a Teflon filter (Zefluor 2 µm
                                                                  PTFE membrane filter, Pall Corp.) while simultaneously an-
2     Methods
                                                                  alyzing the gas phase. After a predetermined collection time
2.1    Chamber experiments
                                                                  (here 45 min) is finished, the sampled particle matter is evap-
                                                                  orated using a gradually heated nitrogen flow with a heat-
The experiments were conducted at a 9 m3 Teflon environ-          ing rate of 11.7 K min−1 and the evaporated molecules are
mental reaction chamber. The chamber is located at the Uni-       carried into the detector instrument I-CIMS. Integrating over
versity of Eastern Finland (Kuopio, Finland). During the ex-      the heating time will give the total signal of a particular com-
periment, the chamber was operated as a batch reactor; i.e.,      pound in the sample being processed. The working princi-
the experimental conditions were set at the start of the exper-   ple of the I-CIMS has been introduced elsewhere (Lee et al.,
iment, and after the chemistry was initiated, the proceeding      2014; Iyer et al., 2017), but in short, oxidized gas-phase con-
changes in the gas and particle phase in the closed system        stituents are detected by clustering negatively charged iodide
were sampled. The chamber is set on a foldable frame which        anions (I− ) with suitable organic compounds. Clustering of
allows the chamber to collapse when deflated, maintaining a       the organic molecules and I− happens in an ion molecule re-
constant pressure. The chamber and the instruments were sit-      action chamber (IMR), which is actively controlled to be at
uated inside a temperature-controlled environment (temper-        104 Pa pressure.
ature set to 295.15 K). Before the experiment, the chamber           The particle sampling period was set to 45 min, and the
was flushed overnight with dry, clean air to reduce the im-       particle analysis period consisted of a 15 min ramping time
pact of evaporation of residues from preceding experiments        (when the filter was heated linearly from room temperature
from the walls.                                                   to 473.15 K) and a 15 min soak period (where the filter tem-
    To prepare the chamber for the experiment, it was first       perature was kept at 473.15 K). Thus, there is 45 min of gas-
filled with clean air, which was sampled by a proton-transfer-    phase measurements followed by a 30 min gap while particle
reaction time-of-flight mass spectrometer (PTR-ToF-MS,            chemical composition is being analyzed. Seven particle sam-
Ionicon, Inc.), and a Filter Inlet for Gases and AEROsols         ples were collected during the 8 h SOA experiment.
(FIGAERO) coupled with a time-of-flight chemical ion-
ization mass spectrometer (ToF CIMS) to determine the             2.1.2   Data analysis
chamber background. The next section will provide a more
thorough description of the instruments. After the cham-          All FIGAERO–CIMS data were preprocessed with tofTools
ber was filled close to operational capacity (9 m3 ), α-pinene    (version 611) running in MATLAB R2019b (MATLAB,
was introduced into the chamber. This was done by flush-          2019) and further processed with custom MATLAB scripts.
ing dry purified air through an α-pinene diffusion source         Saturation vapor pressures of the oxidized organics were es-
and into the chamber until target concentration (11 ppb)          timated based on their thermograms, i.e., signal as a function
was reached. α-Pinene levels were monitored with an on-           of temperature along the heating of the particle sample in FI-
line PTR-ToF-MS. Polydisperse ammonium sulfate seed               GAERO. We used 20 s averaging in the thermograms. The
aerosol (∼ 10 000 cm−3 , maximum number concentration at          temperature axis calibration sample was made as described
∼ 80 nm) was added to provide condensation nuclei and to          by Ylisirniö et al. (2021), by using an atomizer to produce
prevent possible nucleation during the experiments. Lastly,       a particle population with a similar size distribution to the

https://doi.org/10.5194/acp-22-1195-2022                                          Atmos. Chem. Phys., 22, 1195–1208, 2022
1198 N. Hyttinen et al.: Vapor pressures of α -pinene + O3 products
one present in the chamber experiment. Polyethylene glycol In the case of similar multifunctional compounds, the activ-
(PEGn with n equal to 6, 7 and 8) with known saturation va- ity coefficients of individual compounds in the mixture (es-
por pressures (see Fig. S1 and Table S1 in the Supplement) timated using COSMOtherm) are likely to be close to unity,
was used to produce the calibration particle population. Fol- with respect to the pure compound reference state (the com-
lowing the calibration fit, the saturation vapor pressure (psat pound has similar chemical potentials in a pure state and in
in Pa) of a molecule can be calculated from the temperature the mixture, which leads to activity coefficients close to 1
of the highest signal (Tmax in K): in COSMOtherm calculations). We therefore assume that the
mixture is ideal and estimate saturation vapor pressures from
psat = e−0.1594·Tmax +40.13 . (1)
desorption temperatures.
Ylisirniö et al. (2021) found a good exponential correla-
tion between the temperature of the highest signal and satura- 2.2 COSMOtherm calculations
tion vapor pressure ranging up to psat = 5 × 10⁻⁴ Pa (PEG5).
However, like theirs, our calibration only reached down to Our experiments provided us with elemental compositions
9 × 10⁻⁸ Pa in saturation vapor pressure, which introduces of compounds in our SOA sample and saturation vapor
an additional source of uncertainty to the saturation vapor pressures corresponding to each composition. To compare
pressures estimated from the experiments. In addition to the with the experiments, we computed saturation vapor pres-
linear correlation between Tmax and log10 psat , Ylisirniö et al. sures of potential ozonolysis product structures correspond-
(2021) proposed a polynomial calibration curve, which leads ing to the measured elemental compositions using the
to lower saturation vapor pressure estimates at higher des- COSMO-RS theory with the newest BP_TZVPD_FINE_21
orption temperatures (Tmax > 350 K). With our three calibra- parametrization, implemented in the COSMOtherm program
tion points, it is impossible to find a reliable polynomial fit Release 2021 (BIOVIA COSMOtherm, 2021). COSMO-
to extrapolate to a higher Tmax . Instead, we assume a similar RS uses statistical thermodynamics to predict properties of
difference between the two calibration curves to what was molecules in both condensed and gas phases. The interac-
estimated by Ylisirniö et al. (2021). For example, using our tions between molecules in the condensed phase are de-
linear fit, 392 K corresponds to 2 × 10⁻¹⁰ Pa, but in the poly- scribed using the partial charge surfaces of the molecules de-
nomial fit, the same Tmax corresponds to about 10−11 Pa (see rived from quantum chemical calculations.
Table S2 and Fig. S2 for more values). For our COSMO-RS calculations, we selected conform-
The variation in Tmax values between three calibration runs ers containing no intramolecular H-bonds, detailed previ-
varies from 0.5 K for the smallest, PEG6 (282.3 g mol−1 ), to ously by Kurtén et al. (2018), Hyttinen and Prisle (2020),
7.6 K for the largest, PEG8 (370.4 g mol−1 ). With our cali- and Hyttinen et al. (2021b). This method has been shown
bration curve, these differences correspond to a factor of 1.1 to provide more reliable saturation vapor pressure estimates
and 3.3 variation in the saturation vapor pressures, respec- for multifunctional oxygenated organic compounds even if
tively. Saturation vapor pressures were calculated for mul- they are able to form intramolecular H-bonds (Kurtén et al.,
tiple α-pinene-derived SOA constituents from six different 2018). Additionally, Hyttinen and Prisle (2020) found that in
samples, i.e., six different subsequent thermal desorptions, COSMOtherm, conformers containing multiple intramolec-
during the one 8 h experiment. The first sample of our ex- ular H-bonds are given high weights in the conformer distri-
periment was omitted because the signals were much lower bution due to their low COSMO energies, even if conformers
in the first sample than in the other samples. This was likely containing no intramolecular H-bonds would be more sta-
caused by lower concentrations of oxidation products in the ble in the condensed phase. The conformer search was per-
chamber at the beginning of the experiment. In our experi- formed using the Merck molecular force field (MMFF94;
ment, the variation in Tmax values between the different ther- Halgren, 1996) and the systematic algorithm (sparse system-
mal desorption cycles ranged from 2.0 to 11.1 K. The varia- atic algorithm for isomers that have more than 100 000 pos-
tion in Tmax values increases with the increasing molar mass sible conformers) of Spartan’14 (Wavefunction Inc., 2014).
(see Fig. S3). The 11.1 K variation corresponds to a factor Instead of omitting conformers containing intramolecular H-
of 5.8 variation in psat . Most of the studied compounds have bonds after running the quantum chemical calculations, as
saturation vapor pressures within a factor of 4 from the six recommended by Kurtén et al. (2018), we removed conform-
measurement cycles. ers containing intramolecular H-bonds already after the ini-
We used desorption temperatures to estimate saturation tial conformer search step in order to decrease the number of
vapor pressures even though the particle-to-gas partition- density functional theory (DFT) calculations needed for the
ing in our experiment is also affected by the activity coeffi- input file generation (see Sect. S1 in the Supplement for the
cient of the compound in the sample. For example, Ylisirniö details).
et al. (2021) found a 5–7 K difference in the temperatures The quantum chemical single-point calculations and
of maximum desorption signal between pure PEG and PEG- geometry optimizations were performed using the
400 mixture (average molecular mass ∼ 400 g mol−1 ), which COSMOconf program (BIOVIA COSMOconf, 2021),
they attributed to the additional compounds in the mixture. which utilizes the TURBOMOLE program package (TUR-
Atmos. Chem. Phys., 22, 1195–1208, 2022 https://doi.org/10.5194/acp-22-1195-2022N. Hyttinen et al.: Vapor pressures of α -pinene + O3 products 1199
BOMOLE V7.4.1, 2019). First, single-point calculations unsaturation of the studied monomers and dimers is 1–4
at a low level of theory (BP/SV(P)-COSMO) were used and 4–5, respectively, determining how many double bonds
to remove conformers with similar chemical potentials. or ring structures each isomer must contain.
After a geometry optimization at the same level, duplicate The structures of the studied monomers were formed
conformers with similar geometries and chemical potentials based on structures suggested by previous experimental and
were omitted. Duplicates were also removed after the computational studies (Lignell et al., 2013; Aljawhary et al.,
final optimization at the higher level of theory (BP/def- 2016; Mutzel et al., 2016; Kristensen et al., 2014; Kurtén
TZVP-COSMO), and final single-point energies were et al., 2015; Iyer et al., 2021). These structures are shown
calculated for the remaining conformers at the highest level in Figs. S4–S8. For dimer calculations, we selected ele-
of theory available in the current COSMOtherm version mental compositions that can be formed using the studied
(BP/def2-TZVPD-FINE-COSMO, currently only available monomer structures, assuming a loss of H2 O2 , H2 O or no
for single-point calculations). Finally, the intramolecular hy- atoms from the original monomers. With a loss of H2 O2
drogen bonding of each remaining conformer was checked or H2 O, a dimer can be formed by a recombination of two
using the pr_steric keyword in COSMOtherm and up to hydroperoxy or hydroxy groups to form a peroxide or an
40 conformers containing no intramolecular H-bonds were ether. Additionally, if one or both of the monomers are car-
selected for our saturation vapor pressure calculations (see boxylic acids, the dimer contains an ester or an acid anhy-
Kurtén et al., 2018, for more details). The gas-phase energies dride (RC(=O)OC(=O)R0 ) group, respectively. A dimer can
of the selected conformers were obtained by optimizing the also be formed in a condensed-phase reaction between a hy-
condensed-phase geometries and calculating single-point en- droxide and an aldehyde to form a hemiacetal (ROR0 OH).
ergies at the levels of theory corresponding to the COSMO In hemiacetal formation, no atoms are lost from the reactant
calculations (BP/def-TZVP-GAS and BP/def2-TZVPD- monomers. In order to reduce the number of computation-
GAS, respectively). Gas-phase conformers containing ally heavy dimer calculations, we selected only one pair of
intramolecular H-bonds (formed in the gas-phase geometry monomer isomers with the same elemental composition for
optimization) were omitted, and the gas-phase single-point each dimerization reaction. For most of the monomers used
energy of the corresponding condensed-phase geometry to form the studied dimers, the best agreement between ex-
was used instead. When all conformers found contained perimental and computational saturation vapor pressures was
intramolecular H-bonds, conformers containing a single found with the isomer that had the lowest COSMOtherm-
intramolecular H-bond were selected for the COSMO-RS estimated psat . We therefore mainly chose the monomer iso-
calculation (see Sect. S1). mers with the lowest psat to form the studied dimer isomers.
In COSMOtherm, the saturation vapor pressure (psat,i Table S4 shows which monomers were used to form each of
in mbar) of a compound is estimated using the free- the studied dimer isomers.
energy difference of the compound in the pure condensed Figure 1 shows COSMOtherm-estimated saturation vapor
(l) (g)
phase (Gi in kcal mol−1 ) and in the gas phase (Gi pressures of the studied isomers, as well as vapor pressures
−1 derived from the experimental Tmax values. The agreement
in kcal mol ):
between COSMOtherm-estimated and experimentally deter-
(l) (g)
− Gi −Gi /RT mined saturation vapor pressures is good for molar masses
psat,i = e . (2)
higher than 190 g mol−1 . Even with a limited selection of
Here R is the gas constant (in kcal K−1 mol−1 ) and T is the dimer structures, the agreement between COSMOtherm and
temperature (in K). FIGAERO–CIMS is very good, and even better agreement
could likely be found by selecting additional dimer isomers
for COSMOtherm calculations. Using a polynomial corre-
3 Results and discussion
lation between Tmax and log10 psat , the psat estimates of the
studied monomers (highest Tmax at 378 K) would likely de-
3.1 Saturation vapor pressures
crease by 1 order of magnitude or less (see Fig. S2). With
We selected 26 elemental compositions (20 monomers and such a small decrease, all of the studied monomers would
6 dimers) from our FIGAERO–CIMS measurements for the still be classified as LVOCs, with the exception of C9 H18 O10 ,
comparison with COSMOtherm-estimated saturation vapor which would be classified as an ELVOC. The experimental
pressures. All elemental compositions that contain up to saturation vapor pressures of the studied dimers (excluding
10 carbon atoms are assumed to be monomers (contain- C18 H26 O6 ) would decrease by 1 to 2 orders of magnitude,
ing carbon atoms only from the original reactant α-pinene), which would improve the agreement between the experi-
while compounds with 11–20 carbon atoms are assumed mental and calculated saturation vapor pressures. Until more
to be dimers (covalently bound accretion products of two accurate calibration of the FIGAERO–CIMS instrument be-
monomers). For COSMOtherm analysis, we selected one to comes available, the experimental psat from the linear and
seven isomer structures that can be formed from α-pinene polynomial fits can be used as upper and rough lower-limit
ozonolysis for each elemental composition. The degree of estimates, respectively.
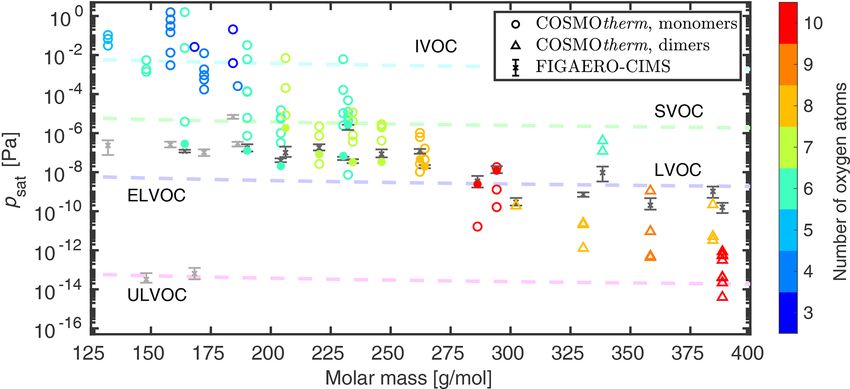
https://doi.org/10.5194/acp-22-1195-2022 Atmos. Chem. Phys., 22, 1195–1208, 20221200 N. Hyttinen et al.: Vapor pressures of α -pinene + O3 products Figure 1. Saturation vapor pressures of the studied α-pinene-derived ozonolysis products as a function of their molar mass at 298.15 K. The colors represent the number of oxygen atoms in each isomer. The isomers shown with filled markers have COSMOtherm-estimated psat values closest to those of the experiments. The bars of the experimental values show the range of saturation vapor pressures from the six samples used, instead of error estimates of the measurements. Suspected thermal decomposition products are shown with the lighter gray color. The dashed lines indicate different volatilities using the classification of Donahue et al. (2012) and Schervish and Donahue (2020) and assuming ideality (γ = 1) in the conversion from mass concentration to vapor pressure. The large discrepancy between the experimental and cal- nitude on saturation vapor pressure, and the addition of an culated psat of the lowest-molar-mass molecules (light gray oxygen atom (∼ 16 g mol−1 ) similarly has an effect of 0.5– bars in Fig. 1) suggests that the measured Tmax values 1 orders of magnitude on saturation vapor pressure depend- are related to the thermal decomposition temperatures of ing on the functional group (Hyttinen et al., 2021b). This larger compounds, rather than to saturation vapor pressures means that addition of an oxygen atom may decrease the sat- of the measured elemental compositions. It is unlikely that uration vapor pressure (in Pa per g mol−1 ) either less or more COSMOtherm would overestimate saturation vapor pres- than the addition of a CH2 group depending on the oxygen- sures by several orders of magnitude using the newest containing functional group. The COSMOtherm-estimated parametrization and improved conformer selection (Kurtén saturation vapor pressures can also vary by more than an or- et al., 2018). Additionally, if the low-molar-mass compounds der of magnitude for different stereoisomers with identical are IVOCs (psat > 10−2 Pa), as predicted by COSMOtherm, functional groups (Kurtén et al., 2018). they are not likely to contribute to the SOA formation. Con- Based on our FIGAERO–CIMS measurements, the stud- versely, the calibration curve sets a practical upper limit to ied monomer products derived from α-pinene ozonolysis experimentally derivable psat based on the experiment tem- present in the SOA are LVOCs or ELVOCs, while the studied perature and premature evaporation. For example, the upper dimers are mainly ELVOCs. We would like to note that this limit psat corresponding to the initial temperature of the ex- does not reflect the composition of α-pinene ozonolysis SOA periment (Tmax = 294.15 K) is 1.2 × 10⁻³ Pa. However, the but simply represents the set of elemental compositions se- highest experimental saturation vapor pressure among the lected for the analysis. The lowest experimental psat among studied molecules is 8.5 × 10⁻⁶ Pa, which corresponds to the studied elemental compositions is at 5.4 × 10⁻¹¹ Pa. Tmax = 325 K. This may indicate that the SOA constituents The saturation vapor pressure corresponding to the upper selected for our analysis do not contain SVOCs and the se- limit temperature of our experiment (Tmax = 473.15 K) is lected elemental compositions corresponding to SVOCs in 4.7 × 10⁻¹⁶ Pa (linear calibration curve), which means that the experiments were in fact thermal decomposition products saturation vapor pressures below 4.7 × 10⁻¹⁶ Pa cannot be rather than oxidation products of α-pinene ozonolysis. estimated in our experiments. It is also possible that satu- Both the computational and experimental psat values cor- ration vapor pressures of dimers with the lowest volatilities relate with molar mass, the O : C ratio having a smaller ef- (psat < 10−11 Pa) cannot be estimated using thermal desorp- fect on psat . In addition to molar mass, saturation vapor pres- tion, as the molecules would thermally decompose before sure is known to depend on the functional groups of the evaporating from the sample (Yang et al., 2021). molecule, as is seen in the difference of several orders of magnitude in the COSMOtherm estimates of different iso- mers at the same elemental compositions. We have previ- ously noted that the addition of a CH2 (∼ 14 g mol−1 ) to a multifunctional molecule has an effect of 0.5 orders of mag- Atmos. Chem. Phys., 22, 1195–1208, 2022 https://doi.org/10.5194/acp-22-1195-2022
N. Hyttinen et al.: Vapor pressures of α -pinene + O3 products                                                                 1201

3.2   Correlation between monomer and dimer vapor
      pressures
The COSMOtherm calculations of dimers are computation-
ally more demanding than those of monomers, due to a larger
size and higher number of possible conformers. In group-
contribution methods, such as SIMPOL.1, the saturation va-
por pressure of a compound is estimated as the sum of con-
tributions of each of the functional groups in the molecule:
log10 psat,i = 6k νk,i bk ,                                (3)
where νk,i is the number of functional groups of type k in
compound i.
   We used the same approach to estimate the saturation va-
por pressures of dimers and compared those values to satu-
ration vapor pressures estimated using COSMOtherm. How-
ever, instead of using the functional groups of the dimer, we
used the contributions of the two monomers that formed the
dimer. This way, the group-contribution term bk was replaced
by COSMOtherm-estimated saturation vapor pressures of the
monomers multiplied with a scaling factor (Sn ) to account for    Figure 2. Correlation between COSMOtherm-estimated satura-
the changing functional groups and loss of atoms in dimer-        tion vapor pressures of the studied dimers (psat ) and the product
ization reaction n.                                               monomer vapor pressures (psat,monomer ) at 298.15 K. The dimers
                                                                  are ordered from the smallest molar mass to the highest. The devia-
psat,dimer = Sn psat,monomer1 psat,monomer2                (4)    tion from the 1 : 1 line represents the S value of Eq. (4).
   Many of the monomer isomers had to be altered slightly
to accommodate the chosen dimerization reactions, which
                                                                  COSMOtherm-estimated saturation vapor pressures of the
makes a direct comparison between monomers and dimers
                                                                  studied dimer with the highest molar mass (C17 H24 O10 ) are
impossible. We therefore only investigate the acid anhydride
                                                                  much lower than the experimental ones, with a difference
formation, for which we have the most dimers to compare.
                                                                  of around a factor of 2 between the highest COSMOtherm
For this comparison we formed additional C13 H18 O9 dimers
                                                                  estimate and the lowest experimental value. Assuming that
from all carboxylic acid isomers of C5 H8 O6 and C8 H12 O4 in
                                                                  C17 H24 O10 is an acid anhydride formed from C8 H12 O4 and
order to better test the effect of molar mass on S.
                                                                  C9 H14 O7 , trying all combinations of the studied carboxylic
   Figure 2 shows the correlation between the
                                                                  acid isomers gives a psat range of 5.6 × 10⁻¹⁴ –7.0 × 10⁻⁹ Pa
COSMOtherm-estimated saturation vapor pressures of
                                                                  using Eq. (4) and S = (1.0–9.5) × 10−2 . This range overlaps
dimers and those of the monomers that were used to form
                                                                  with the experimental range of 8.1 × 10⁻¹¹ –2.7 × 10⁻¹⁰ Pa
the dimers. We see that the product of monomer vapor
                                                                  (see Fig. 1).
pressures is 1–3 orders of magnitude higher than the dimer
vapor pressure. There is also a size dependence in the
scaling factor; the values of S as a function of dimer size are   3.3   Thermal decomposition
shown in Fig. S14. Of the studied acid anhydride dimers,          A recent study by Yang et al. (2021) proposed two ma-
C13 H18 O9 (the smallest dimer) isomers have scaling factors      jor thermal decomposition pathways for multifunctional car-
of 10−3 –10−2 and C17 H24 O10 (the largest dimer) isomers         boxylic acids occurring in FIGAERO–CIMS: dehydration
of 10−2 –10−1 . As a comparison, SIMPOL.1 predicts                (Reaction R1) and decarboxylation (Reaction R2).
S = 1.1 × 10⁻² for the acid anhydride (ketone and ester)
formation from two carboxylic acid monomers, with no size         HOC(=O)RC(=O)OH → R1C(=O)OC(=O)R1 + H2 O                     (R1)
dependence.                                                       RC(=O)CH2 C(=O)OH → RC(=O)CH3 + CO2                          (R2)
   The correlation between COSMOtherm-estimated satura-
tion vapor pressures of monomers and dimers can be used to           We selected four elemental compositions (C7 H10 O4 ,
obtain rough saturation vapor pressures estimates of a larger     C7 H10 O6 , C8 H12 O4 and C8 H12 O6 ) to investigate the two
number of dimer compounds by computing only the satura-           possible thermal decomposition reactions. The different iso-
tion vapor pressures of their constituent monomers. This re-      mers of C7 H10 O4 , C7 H10 O6 , C8 H12 O4 and C8 H12 O6 and
duces the computational cost of dimer calculations since the      their thermal decomposition reactants are shown in Figs. S11
number of conformers and the calculation times increase ex-       and S12. These elemental compositions were selected be-
ponentially with the size of the molecule. For example, the       cause their experimental and COSMOtherm-estimated sat-

https://doi.org/10.5194/acp-22-1195-2022                                          Atmos. Chem. Phys., 22, 1195–1208, 2022
1202 N. Hyttinen et al.: Vapor pressures of α -pinene + O3 products uration vapor pressures had large differences. Additionally, SIMPOL.1-estimated saturation vapor pressures of the reac- their elemental compositions are possible products of both of tants and products are 4.9 and 3.9 orders of magnitude for the studied reactions. Both reactions are possible only if the the dehydration and decarboxylation reactions, respectively. product contains fewer than 10 carbon atoms (the monomer Based on this, it is unlikely that the detected molecule is reactant of the dehydration reaction can contain up to 10 car- formed in either of these specific thermal decomposition re- bon atoms) and the degree of unsaturation is at least 3 (the actions if the COSMOtherm-estimated psat of the detected product of dehydration contains at least one ring structure molecule is more than 7 orders of magnitude higher than the and two double bonds). The thermal decomposition reactants psat derived from FIGAERO–CIMS experiments. In those also fulfill the number-of-oxygen and degree-of-unsaturation cases, the reactant is likely a larger monomer or even a dimer criteria given by Yang et al. (2021). Other likely decompo- that decomposes to form two large fragments. sition products among the studied monomers are C4 H4 O5 , It is also possible that other molecules detected in our C4 H4 O6 , C9 H12 O3 , C10 H16 O3 and C9 H14 O4 (see Fig. 1). FIGAERO–CIMS experiments are thermal decomposition Figure 3 shows the COSMOtherm-estimated psat of the products formed during the heating of the sample, though it is studied thermal decomposition product isomers of C7 H10 O4 , impossible to determine if this is true based only on informa- C7 H10 O6 , C8 H12 O4 and C8 H12 O6 in red markers. The cor- tion available from our measurements and calculations. If the responding reactants are shown in blue markers at the prod- decomposition temperature is lower than the Tmax of the de- uct molar mass, and experimental psat values of the prod- composition product molecule, the measured Tmax values can uct elemental compositions are given as a range of the six correspond to the saturation vapor pressures of the decompo- measurement points. The studied thermal decomposition re- sition products. However, this possibility was not taken into action is possible if the COSMOtherm-estimated saturation account when we selected the isomers for the COSMOtherm vapor pressure of the reactant molecule is lower than the ex- calculations. perimental saturation vapor pressure of the product elemental composition. Otherwise, the reactant would desorb from the 3.4 Comparison with previous studies sample before the thermal decomposition reaction has taken place. For example, the elemental composition of C7 H10 O4 Recently, Thomsen et al. (2021) identified multiple car- at 158.15 g mol−1 and its reactants C8 H10 O6 (decarboxyla- boxylic acids in SOA formed in α-pinene ozonolysis ex- tion) and C7 H12 O5 (dehydration) all have higher estimated periments using an ultra-high-performance liquid chromato- saturation vapor pressures than the one derived experimen- graph (UHPLC). Out of the compounds included in Thomsen tally (though Reactant-1 vapor pressure is close to the ex- et al. (2021), elemental compositions corresponding to di- perimental one; see Fig. 3). This indicates that the measured aterpenylic acid acetate (DTAA, C10 H16 O6 ), 3-methyl-1,2,3- C7 H10 O4 is likely not a product of dehydration. The de- butanetricarboxylic acid (MBTCA, C8 H12 O6 ), OH-pinonic carboxylation reaction is a possible source of the measured acid (C10 H16 O4 ), oxo-pinonic acid (C10 H14 O4 ), pinonic acid C7 H10 O4 , assuming under- or overestimation of the satura- (C10 H14 O3 ) and terpenylic acid (C8 H12 O4 ) were measured tion vapor pressure by our experiments or COSMOtherm, re- in our FIGAERO–CIMS experiments. In addition, an ele- spectively. Another possibility is that the measured C7 H10 O4 mental composition corresponding to pinic acid (C9 H14 O4 ) is a fragmentation product of some other thermal decomposi- was seen in our experiments, but we were not able to tion reaction, where the reactant has an even lower saturation determine Tmax values from the thermogram. Previously, vapor pressure. For C8 H12 O4 , C7 H10 O6 and C8 H12 O6 , some Kurtén et al. (2016) calculated saturation vapor pressures of of the studied thermal decomposition reactants have satura- C10 H16 O4 , C10 H16 O6 and C10 H16 O8 with several isomers tion vapor pressures lower than the experimental psat . This not included in our calculations using COSMOtherm15. In means that the reactant molecules would remain in the sam- Table 1, we have summarized the saturation vapor pressures ple at the measured Tmax (i.e., potential thermal decompo- of the carboxylic acids identified by Thomsen et al. (2021), sition temperature). The measured C8 H12 O4 is more likely as well as all studied isomers of C10 H16 O4 , C10 H16 O6 a product of decarboxylation than dehydration because the and C10 H16 O8 , from our FIGAERO–CIMS measurements, proposed dehydration reactant has a higher COSMOtherm- COSMOtherm and SIMPOL.1 calculations, and previous estimated saturation vapor pressure than the experimental studies. The experimental saturation vapor pressures from psat of the product C8 H12 O4 . C7 H10 O6 and C8 H12 O6 have previous studies (Bilde and Pandis, 2001; Lienhard et al., similar estimated and experimental saturation vapor pres- 2015; Babar et al., 2020) are given for the specific isomer, sures, and the measured molecules can therefore be either while COSMOtherm15 values (Kurtén et al., 2016) are for thermal decomposition products or simply relatively low various other isomers. volatility isomers. Based on COSMOtherm-estimated saturation vapor pres- The saturation vapor pressures of the thermal decomposi- sures, it is unlikely that the Tmax values of pinic acid, pinonic tion reactant molecules are 3.3–6.5 (on average 4.7) orders of acid, terebic acid and terpenylic acid could be determined in magnitude lower than the saturation vapor pressures of the our FIGAERO–CIMS experiments due to their high volatil- corresponding product molecules. The differences between ities. The FIGAERO–CIMS-derived saturation vapor pres- Atmos. Chem. Phys., 22, 1195–1208, 2022 https://doi.org/10.5194/acp-22-1195-2022
N. Hyttinen et al.: Vapor pressures of α -pinene + O3 products                                                                                                                          1203

Figure 3. Saturation vapor pressures of potential products (red markers) and the reactants (blue markers) of thermal decomposition reactions
(CO2 loss: × or +; H2 O loss: ◦). The structures of the studied thermal decomposition reactants and products of C7 H10 O6 are shown here as
an example; the structures for the other three elemental compositions are shown in Figs. S11 and S12. Note that the reactant molecules are
plotted with the same molar mass as the corresponding product molecule, instead of the molar mass of the reactant molecule.

Table 1. Saturation vapor pressures of carboxylic acids in pascals. COSMOtherm-, FIGAERO–CIMS- and SIMPOL.1-derived saturation
vapor pressures are given at 298.15 K.

 Molecule name            Formula                                                    psat , this study                                                        psat , previous studies
                                             FIGAERO–CIMSf                COSMOtherm21                          SIMPOL.1                             Experiments             COSMOtherm15
 Terebic acid             C7 H10 O4          1.9 × 10⁻⁷ to                3.0 × 10⁻³                            1.5 × 10⁻¹                           –                       –
                                             3.7 × 10⁻⁷
 Terpenylic acid          C8 H12 O4          6.7 × 10⁻⁸ to                1.7 × 10⁻⁴                            5.5 × 10⁻²                           (1.7 ± 0.3) × 10−4 c    –
                                             1.5 × 10⁻⁷
 MBTCA                    C8 H12 O6          3.3 × 10⁻⁸ to                3.2 × 10⁻⁷                            8.4 × 10⁻⁸                           (1.4 ± 0.5) × 10−6 b    –
                                             5.1 × 10⁻⁸                                                                                              (3.4 ± 0.6) × 10−5 c
                                                                                                                                                     (2.2 ± 1.6) × 10−8 d
 Pinic acid               C9 H14 O4          –                            2.6 × 10⁻⁴                            9.8 × 10⁻⁵                           3.2 × 10⁻⁵ a            –

 Pinonic acid             C10 H16 O3         5.4 × 10⁻⁶ to                3.9 × 10⁻³                            1.4 × 10⁻²                           7.0 × 10⁻⁵ a            –
                                             8.5 × 10⁻⁶
 OH-pinonic               C10 H16 O4         –                            1.0 × 10⁻⁵                            9.0 × 10⁻⁵                           –                       1.5 × 10⁻² to
 acid                                                                                                                                                                        5.2 × 10⁻² e
 DTAA,                    C10 H16 O6         1.4 × 10⁻⁶ to                1.7 × 10⁻⁶ ,                          2.5 × 10⁻⁶ ,                         (1.8 ± 0.2) × 10−5 c    9.3 × 10⁻⁴ to
 other isomers                               2.7 × 10⁻⁶                   7.4 × 10⁻⁹ to 4.8 × 10⁻⁵              3.3 × 10⁻⁷ to 3.2 × 10⁻³                                     3.6 × 10⁻² e
 Various isomers          C10 H16 O8         1.6 × 10⁻⁸ to                1.9 × 10⁻⁸ to                         1.6 × 10⁻⁹ to                        –                       9.4 × 10⁻⁵ to
                                             2.3 × 10⁻⁸                   1.6 × 10⁻⁷                            2.4 × 10⁻⁴                                                   1.5 × 10⁻² e

Experiments: a 296 K, Bilde and Pandis (2001). b 298.15 K, Lienhard et al. (2015). c 298.15 K, Babar et al. (2020). d 298 K, Kostenidou et al. (2018).
COSMOtherm: e 298.15 K, Kurtén et al. (2016) (different isomers).
f The isomers detected in the FIGAERO–CIMS experiments may be different or products of thermal decomposition.

https://doi.org/10.5194/acp-22-1195-2022                                                                                           Atmos. Chem. Phys., 22, 1195–1208, 2022
1204 N. Hyttinen et al.: Vapor pressures of α -pinene + O3 products
sures of C8 H12 O6 and C10 H16 O6 agree with previous mea- CIMS. The measured α-pinene ozonolysis monomer prod-
surements of MBTCA and DTAA by Babar et al. (2020) and ucts selected from our SOA sample are mainly LVOCs,
Kostenidou et al. (2018), respectively. The difference of 3 or- and dimers are mainly ELVOCs. The smaller monomers
ders of magnitude in experimentally determined saturation (Mw < 190 g mol−1 ) with the highest saturation vapor pres-
vapor pressures of MBTCA (Lienhard et al., 2015; Babar sures (IVOCs) were likely not present in the sample aerosol
et al., 2020; Kostenidou et al., 2018) demonstrates how dif- collected from the chamber; instead, they are likely products
ferent experimental methods give widely different values. of thermal decomposition formed from larger compounds
Kurtén et al. (2016) computed saturation vapor pres- during the experiment.
sures of isomers that are potential products of gas-phase Comparison between estimated and experimental psat can
autoxidation, rather than products of condensed-phase re- provide insight about the possible chemical structures of
actions. The isomers in Kurtén et al. (2016) therefore con- SOA constituents. Based on our results, the commonly used
tain mainly carbonyl, hydroperoxide and peroxy acid groups. FIGAERO–CIMS instrument is best suited for measuring
Using a combination of group-contribution methods and saturation vapor pressures of monoterpene-derived highly
COSMOtherm15, they concluded that molecules with high oxygenated monomers in the LVOC and ELVOC range with
oxygen content are likely LVOCs. However, systematic con- Mw > 190 g mol−1 . Hence, it is reliable for estimating satura-
former sampling and newer COSMOtherm parametrizations tion vapor pressures of oxidation products of monoterpenes,
can lead to psat estimates in COSMOtherm that are several such as α-pinene, keeping in mind that the smallest mea-
orders of magnitude lower (Hyttinen et al., 2021b). Two of sured molecules are likely products of thermal decomposi-
the C10 H16 O6 isomers studied here were taken from Kurtén tion. COSMOtherm can be used to estimate saturation vapor
et al. (2016). Our saturation vapor pressure estimates are 2– pressures of compounds for which psat is outside the appli-
4 orders of magnitude lower than those estimated by Kurtén cable range of FIGAERO–CIMS experiments, i.e., IVOCs,
et al. (2016) (see Table S5). Our calculations and experi- SVOCs and ULVOCs, if the exact structures of the molecules
ments show that most of the studied dimers (C13 and higher are known.
carbon numbers) are likely ELVOCs (around psat < 10−9 Pa) In conclusion, this study gives us useful information for
and the studied monomers with high molar masses (i.e., C9 – studying saturation vapor pressures of multifunctional com-
C10 and O10 ) may be ELVOCs, while the studied monomers pounds and further information on the gas-to-particle parti-
with lower molar masses (around 190 < Mw < 275 g mol−1 ) tioning of the compounds, which is key when the SOA for-
are likely LVOCs (around 10−9 < psat < 10−5 Pa), with the mation is investigated. Recently, it has been shown that SOA
exception of some higher psat isomers at lower molar masses formation has a clear effect on both direct and indirect radia-
(Mw < 235 g mol−1 ). tive forcing (Yli-Juuti et al., 2021), highlighting the atmo-
We additionally compared our COSMOtherm vapor pres- spheric relevance of our study.
sures with those calculated with SIMPOL.1. The comparison
is shown in Fig. S13. We can see that with the molecules in
this study, SIMPOL.1 is more likely to overestimate than un- Data availability. The research data have been deposited in a re-
derestimate COSMOtherm-estimated saturation vapor pres- liable public data repository (the CERN Zenodo service) and can
sures. COSMOtherm-estimated saturation vapor pressures be accessed at https://doi.org/10.5281/zenodo.5499485 (Hyttinen
are up to a factor of 430 higher and up to a factor of 3.5 × 10⁴ et al., 2021a).
lower than those estimated using SIMPOL.1.
Supplement. The supplement related to this article is available
online at: https://doi.org/10.5194/acp-22-1195-2022-supplement.
4 Conclusions
We have shown that COSMOtherm-estimated saturation va-
Author contributions. SS, AV and TY designed the study; NH
por pressures agree (for Mw > 190 g mol−1 ) with those de- ran the COSMO-RS calculations; IP performed the experiments
rived from particle-phase thermal desorption measurements and wrote the experimental section; NH, IP and AN analyzed the
of the α-pinene ozonolysis SOA system, taking into account data; NH, SS, AV and TY interpreted the results; NH wrote the
the possibility of thermal decomposition. With our limited manuscript with contribution from all co-authors.
set of compounds, we cannot determine the lower-limit sat-
uration vapor pressure for which our experimental method
is valid. Additionally, our limited set of calibration com- Competing interests. At least one of the (co-)authors is a mem-
pounds further restricts our ability to reliably estimate sat- ber of the editorial board of Atmospheric Chemistry and Physics.
uration vapor pressures of the lowest-volatility compounds. The peer-review process was guided by an independent editor, and
However, molecules with ultra-low volatilities likely do not the authors also have no other competing interests to declare.
evaporate from the sample during the experiments without
fragmenting and are therefore not detected by FIGAERO–
Atmos. Chem. Phys., 22, 1195–1208, 2022 https://doi.org/10.5194/acp-22-1195-2022N. Hyttinen et al.: Vapor pressures of α -pinene + O3 products 1205
Disclaimer. Publisher’s note: Copernicus Publications remains Bilde, M., Barsanti, K., Booth, M., Cappa, C. D., Donahue, N. M.,
neutral with regard to jurisdictional claims in published maps and Emanuelsson, E. U., McFiggans, G., Krieger, U. K., Marcolli, C.,
institutional affiliations. Topping, D., Ziemann, P., Barley, M., Clegg, S., Dennis-Smither,
B., Hallquist, M., Hallquist, r. M., Khlystov, A., Kulmala, M.,
Mogensen, D., Percival, C. J., Pope, F., Reid, J. P., Ribeiro da
Acknowledgement. We thank Arttu Ylisirniö for his advice on Silva, M. A. V., Rosenoern, T., Salo, K., Soonsin, V. P., Yli-Juuti,
the instrument calibration. We thank CSC – IT Center for Science, T., Prisle, N. L., Pagels, J., Rarey, J., Zardini, A. A., and Ri-
Finland, for computational resources and the tofTools team for pro- ipinen, I.: Saturation Vapor Pressures and Transition Enthalpies
viding tools for mass spectrometry analysis. of Low-Volatility Organic Molecules of Atmospheric Relevance:
From Dicarboxylic Acids to Complex Mixtures, Chem. Rev.,
115, 4115–4156, https://doi.org/10.1021/cr5005502, 2015.
Financial support. This project has received funding from the BIOVIA COSMOconf: 2021, Dassault Systèmes, available at: http:
Academy of Finland (grant nos. 310682, 337550) and the European //www.3ds.com, last access: 29 January 2021.
Union’s Horizon 2020 research and innovation program, project BIOVIA COSMOtherm: Release 2021, Dassault Systèmes, avail-
FORCeS (grant no. 821205) and EUROCHAMP-2020 Infrastruc- able at: http://www.3ds.com, last access: 1 April 2021.
ture Activity (grant no. 730997). Buchholz, A., Lambe, A. T., Ylisirniö, A., Li, Z., Tikkanen, O.-
P., Faiola, C., Kari, E., Hao, L., Luoma, O., Huang, W., Mohr,
C., Worsnop, D. R., Nizkorodov, S. A., Yli-Juuti, T., Schobes-
berger, S., and Virtanen, A.: Insights into the O : C-dependent
Review statement. This paper was edited by Barbara Ervens and
mechanisms controlling the evaporation of α-pinene secondary
reviewed by two anonymous referees.
organic aerosol particles, Atmos. Chem. Phys., 19, 4061–4073,
https://doi.org/10.5194/acp-19-4061-2019, 2019.
Claflin, M. S., Krechmer, J. E., Hu, W., Jimenez, J. L., and Ziemann,
References P. J.: Functional group composition of secondary organic aerosol
formed from ozonolysis of α-pinene under high VOC and au-
Aljawhary, D., Zhao, R., Lee, A. K. Y., Wang, C., and Ab- toxidation conditions, ACS Earth Space Chem., 2, 1196–1210,
batt, J. P. D.: Kinetics, mechanism, and secondary organic https://doi.org/10.1021/acsearthspacechem.8b00117, 2018.
aerosol yield of aqueous phase photo-oxidation of α-pinene Compernolle, S., Ceulemans, K., and Müller, J.-F.: EVAPO-
oxidation products, J. Phys. Chem. A, 120, 1395–1407, RATION: a new vapour pressure estimation methodfor or-
https://doi.org/10.1021/acs.jpca.5b06237, 2016. ganic molecules including non-additivity and intramolec-
Babar, Z. B., Ashraf, F., Park, J.-H., Quang Dao, P. D., Cho, C. S., ular interactions, Atmos. Chem. Phys., 11, 9431–9450,
and Lim, H.-J.: Exploring Volatility Properties of Discrete Sec- https://doi.org/10.5194/acp-11-9431-2011, 2011.
ondary Organic Aerosol Constituents of α-Pinene and Polycyclic COSMOtherm: version C3.0, Release 15, COSMOlogic GmbH &
Aromatic Hydrocarbons, ACS Earth Space Chem., 4, 2299– Co. KG., Leverkusen, Germany, 2015.
2311, https://doi.org/10.1021/acsearthspacechem.0c00210, D’Ambro, E. L., Schobesberger, S., Zaveri, R. A., Shilling,
2020. J. E., Lee, B. H., Lopez-Hilfiker, F. D., Mohr, C., and
Bannan, T. J., Booth, A. M., Jones, B. T., O’Meara, S., Bar- Thornton, J. A.: Isothermal Evaporation of α-Pinene
ley, M. H., Riipinen, I., Percival, C. J., and Topping, D.: Ozonolysis SOA: Volatility, Phase State, and Oligomeric
Measured Saturation Vapor Pressures of Phenolic and Nitro- Composition, ACS Earth Space Chem., 2, 1058–1067,
aromatic Compounds, Environ. Sci. Technol., 51, 3922–3928, https://doi.org/10.1021/acsearthspacechem.8b00084, 2018.
https://doi.org/10.1021/acs.est.6b06364, 2017. D’Ambro, E. L., Schobesberger, S., Gaston, C. J., Lopez-Hilfiker,
Berndt, T., Mentler, B., Scholz, W., Fischer, L., Herrmann, F. D., Lee, B. H., Liu, J., Zelenyuk, A., Bell, D., Cappa, C.
H., Kulmala, M., and Hansel, A.: Accretion product for- D., Helgestad, T., Li, Z., Guenther, A., Wang, J., Wise, M.,
mation from ozonolysis and OH radical reaction of α- Caylor, R., Surratt, J. D., Riedel, T., Hyttinen, N., Salo, V.-
pinene: mechanistic insight and the influence of isoprene T., Hasan, G., Kurtén, T., Shilling, J. E., and Thornton, J.
and ethylene, Environ. Sci. Technol., 52, 11069–11077, A.: Chamber-based insights into the factors controlling epoxy-
https://doi.org/10.1021/acs.est.8b02210, 2018. diol (IEPOX) secondary organic aerosol (SOA) yield, compo-
Bianchi, F., Tröstl, J., Junninen, H., Frege, C., Henne, S., Hoyle, sition, and volatility, Atmos. Chem. Phys., 19, 11253–11265,
C. R., Molteni, U., Herrmann, E., Adamov, A., Bukowiecki, N., https://doi.org/10.5194/acp-19-11253-2019, 2019.
Chen, X., Duplissy, J., Gysel, M., Hutterli, M., Kangasluoma, J., Docherty, K. S., Wu, W., Lim, Y. B., and Ziemann, P. J.: Contri-
Kontkanen, J., Kürten, A., Manninen, H. E., Münch, S., Peräkylä, butions of organic peroxides to secondary aerosol formed from
O., Petäjä, T., Rondo, L., Williamson, C., Weingartner, E., Cur- reactions of monoterpenes with O3 , Environ. Sci. Technol., 39,
tius, J., Worsnop, D. R., Kulmala, M., Dommen, J., and Bal- 4049–4059, https://doi.org/10.1021/es050228s, 2005.
tensperger, U.: New particle formation in the free troposphere: Donahue, N. M., Kroll, J. H., Pandis, S. N., and Robinson, A. L.:
A question of chemistry and timing, Science, 352, 1109–1112, A two-dimensional volatility basis set – Part 2: Diagnostics of
https://doi.org/10.1126/science.aad5456, 2016. organic-aerosol evolution, Atmos. Chem. Phys., 12, 615–634,
Bilde, M. and Pandis, S. N.: Evaporation Rates and Vapor Pressures https://doi.org/10.5194/acp-12-615-2012, 2012.
of Individual Aerosol Species Formed in the Atmospheric Oxida-
tion of α- and β-Pinene, Environ. Sci. Technol., 35, 3344–3349,
https://doi.org/10.1021/es001946b, 2001.
https://doi.org/10.5194/acp-22-1195-2022 Atmos. Chem. Phys., 22, 1195–1208, 2022You can also read