Characteristics of surface energy balance and atmospheric circulation during hot-and-polluted episodes and their synergistic relationships with ...
←
→
Page content transcription
If your browser does not render page correctly, please read the page content below
Atmos. Chem. Phys., 21, 13443–13454, 2021
https://doi.org/10.5194/acp-21-13443-2021
© Author(s) 2021. This work is distributed under
the Creative Commons Attribution 4.0 License.

Characteristics of surface energy balance and atmospheric
circulation during hot-and-polluted episodes and their
synergistic relationships with urban heat islands over
the Pearl River Delta region
Ifeanyichukwu C. Nduka1 , Chi-Yung Tam2 , Jianping Guo3 , and Steve Hung Lam Yim1,4,5
1 Department  of Geography and Resource Management, Chinese University of Hong Kong,
Sha Tin, N.T., Hong Kong, China
2 Earth System Science Programme, Chinese University of Hong Kong, Sha Tin, N.T., Hong Kong, China
3 State Key Laboratory of Severe Weather, Chinese Academy of Meteorological Sciences, Beijing 100081, China
4 Stanley Ho Big Data Decision Analytics Research Centre, Chinese University of Hong Kong,

Sha Tin, N.T., Hong Kong, China
5 Asian School of the Environment, Nanyang Technological University, 50 Nanyang Avenue, 639798 Singapore

Correspondence: Steve Hung Lam Yim (yimsteve@gmail.com)

Received: 13 October 2020 – Discussion started: 8 December 2020
Revised: 24 February 2021 – Accepted: 20 March 2021 – Published: 10 September 2021

Abstract. This study analyzed the nature, mechanisms and       1   Introduction
drivers for hot-and-polluted episodes (HPEs) in the Pearl
River Delta, China. Numerical model simulations were con-      Air pollution and heat waves have been identified as major at-
ducted for the summer and autumn of 2009–2011. A total         mospheric environmental disasters (Khafaie et al., 2016; Xia
of eight HPEs were identified, mainly occurring in August      et al., 2018). Air pollution can vary at spatial scales rang-
and September. K-means clustering was applied to group         ing from local to global (Shi et al., 2020; M. Y. Wang et al.,
the HPEs into three clusters based on their characteristics    2019; Y. Wang et al., 2019; Yang et al., 2019; Yim et al.,
and mechanisms. We found three HPEs were driven by weak        2009, 2014, 2010, 2015). Studies have reported the signif-
subsidence and convection induced by approaching tropical      icant effects of air pollution on human health (Chen et al.,
cyclones (TC-HPE) and two HPEs were controlled by calm         2017; Gu et al., 2018; Liu et al., 2017), ecosystems and bio-
(stagnant) conditions (ST-HPE) with low wind speed in the      diversity (Lovett et al., 2009; Nowak et al., 2015; Yim et al.,
lower atmosphere, whereas the remaining three HPEs were        2019b) and weather and climate (Guo et al., 2016, 2018; Liu
driven by the combination (hybrid) of both aforementioned      et al., 2018, 2019, 2020).
systems (HY-HPE). A positive synergistic effect between the       Heat waves are generally defined as extended periods of
HPE and urban heat island (UHI; ∼ 1.1 ◦ C increase) was        elevated temperatures across the globe varying in frequency,
observed in TC-HPE and ST-HPE, whereas no discernible          intensity and duration. Previous studies have revealed the sig-
synergistic effect was found in HY-HPE. Total aerosol radia-   nificant impacts of heat waves on human health and mor-
tive forcing (TARF) caused a reduction in temperature (0.5–    tality (Matusick et al., 2018) and natural systems (Unal et
1.0 ◦ C) in TC-HPE and ST-HPE but an increase (0.5 ◦ C) in     al., 2013). More seriously, heat wave events are likely to oc-
HY-HPE.                                                        cur more frequently in future years as a consequence of cli-
                                                               mate change (Murari and Ghosh, 2019; Silva et al., 2016;
                                                               Wang et al., 2018). Despite their large spatial heterogeneity,
                                                               air pollution and heat waves have been shown to share sev-
                                                               eral common underlying meteorological drivers (Founda and

Published by Copernicus Publications on behalf of the European Geosciences Union.
13444                                                         I. C. Nduka et al.: Characteristics of HPE over the PRD region

Santamouris, 2017; Papanastasiou et al., 2014; Zhang et al.,       Yu et al., 2014). Mirzaei and Haghighat (2010) identified
2017). Although great advances have been made in the study         the ways urbanization modified the surface cover, climate
of either air pollution or heat waves, few studies have com-       and energy processes, including the conversion of more sur-
prehensively investigated hot-and-polluted episodes (HPEs),        faces into urban impervious surfaces; alteration of the local
in which extreme temperature and air pollution occur simul-        winds; humidity, temperature and precipitation patterns; and
taneously, causing an even more serious impact on human            changes in demarcation in turbulent energy fluxes within the
health due to their synergic effect (Pinheiro et al., 2014; Qian   surface and boundary layer. Furthermore, PRD is susceptible
et al., 2010; Scortichini et al., 2018). Before this effect can    to events associated with the monsoon and tropical cyclone
be comprehensively assessed, fully understanding the driv-         activities that may cause HPEs (Fan et al., 2011; H. Li et al.,
ing mechanisms underlying the formation and remediation            2018), making the PRD region an ideal location for assessing
of HPEs is imperative.                                             HPEs.
   The processes responsible for HPE formation and inten-             This study identified all the HPEs that occurred during
sity vary case by case (Fan et al., 2011; Katsouyanni et           2009–2011 and analyzed their associated thermodynamic
al., 1993; Ordóñez et al., 2010; Yim, 2020). For instance,         and circulation characteristics. Representative episodes were
Yim (2020) analyzed the atmospheric conditions in 3D dur-          examined for a possible synergistic relationship between the
ing these events and found that HPEs were mostly associ-           urban/vegetated land covers and the HPEs within the PRD
ated with a reduction in both vertical and horizontal wind         region (see Sect. S1 and Fig. S2 in the Supplement for de-
velocities. By contrast, Fan et al. (2011) illustrated that ap-    tails on land cover characteristics and delineation of urban
proaching tropical cyclones, which may cause subsidence,           and vegetated surfaces). This is expected to contribute to ad-
weak vertical diffusion and poor horizontal transport, were        vancing knowledge regarding the factors responsible for the
the mechanism responsible for the HPEs. To obtain a com-           evolution and sustenance of HPEs as well as the relationship
plete picture of all possible mechanisms of HPEs, a multi-         between HPEs and surface characteristics.
episodic study is therefore warranted.
   The surface energy balance, which modifies and demar-
cates turbulent energy fluxes, has been well illustrated to in-    2     Materials and methods
fluence heat waves (Founda and Santamouris, 2017; Li et
                                                                   2.1    Observations
al., 2015; Li and Bou-Zeid, 2013; Miralles et al., 2014).
For instance, Miralles et al. (2014) found that soil desicca-      This study used meteorological and air quality measure-
tion led to the modification of turbulent heat fluxes through      ments for model validation and HPE identification. Hourly
the changes of latent and sensible heat fluxes. Li and Bou-        air temperature at 2 m above ground (T2 ) for the study
Zeid (2013) and Li et al. (2015) demonstrated the effect           was obtained from Hong Kong Observatory (HKO). Hourly
of built-up and vegetated surfaces on the demarcation and          mean concentration of coarse particulate matter (PM10 ) and
modification of turbulent energy. However, the interaction         ozone (O3 ) concentrations was obtained from the Envi-
between surface characteristics and atmospheric conditions         ronmental Protection Department (EPD; https://cd.epic.epd.
during HPEs, which may exhibit synergies, has yet to be            gov.hk/EPICDI/air/station/?lang=en, last access: 14 Septem-
completely understood. The role of surface characteristics in      ber 2019). Hourly data were used for model validation,
HPE formation and development merits further investigation.        whereas daily maximum and mean values were calculated
   Studies are limited in China and few and far between in the     based on the hourly data for HPE identification.
Pearl River Delta (PRD) region. Previous HPE-related stud-
ies in China have been focused mostly on summertime O3             2.2    HPE selection
mechanisms and characteristics (Gong and Liao, 2019; Lam
et al., 2005; N. Li et al., 2018; Shu et al., 2020), while oth-    The concept of hot polluted episodes that refer to an episode
ers have focused on atmospheric drivers for, and interactions      with coincident high temperature and air pollution level has
between, air pollution and mortality. However, other studies       been investigated previously (Chan et al., 2012; Katsouyanni
analyzed the atmospheric boundary layer characteristics over       et al., 1993; Ordóñez et al., 2010; Yim, 2020); however, most
PRD using measurements and numerical models to identify            of the studies have been focused on their compounding im-
boundary layer conditions that could result in HPEs (Fan et        pact on health (Chan et al., 2012) or the impact of the excess
al., 2008, 2011; Yim, 2020). Thus far, there has been limited      temperature on air pollution levels (Ordóñez et al., 2010).
research on HPE mechanisms in China, particularly in the           Only few studies (Fan et al., 2011; Yim, 2020) have con-
PRD region, which has been rapidly and substantially urban-        sidered the mechanisms responsible for their co-occurrence.
ized in recent years (Li et al., 2016). The urbanization has       While Yim (2020) focused on high temperature and PM2.5
a significant impact on the regional climate and air quality       pollution in Hong Kong, this study focused on high temper-
through modification of the ecosystem, land surface, atmo-         ature and high PM10 and O3 in the PRD region. Similar to
spheric and energy processes (Mirzaei and Haghighat, 2010;         Yim (2020), this study identified a HPE based on daily maxi-
Y. Wang et al., 2019, 2020; Xie et al., 2016; Yim et al., 2019c;   mum temperature and daily mean of PM10 and O3 . PM10 was

Atmos. Chem. Phys., 21, 13443–13454, 2021                                          https://doi.org/10.5194/acp-21-13443-2021
I. C. Nduka et al.: Characteristics of HPE over the PRD region 13445
used in this study because of the lack of PM2.5 data in the (WRF-Chem) version 3.7.1 (Grell et al., 2005), which is a
study period, which was June to October in 2009–2011. This nonhydrostatic, mesoscale numerical model coupling both
study period was selected because these months represent a meteorology and chemistry. This model downscaled the me-
period in a year with the highest daily maximum tempera- teorology and air quality in three domains at a downscal-
ture, which when combined with days with poor air quality, ing ratio of 3 (Fig. S1a): domain 1 (D1; 27 km) covering
forms a HPE. the whole of China, domain 2 (D2; 9 km) covering south-
The HPE identification took into account the methods for ern China and domain 3 (D3; 3 km) covering the PRD
the traditional heat wave definition (occurrence for an ex- region. The detailed model configuration is provided in
tended period and threshold) and a health impact study re- Sect. S1. The initial condition data used were provided by
quiring the use of a critical value (Chan et al., 2012; Y. Wang NCEP Final Analysis (https://rda.ucar.edu/datasets/ds083.
et al., 2019). Thresholds for temperature, PM10 and O3 were 2/#metadata/detailed.html?_do=y, last access: 14 Septem-
set as the mean of 50th percentiles of the variables of all sta- ber 2019) with a 1◦ × 1◦ resolution, while the boundary con-
tions, i.e., 31.3 ◦ C, 31 and 24 µg/m3 , respectively. The thresh- dition was updated every 6 h from FNL data. The emissions
olds represented the middle value of their distributions with- data for Hong Kong were provided by the Hong Kong Envi-
out the interference of outliers in the distribution. Hence, a ronmental Protection Department (HKEPD), and the emis-
HPE was identified if the following conditions are fulfilled sions within PRD except Hong Kong were provided by
simultaneously: Zheng et al. (2009). The emissions outside the PRD region
were based on the INTEX-B 2006 regional emission inven-
1. The daily maximum temperature of Hong Kong Ob-
tory (Zhang et al., 2009). Biogenic emissions were based on
servatory (HKO) station (22◦ 180 000 N, 114◦ 100 200 E) ex-
Guenther et al. (2006), and shipping emissions were based
ceeds the temperature threshold for 3 consecutive days.
on Streets et al. (2003).
2. Daily means of PM10 and O3 exceed their thresholds for We performed a series of WRF-Chem simulations for each
3 consecutive days. HPE. The performance of the model was evaluated against
Daily maximum air temperature data obtained from the HKO observations, which was detailed in Sect. S2.2. For each
station were used for the HPE identification for three reasons. HPE, two sets of WRF-Chem simulations were conducted
First, the temperature difference among urban stations was with a 2 d spin-up period. Two additional days were included
marginal such that one urban station should be fine to rep- before and after the HPEs in each simulation run. This setting
resent the overall temperature of urban areas in Hong Kong. was used to identify and calculate variations in the variables
Second, the HKO station is in the downtown area of Hong before, during and after HPEs. The first set of simulations
Kong and thus serves as a representative urban station in turned on the aerosol–radiation feedback option (CTRL),
Hong Kong. Third, the critical temperature was chosen for while the second turned off the option (NOFB). The differ-
the HPE identification because epidemiological studies have ence between the two sets of simulations was attributable to
reported the risk of health impact above a critical temperature the effect of aerosols on radiation fluxes during a HPE. The
(28.4 ◦ C) which is lower than our temperature criteria, mean- model results for all the CTRL episodic simulations were
ing that the health impact during our identified HPEs should separated into groups using k-means clustering, and a rep-
be expected to be more adverse. While population is concen- resentative of each group was characterized based on the
trated in urban areas, using the HKO station was considered mechanisms responsible for its formation. The mechanisms
adequate in this study. of thermodynamic and circulation patterns of HPEs and the
The daily mean data for O3 and PM10 used for HPE iden- synergistic relationship between HPEs and the urban heat is-
tification were obtained from 14 air quality stations within land (UHI) effect were then discussed in detail.
Hong Kong. These were operated by the Hong Kong En-
vironmental Protection Department during the study period. 2.4 HPE clustering
Hong Kong air quality stations were used as proxies to iden-
tify HPEs in the PRD region because there were insufficient Based on our identification method, eight HPEs were identi-
data for the stations in the region during the study period. fied (Table 1). To enhance our understanding of atmospheric
The PRD regional air quality monitoring network’s annual conditions in each HPE, cluster analysis was performed of
and quarterly report between 2013 and 2018 showed that air meteorological variables (Stefanon et al., 2012; Tan et al.,
quality in Hong Kong was always better than or similar to the 2019) such as T2 , sea level pressure (SLP), specific humid-
other stations in the region (Pearl River Delta Regional Air ity at 2 m, wind components (u, v) at 10 m, incoming so-
Quality Monitoring Report, 2021). lar radiation at the surface and geopotential height (GPH)
at 500 hPa, which could group these variables from differ-
2.3 Model description and setup ent times into clusters having the same meteorological con-
ditions. A modified k-means clustering algorithm (Hartigan
This study employed the Weather Research and Forecast- and Wong, 1979) function in NCAR command language
ing model (Skamarock and Klemp, 2008) with Chemistry (NCL) with its center set at random and iterations set at
https://doi.org/10.5194/acp-21-13443-2021 Atmos. Chem. Phys., 21, 13443–13454, 202113446 I. C. Nduka et al.: Characteristics of HPE over the PRD region
Table 1. HPEs for the study period. Eight HPEs were identified and ies that have reported a strong association between high-
classified into three HPE groups: stagnant (ST), tropical cyclone pressure systems and air stagnation. However, when Frey-
(TC) and hybrid (HY). chet et al. (2017) assessed the dynamical processes for heat
wave formation over eastern China, they found that a low-
HPE Year Start End No. of Group pressure system along with northerly flow within the region
Month Day Month Day days often led to heat convergence and an extreme high tempera-
1 2009 8 1 8 3 3 TC ture episode. The ST-HPErep was observed to have a region-
2 8 30 9 10 12 ST wide slow-moving weather condition characterized by a wide
3 9 19 9 21 3 HY low-pressure system that covered most of East Asia for a few
4 9 23 9 26 4 HY days.
5 2010 8 4 8 7 4 ST The third group, HY-HPE, has a unique profile that was
6 8 29 9 1 4 TC
7 2011 8 26 8 30 5 TC
defined by Karremann et al. (2016). This group consisted
8 9 7 9 10 4 HY of more than one dominant synoptic condition during an
episode. A representative HY-HPE (HY-HPErep ), occurring
from 7 to 10 September 2011, was compared with corre-
sponding HKO charts (see Fig. S6). The result confirmed the
1 000 000 was applied for all the aforementioned meteoro-
co-occurrence of more than one large-scale weather system
logical variables.
during the HPE. The result of their characterization demon-
strated that different pressure centers, synoptic conditions or
3 Results and discussion their combination can be juxtaposed during a weather event
and that their gradient will determine the weather condition
3.1 HPE identification and classification of a region.
Due to the different durations of HPEs, mean diurnal varia- 3.2 HPE characterization
tions of the variables for the study domain during the three
periods (before, during and after) from the model results This section mainly analyzes the formation mechanism for
were analyzed. The dissimilarity was optimized at three clus- each HPE group. Due to the similarities of the members in
ters showing the number of groups that the HPEs could be each group, we discuss the air quality, energy and circulation
grouped into. The results of the cluster analysis indicate characteristics of one representative HPE from each group.
that the HPEs were classified based on their formation and
characteristics into tropical cyclone (TC-HPE), stagnant (ST- 3.2.1 TC-HPE
HPE) and hybrid (HY-HPE), and they are discussed below.
The weather conditions of the TC-HPE were characterized Figure 1a depicts the time series for domain-averaged hourly
by lower SLP and GPH but higher T2 and specific humidity. T2 during the TC-HPE representative HPE. During the TC-
The TC-HPE typically occurred when a tropical cyclone was HPErep , T2 increased on day 3 [onset (∼ 30.2 ◦ C)], reached
approaching the PRD region. A representative episode (TC- a peak (∼ 32.7 ◦ C) on day 5 and decreased on day 7
HPErep ), occurring from 29 August to 1 September 2010, (∼ 30.8 ◦ C). Figure 1g shows the height–time cross-section
was selected to further explain the weather conditions, along of vertical velocity. Positive vertical velocity means down-
with weather charts provided by the Hong Kong Observatory ward motion, whereas negative vertical velocity means up-
(HKO; see Fig. S4). In this episode, the tropical storm Li- ward motion. In the lower atmosphere, the positive and even
onrock passed through the PRD region. Its passage caused relatively small negative vertical velocity values during the
stagnation and expansion of the high-pressure system in the TC-HPErep indicate a weak subsidence of air masses result-
lower atmosphere over the north of the region. This led to ing from an approaching tropical cyclone (Luo et al., 2018;
an increase in T2 over the region. Midday T2 in Hong Kong Yim et al., 2019a). As shown in Fig. 1a, the cloud fraction
rose from 32 ◦ C on 29 August to 34 ◦ C on 31 August, which was maintained at approximately 0.40 at the onset of the
broadly corroborated our previous studies (Yim et al., 2019b) TC-HPErep and reduced to 0.20 at 08:00 on day 5. The re-
that showed that tropical cyclones within 1100 km of the re- duction in cloud fraction was due to weak convection. These
gion can cause HPEs. clear-sky conditions caused a significant increase in incom-
The second group, ST-HPE, was found to be charac- ing shortwave radiation, leading to a remarkable increase in
terized by higher temperature and lower specific humidity T2 due to greater direct exposure to solar radiation at the sur-
in the PRD region, as demonstrated by the representative face. Figure 1d shows that the outgoing longwave radiation
HPE (ST-HPErep ) occurring from 4 to 7 August 2010 (see (OLR) also increased up to 250 W/m2 at 08:00 on day 5. The
Fig. S5). This group represents a slow-moving weather sys- situation changed by the end of day 6 due to the increased
tem formed by a low-pressure system covering most of China upward motion, as indicated by the large negative vertical
and the Philippine Sea. This is in contrast to previous stud- velocity shown in Fig. 1g. A greater amount of convective ac-
Atmos. Chem. Phys., 21, 13443–13454, 2021 https://doi.org/10.5194/acp-21-13443-2021I. C. Nduka et al.: Characteristics of HPE over the PRD region 13447 Figure 1. The model (CTRL) domain-averaged results for air temperature at 2 m (T2 ; magenta), cloud fraction (CF; cyan) and incoming shortwave radiation (blue) at ground level for (a) TC-HPE, (b) ST-HPE and (c) HY-HPE and PM10 (magenta), O3 (cyan) and outgoing longwave radiation (OLR) at the top of the atmosphere (blue) for (d) TC-HPErep , (e) ST-HPErep and (f) HY-HPErep . Time series of vertical velocity (color shading) for (g) TC-HPErep , (h) ST-HPErep and (i) HY-HPErep . Positive vertical velocity means downward motion, whereas negative vertical velocity means upward motion. Black boxes represent the period of HPEs. Days 1 and 2 were before the HPEs, days 3–6 were during the HPEs and days 7 and 8 were after the HPEs. tivity led to an increase in cloud fraction (up to 0.30) and thus increase in insolation due to lower cloud fraction and ac- a reduction in SW radiation. Consequently, T2 decreased, sig- cumulation of pollutants, some of which are precursors of naling the end of the HPE. O3 formation, led to the increase in midday O3 concentra- During TC-HPErep , the weak vertical motions led to an tion from approximately 60 µg/m3 on day 3 to approximately accumulation of PM10 , as shown in Fig. 1d. The PM10 con- 90 µg/m3 on day 6. The result also demonstrated that the di- centration rose from approximately 10 µg/m3 on day 3 to urnal variation in O3 concentration was maintained but the > 24 µg/m3 on day 5. This change can be attributed to the mean concentration increased significantly as the TC-HPErep northerly wind during the episode, as shown in Fig. S7a. En- got hotter and more polluted before falling at the end of the hanced northerly wind has been found to significantly en- episode. hance transboundary air pollution in the region (Hou et al., 2019; Luo et al., 2018; Tong et al., 2018b; Yim et al., 2019a). During the TC-HPErep , O3 accumulation also occurred. The https://doi.org/10.5194/acp-21-13443-2021 Atmos. Chem. Phys., 21, 13443–13454, 2021
13448                                                          I. C. Nduka et al.: Characteristics of HPE over the PRD region

3.2.2   ST-HPE                                                      by weak downward motion (except on day 5). The increased
                                                                    horizontal wind speed from day 4 contributed to the temper-
Figure 1b depicts the evolution of the ST-HPErep . T2 in-           ature regime of the HY-HPErep by offsetting the heat buildup
creased on day 3 [onset (∼ 32.7 ◦ C)], reached a peak               due to the weak vertical motion. This led to marginal varia-
(∼ 33.3 ◦ C) on day 4 and then decreased until the end of           tions in the diurnal temperature between pre-, mid- and post-
day 6 (∼ 32.1 ◦ C). The ST-HPErep was distinguished by a            HPE days.
5 m/s wind speed in the lower atmosphere from day 1 to 4,              The changes in air quality during this episode were influ-
as shown in Fig. S7b. The wind speed reduced to approx-             enced primarily by the horizontal wind direction and speed.
imately 2 m/s on day 3, which led to an intense accumula-           This is exemplified by the effect of the prevailing wind speed
tion of heat and a 1.7 ◦ C increase in T2 . The subsequent in-      and direction on the relatively lower concentration of PM10
crease in wind speed after day 4 (> 5 m/s) coincided with           (about 15 µg/m3 at its peak; see Fig. S7i and f). The prevail-
the decrease in T2 until the end of day 6, which marked the         ing easterly wind suggests a marginal effect of transboundary
end of this episode. Vertical movement during this event, as        air pollution in HY-HPE; the increase in air pollutant level
shown in Fig. 1h, ranged from −0.1 to 0.2 m/s. The strong           was thus due to local emissions. The subsequent increase in
subsidence observed on days 2 and 3 in the middle and               wind speed resulted in a dispersion and reduction in the PM10
lower atmosphere contributed to the stable atmosphere be-           concentration. However, as the wind direction switched to
cause the cloud fraction (shown in Fig. 1b) was lower (∼ 0.20       the north (day 6), PM10 concentration began to rise due to
on day 2 and ≤ 0.1 on day 3). On day 4, the convective mo-          increases in transboundary air pollution. Changes in O3 con-
tion (−0.1 m/s) contributed to a steady increase in cloud frac-     centration followed the same pattern due to the availability
tion to 0.5. Consequently, the increase in cloud cover cut off      of precursors and the influence of wind speed and direc-
insolation (down to approximately 850 W/m2 on day 4 and             tion. Consequently, HY-HPE was unable to accumulate heat,
approximately 680 W/m2 on day 5, as shown in Fig. 1b).              PM10 and O3 concentration despite the weak convection.
However, the cloud could retain most of the heat on day 4
as the OLR displayed in Fig. 1e decreased from 210 W/m2             3.3     Synergistic relationship
on day 3 to 165 W/m2 on day 4, while the T2 increased by
0.6 ◦ C. T2 reduced thereafter by 2.3 ◦ C due to the amount of      We examined the synergistic relationship between UHIs and
persistent high cloud, which blocked incoming shortwave ra-         HPEs during these episodes. This was achieved by scruti-
diation and cut off the source of heat. This episode persisted      nizing the daily midday height–time series of potential tem-
until the end of the ST-HPErep (day 6).                             peratures, which have been found to be a suitable variable
   The calm wind condition also contributed to the deterio-         for diagnosing differences in boundary layer characteristics
ration in air quality, as shown in Fig. 1e. The increase in the     because it provides insight into its vertical and thermal struc-
concentration of PM10 to 20 µg/m3 from days 4 to 6 was ac-          tures (Miralles et al., 2014; Ramamurthy et al., 2017). The
centuated by the change in wind direction to north/northeast,       effects of land cover on the evolution and sustenance of the
as shown in Fig. S7e. This result was consistent with a num-        HPE were analyzed by examining UHI intensities during
ber of findings (Hou et al., 2019; Luo et al., 2018; Tong et al.,   the HPEs. The UHI intensities were quantified as the differ-
2018a, b; Yim et al., 2019b) showing that a northerly wind is       ence between the average urban and rural grids (as shown
usually associated with air pollution in the region as a result     in Fig. S2). The rural grids are the average of all the vege-
of transboundary air pollution. The increase in O3 concen-          tated land use land cover categorizations shown in Fig. S2.
tration displayed in Fig. 1e is attributable to the increase in     Quantification of potential temperature and sensible and la-
precursors and the amount of incoming shortwave radiation           tent heat fluxes was also carried out using the same method.
available. The diurnal variation in the time series of O3 is        The effect of the air quality on the HPEs was also examined,
also indicative of this cumulative trend.                           largely through analyzing the effect of total aerosol radiative
                                                                    forcing (TARF).
3.2.3   HY-HPE
                                                                    3.3.1    TC-HPE
Compared with the other two groups, HY-HPE did not show
an obvious increase in daily T2 during the episode. As shown        Figure 2a shows the T2 difference between urban and vege-
in Fig. 1c, the HY-HPErep (days 3–6) had a mean daily max-          tated areas during TC-HPErep . The results indicate a remark-
imum T2 of approximately 30.0 ◦ C, with a variation of only         able 4.2 to 5.5 ◦ C difference in T2 between the two types of
±0.3 ◦ C. The HY-HPErep showed a relatively large change            land cover due to the UHI effect during the HPE, while the
in horizontal wind speed at the lower troposphere (Fig. S7c)        pre- and post-HPE UHI effect had a lower range of 2.2 to
from < 5 m/s on days 1 to 3 to a higher wind speed (≥ 8 m/s)        4.2 ◦ C, indicating the contribution of the HPE to the UHI
from days 4 to 8. Similar to the other two groups, Fig. 1i          effect. Figure 2d depicts the difference between the poten-
shows a weak subsidence in this episode due to weak verti-          tial temperature over urban and vegetated land covers in the
cal velocity (from −0.2 to 0.2 m/s), which was accompanied          PRD region at midday. The temporal distribution in poten-

Atmos. Chem. Phys., 21, 13443–13454, 2021                                            https://doi.org/10.5194/acp-21-13443-2021
I. C. Nduka et al.: Characteristics of HPE over the PRD region 13449
tial temperature shows an increasing trend in the lower at- periods which had a minimal difference in their cloud frac-
mosphere (≥ 1.8 ◦ C from days 4 to 6) and upward expansion tion during the episode, hence highlighting the importance
in height for warm air beyond 1.2 km (0.3 ◦ C on day 5). Per- of incoming solar radiation to the HPE. The sensible and la-
sistent daily heating from incoming solar radiation provided tent heat fluxes shown Fig. 2b indicate that the heat buildup
energy that precipitated a rise in temperature, thereby entrap- for this episode started before the onset of this HPE, as they
ping and accumulating heat during the TC-HPErep . For the continuously increased (decreased) for sensible (latent) heat.
TC-HPErep , the T2 difference ranged from 0.5 to > 1.5 ◦ C, However, the changes in the cloud fraction from day 4 and 5
showing that TC-HPE provided extra heat to the surface, led to the retention of the accumulated heat and subsequent
which enabled the urban areas to warm up to a greater ex- attenuation of temperature and sensible and latent heat dif-
tent than normal. This result indicates that the UHI effect ferences. The potential temperature difference also shows a
was enhanced during the TC-HPE. positive synergy during the ST-HPErep by maintaining a pos-
The effect of surface moisture availability, surface energy itive difference throughout the episode, even though it pro-
retention and transfer for both urban and vegetated surfaces gressively weakened over time. These results indicate that the
was investigated by analyzing latent and sensible heat fluxes UHI effect was accentuated during the ST-HPErep , leading to
(Fig. 2a). The largest absolute latent heat difference between a larger temperature difference between urban and vegetated
the two types of land cover was between 350 and 400 W/m2 . surfaces.
This illustrates the impact of the limited vegetation in the The results of the effect of TARF on T2 , SWin and CF for
city. This is buttressed by the 130–200 W/m2 difference, re- ST-HPE indicate that TARF caused marginal changes dur-
spectively in the amount of sensible heat for both types of ing the pre- and post-ST-HPE periods (Fig. 2h). Like the
land cover. Although both the latent and sensible heat fluxes TC-HPErep , the TARF effect led to a reduction in approxi-
shared similar incoming shortwave radiation, the continued mately 1.5 ◦ C when the PM10 reached a peak on days 4 and
increase in the temperature can be attributed to the contin- 5. The cloud fraction (Fig. 1b) also increased significantly
ued desiccation of the urban areas, leading to faster buildup during this period, thus contributing to the decrease in T2 .
of heat and increase in temperature, even as the cloud cover As explained in the TC-HPErep , the reduction in T2 could
continued to decrease until day 6, marking the end of the be mainly due to effect of aerosol–radiation interaction. The
episode. TARF effect on T2 by day 6 led to a 0.5 ◦ C increase; this was
TARF caused an initial increase in T2 but then a significant due to the slight increase of PM10 concentration (the total
reduction in T2 (> 1.0 ◦ C) on day 6 when the PM10 increased level was lower than 8 µg/m3 ) on that day that reduced the
to a peak. Figures 1d and 2g show that when PM10 was in- cloud fraction.
creased but below 10 µg/m3 , the TARF caused a reduction
in cloud fraction and thus an increase in T2 . The reduction 3.3.3 HY-HPE
in cloud fraction due to TARF may be due to the aerosol–
cloud interaction in which aerosols served as cloud conden- HP-HPErep did not show any significant difference in UHI
sation nuclei, and thus more cloud droplets were formed with intensity between the pre-, mid- and post-HPE periods. Fig-
a smaller radius, and the cloud fraction hence decreased (Liu ure 2c shows a similar magnitude (3.0–3.5 ◦ C) during pre-
et al., 2020). Nevertheless, when the PM10 level exceeded and post-HPE periods. The daily variation did not display
10 µg/m3 , the aerosol–radiation interaction (aerosol scatter- any obvious signs of heat retention in the atmosphere, in-
ing and absorption) may become dominant, causing a re- dicating that there was no heat accumulation during this
duction in the amount of solar radiation reaching the ground episode. The potential temperature shown in Fig. 1c indicates
level due to the blockage effect of aerosols and thus a tem- that heat generated from heating the surface by the incom-
perature reduction. ing solar radiation could not be entrained due to its increased
wind speed and weak vertical motions, thereby making it dif-
3.3.2 ST-HPE ficult to accumulate heat, an observed pre-requisite for HPE
and UHI synergistic effect. There was therefore no synergis-
Figure 2b shows the difference in T2 between the two land tic relationship between UHI and HPE during the HY-HPE.
covers in the ST-HPErep . The T2 in urban areas was higher by The effect of TARF on T2 and OLR in the HY-HPErep ,
a range of approximately 3.0–4.1 ◦ C during the ST-HPErep . as displayed in Fig. 2i, shows a variation of −0.5 to 0.5 ◦ C in
There was also approximately 0.2 to 1.0 ◦ C difference in T2 temperature across the pre-, mid-, and post-HPE periods. The
between the ST-HPErep period and its pre- and post-HPE pe- pre-HPE period shows marginal changes for CF, SWin and
riods. Figure 2e shows that heat accumulated at the onset T2 ; however, variations began to be apparent from day 5. For
of ST-HPErep began to decay during the episode. The heat instance, on the afternoon of day 5, the PM10 started to in-
accumulation led to a maximum difference of about 1.5 ◦ C crease and reached a peak early on day 6. The cloud fraction
on day 3, which was the first day of the ST-HPErep and increased in response to the increase in PM10 , as did SWin
the day with the highest incoming solar radiation and low- and then T2 . These changes became marginal late on day 6.
est cloud cover. This contrasts with the pre- and post-HPE Nevertheless, PM10 still maintained a relatively high level,
https://doi.org/10.5194/acp-21-13443-2021 Atmos. Chem. Phys., 21, 13443–13454, 202113450 I. C. Nduka et al.: Characteristics of HPE over the PRD region
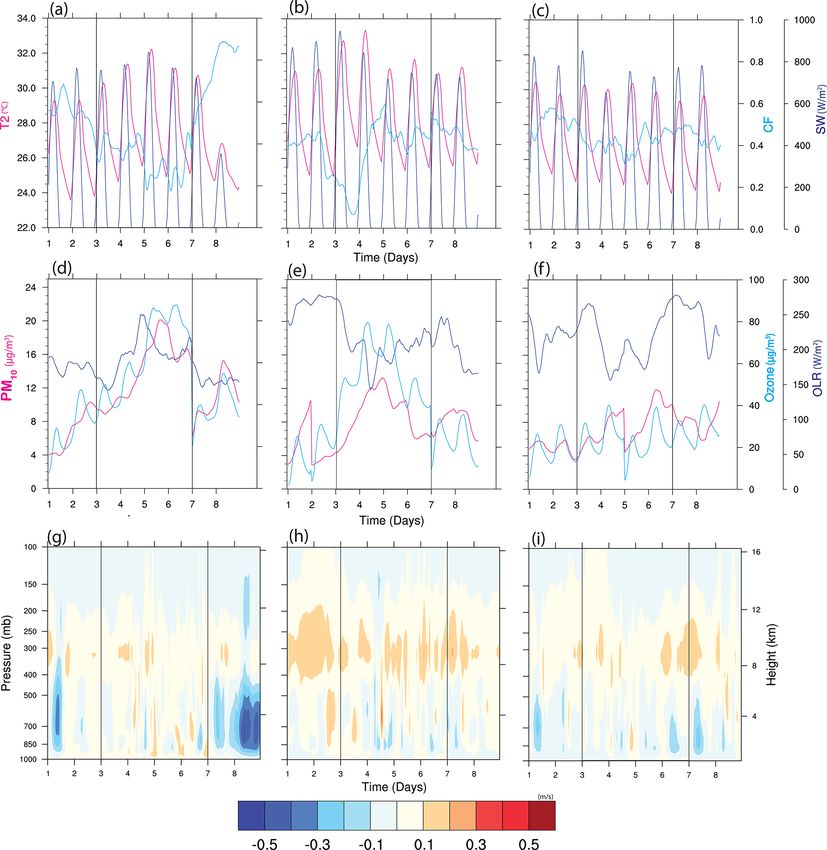
Figure 2. The model (CTRL) domain-averaged results showing (a–c) difference of T2 (T2(diff) ), sensible heat (SH; SH(diff) ), and latent heat
(LH; LH(diff) ) between urban and vegetated grids for TC-HPErep , ST-HPErep and HY-HPErep ; (d–f) vertical profile of potential temperature
difference θ (θ(diff) ) for TC-HPErep , ST-HPErep and HY-HPErep at midday for the PRD region; (g–i) the changes of T2 (1T2 ), CF (1CF)
and incoming shortwave radiation SW (1SW) at the surface induced by total aerosol radiative forcing for TC-HPErep , ST-HPErep and
HY-HPErep .
and the cloud fraction reduced once more, allowing more so- found to contribute significantly to the temperature variations
lar radiation to reach the ground, causing an increase in T2 . during the HPEs, leading to significant cooling effects on the
HPEs (0.5–1 ◦ C), except when upward vertical transport pre-
vailed, particularly during the daytime.
4 Conclusions This study provided further insight into the nature of HPEs
at both regional and local level by analyzing their modes of
In this study, eight HPEs during 2009–2011 were identi- formation and thermodynamic characteristics and by investi-
fied. We found that TC-HPE was influenced by incoming gating the contributions of land use and land cover (LULC)
solar radiation and subsidence, and ST-HPE was influenced changes to the nature of HPEs. These findings can aid policy-
by low wind speed and reduction in cloud cover, while HY- makers in redesigning and renewing our urban environments
HPE was influenced by weak vertical transport and increased to alleviate the UHI effect, global warming and air pollution.
wind speed. Consequently, TC-HPE and ST-HPE had a pos- Especially the impact of aerosol radiative forcing during the
itive synergetic relationship (∼ 1.1 ◦ C) between UHI and HPEs will improve our understanding of the mechanisms re-
HPE because their characteristic meteorological conditions sponsible for the co-occurrence of unusually high tempera-
(weak subsidence, low wind speeds and reduced cloud cover) ture and poor air quality in the PRD region, showing enor-
accentuated insolation, heat storage and heat entrainment, mous implications for regional climate and health. The next
while HY-HPE had no discernable relationship. TARF was phase of our study will focus on the regional-scale impli-
Atmos. Chem. Phys., 21, 13443–13454, 2021 https://doi.org/10.5194/acp-21-13443-2021I. C. Nduka et al.: Characteristics of HPE over the PRD region 13451
cations of the effect of HPEs on human health, the relative References
contribution of aerosol–radiation and aerosol–cloud interac-
tions and the combined effect of LULC and aerosols on our Chan, E. Y. Y., Goggins, W. B., Kim, J. J., and Griffiths, S.
climate. M.: A study of intracity variation of temperature-related mor-
tality and socioeconomic status among the Chinese popula-
tion in Hong Kong, J. Epidemiol. Commun. H., 66, 322–327,
https://doi.org/10.1136/jech.2008.085167, 2012.
Limitations of the study. This study was limited by access to more
Chen, X., Shao, S., Tian, Z., Xie, Z., and Yin, P.: Impacts of air
recent air quality emission data; hence the study was conducted for
pollution and its spatial spillover effect on public health based
the 2009–2011 period. The use of data from only the Hong Kong
on China’s big data sample, J. Clean. Prod., 142, 915–925,
area as a proxy for the region was because of the lack of air quality
https://doi.org/10.1016/j.jclepro.2016.02.119, 2017.
data from the rest of the study area. Also, as mentioned in Sect. 2.2,
Climatological Information Services: Climatological Database,
PM10 was used in this study because of the inadequacy of PM2.5
available at: https://www.hko.gov.hk/en/cis/climat.htm, last ac-
data in the study period.
cess: 21 May 2021.
Environmental Protection Interactive Centre: Inquire and Download
Air Quality Monitoring Data, available at: https://cd.epic.epd.
Data availability. The in situ meteorology data are provided by gov.hk/EPICDI/air/station/?lang=en, last access: 21 May 2021.
the Hong Kong Observatory at http://www.hko.gov.hk/cis/climat_ Fan, S., Wang, B., Tesche, M., Engelmann, R., Althausen,
e.htm (Climatological Information Services, 2021), while the in A., Liu, J., Zhu, W., Fan, Q., Li, M., Ta, N., Song,
situ air quality data are provided by the Hong Kong Environmen- L., and Leong, K.: Meteorological conditions and struc-
tal Protection Department at https://cd.epic.epd.gov.hk/EPICDI/ tures of atmospheric boundary layer in October 2004 over
air/station/?lang=en (Environmental Protection Interactive Centre, Pearl River Delta area, Atmos. Environ., 42, 6174–6186,
2021). https://doi.org/10.1016/j.atmosenv.2008.01.067, 2008.
Fan, S. J., Fan, Q., Yu, W., Luo, X. Y., Wang, B. M., Song, L. L.,
and Leong, K. L.: Atmospheric boundary layer characteristics
Supplement. The supplement related to this article is available on- over the Pearl River Delta, China, during the summer of 2006:
line at: https://doi.org/10.5194/acp-21-13443-2021-supplement. measurement and model results, Atmos. Chem. Phys., 11, 6297–
6310, https://doi.org/10.5194/acp-11-6297-2011, 2011.
Founda, D. and Santamouris, M.: Synergies between Urban
Author contributions. SHLY and ICN designed the study. ICN did Heat Island and Heat Waves in Athens (Greece), during
all calculations with support from SHLY and CYT. ICN wrote the an extremely hot summer (2012), Sci. Rep., 7, 10973,
paper with support and editing from SHLY, JG and CYT. https://doi.org/10.1038/s41598-017-11407-6, 2017.
Freychet, N., Tett, S., Wang, J., and Hegerl, G.: Summer heat waves
over Eastern China: dynamical processes and trend attribution,
Competing interests. The authors declare that they have no conflict Environ. Res. Lett., 12, 024015, https://doi.org/10.1088/1748-
of interest. 9326/aa5ba3, 2017.
Gong, C. and Liao, H.: A typical weather pattern for ozone pollution
events in North China, Atmos. Chem. Phys., 19, 13725–13740,
https://doi.org/10.5194/acp-19-13725-2019, 2019.
Disclaimer. The views expressed in this paper are those of the au-
Grell, G. A., Peckham, S. E., Schmitz, R., McKeen, S. A., Frost, G.,
thors and do not necessarily reflect the views or policies of the Hong
Skamarock, W. C., and Eder, B.: Fully coupled “online” chem-
Kong government or any of its agencies or parastatals.
istry within the WRF model, Atmos. Environ., 39, 6957–6975,
https://doi.org/10.1016/j.atmosenv.2005.04.027, 2005.
Gu, Y., Wong, T. W., Law, C. K., Dong, G. H., Ho, K. F.,
Acknowledgements. This work is supported by the Early Career Yang, Y., and Yim, S. H. L.: Impacts of sectoral emissions in
Scheme of Research Grants Council of Hong Kong (grant no. China and the implications: air quality, public health, crop pro-
CUHK24301415). The in situ meteorology and air quality obser- duction, and economic costs, Environ. Res. Lett., 13, 084008,
vations are provided by the Hong Kong Observatory (http://www. https://doi.org/10.1088/1748-9326/aad138, 2018.
hko.gov.hk/cis/climat_e.htm) and Hong Kong Environmental Pro- Guenther, A., Karl, T., Harley, P., Wiedinmyer, C., Palmer, P.
tection Department (https://cd.epic.epd.gov.hk/EPICDI/air/station/ I., and Geron, C.: Estimates of global terrestrial isoprene
?lang=en). emissions using MEGAN (Model of Emissions of Gases and
Aerosols from Nature), Atmos. Chem. Phys., 6, 3181–3210,
https://doi.org/10.5194/acp-6-3181-2006, 2006.
Financial support. This research has been supported by the Early Guo, J., Deng, M., Lee, S. S., Wang, F., Li, Z., Zhai, P., Liu, H.,
Career Scheme of Research Grants Council of Hong Kong (grant Lv, W., Yao, W., and Li, X.: Delaying precipitation and light-
no. CUHK24301415). ning by air pollution over the Pearl River Delta. Part I: Ob-
servational analyses, J. Geophys. Res.-Atmos., 121, 6472–6488,
https://doi.org/10.1002/2015JD023257, 2016.
Review statement. This paper was edited by Zhanqing Li and re- Guo, J., Liu, H., Li, Z., Rosenfeld, D., Jiang, M., Xu, W., Jiang,
viewed by three anonymous referees. J. H., He, J., Chen, D., Min, M., and Zhai, P.: Aerosol-induced
https://doi.org/10.5194/acp-21-13443-2021 Atmos. Chem. Phys., 21, 13443–13454, 202113452 I. C. Nduka et al.: Characteristics of HPE over the PRD region changes in the vertical structure of precipitation: a perspective Quality in the Pearl River Delta Region, Geophys. Res. Lett., 45, of TRMM precipitation radar, Atmos. Chem. Phys., 18, 13329– 4410–4418, https://doi.org/10.1029/2018GL077517, 2018. 13343, https://doi.org/10.5194/acp-18-13329-2018, 2018. Liu, Z., Ming, Y., Wang, L., Bollasina, M., Luo, M., Lau, N.-C., Hartigan, J. A. and Wong, M. A.: Algorithm AS 136: A K-Means and Yim, S. H.-L.: A Model Investigation of Aerosol-Induced Clustering Algorithm, J. R. Stat. Soc. C-Appl., 28, 100–108, Changes in the East Asian Winter Monsoon, Geophys. Res. https://doi.org/10.2307/2346830, 1979. Lett., 46, 10186–10195, https://doi.org/10.1029/2019GL084228, Hou, X., Chan, C. K., Dong, G. H., and Yim, S. H. L.: Impacts of 2019. transboundary air pollution and local emissions on PM2.5 pol- Liu, Z., Ming, Y., Zhao, C., Lau, N. C., Guo, J., Bollasina, M., lution in the Pearl River Delta region of China and the pub- and Yim, S. H. L.: Contribution of local and remote anthro- lic health, and the policy implications, Environ. Res. Lett., 14, pogenic aerosols to a record-breaking torrential rainfall event in 034005, https://doi.org/10.1088/1748-9326/aaf493, 2019. Guangdong Province, China, Atmos. Chem. Phys., 20, 223–241, Karremann, M. K., Liberato, M. L. R., Ordóñez, P., and Pinto, J. G.: https://doi.org/10.5194/acp-20-223-2020, 2020. Characterization of synoptic conditions and cyclones associated Lovett, G. M., Tear, T. H., Evers, D. C., Findlay, S. E. G., Cosby, with top ranking potential wind loss events over Iberia, Atmos. B. J., Dunscomb, J. K., Driscoll, C. T., and Weathers, K. C.: Ef- Sci. Lett., 17, 354–361, https://doi.org/10.1002/asl.665, 2016. fects of air pollution on ecosystems and biological diversity in Katsouyanni, D. K., Pantazopoulou, A., Touloumi, G., Tse- the eastern United States, Ann. N.Y. Acad. Sci., 1162, 99–135, lepidaki, I., Moustris, K., Asimakopoulos, D., Poulopoulou, https://doi.org/10.1111/j.1749-6632.2009.04153.x, 2009. G., and Trichopoulos, D.: Evidence for Interaction be- Luo, M., Hou, X., Gu, Y., Lau, N.-C., and Yim, S. H.- tween Air Pollution and High Temperature in the Causa- L.: Trans-boundary air pollution in a city under various tion of Excess Mortality, Arch. Environ. Health, 48, 235–242, atmospheric conditions, Sci. Total Environ., 618, 132–141, https://doi.org/10.1080/00039896.1993.9940365, 1993. https://doi.org/10.1016/j.scitotenv.2017.11.001, 2018. Khafaie, M. A., Yajnik, C. S., Salvi, S. S., and Ojha, A.: Critical Matusick, G., Ruthrof, K. X., Kala, J., Brouwers, N. C., Bres- review of air pollution health effects with special concern on res- hears, D. D., and Hardy, G. E. S. J.: Chronic historical drought piratory health, J. Air Poll. Health, 1, 123–136, 2016. legacy exacerbates tree mortality and crown dieback during acute Lam, K. S., Wang, T. J., Wu, C. L., and Li, Y. S.: Study on an ozone heatwave-compounded drought, Environ. Res. Lett., 13, 095002, episode in hot season in Hong Kong and transboundary air pol- https://doi.org/10.1088/1748-9326/aad8cb, 2018. lution over Pearl River Delta region of China, Atmos. Environ., Miralles, D. G., Teuling, A. J., van Heerwaarden, C. C., and Vilà- 39, 1967–1977, https://doi.org/10.1016/j.atmosenv.2004.11.023, Guerau de Arellano, J.: Mega-heatwave temperatures due to 2005. combined soil desiccation and atmospheric heat accumulation, Li, D. and Bou-Zeid, E.: Synergistic Interactions between Urban Nat. Geosci., 7, 345–349, https://doi.org/10.1038/ngeo2141, Heat Islands and Heat Waves: The Impact in Cities Is Larger than 2014. the Sum of Its Parts, J. Appl. Meteorol. Clim., 52, 2051–2064, Mirzaei, P. A. and Haghighat, F.: Approaches to study Urban Heat https://doi.org/10.1175/JAMC-D-13-02.1, 2013. Island – Abilities and limitations, Build. Environ., 45, 2192– Li, D., Sun, T., Liu, M., Yang, L., Wang, L., and Gao, Z.: 2201, https://doi.org/10.1016/j.buildenv.2010.04.001, 2010. Contrasting responses of urban and rural surface energy bud- Murari, K. K. and Ghosh, S.: Future Heat Wave Projections and gets to heat waves explain synergies between urban heat Impacts, in: Climate Change Signals and Response: A Strate- islands and heat waves, Environ. Res. Lett., 10, 054009, gic Knowledge Compendium for India, edited by: Venkatara- https://doi.org/10.1088/1748-9326/10/5/054009, 2015. man, C., Mishra, T., Ghosh, S., and Karmakar, S., Springer Sin- Li, H., Wang, B., Fang, X., Zhu, W., Fan, Q., Liao, Z., Liu, J., gapore, Singapore, 91–107, https://doi.org/10.1007/978-981-13- Zhang, A., and Fan, S.: Combined effect of boundary layer recir- 0280-0_6, 2019. culation factor and stable energy on local air quality in the Pearl Nowak, D. J., Jovan, S., Branquinho, C., Augusto, S., Ribeiro, M. River Delta over southern China, J. Air Waste Manage., 68, 685– C., and Kretsch, C. E.: Biodiversity, air quality and human health, 699, https://doi.org/10.1080/10962247.2018.1439125, 2018. in: Connecting global priorities: biodiversity and human health: Li, M., Song, Y., Mao, Z., Liu, M., and Huang, X.: Impacts of ther- a state of knowledge review, 63–74, Chap. 4, World Health Or- mal circulations induced by urbanization on ozone formation in ganization, Geneva, Switzerland, 2015. the Pearl River Delta region, China, Atmos. Environ., 127, 382– Ordóñez, C., Elguindi, N., Stein, O., Huijnen, V., Flemming, J., In- 392, https://doi.org/10.1016/j.atmosenv.2015.10.075, 2016. ness, A., Flentje, H., Katragkou, E., Moinat, P., Peuch, V.-H., Li, N., He, Q., Greenberg, J., Guenther, A., Li, J., Cao, J., Wang, Segers, A., Thouret, V., Athier, G., van Weele, M., Zerefos, C. J., Liao, H., Wang, Q., and Zhang, Q.: Impacts of biogenic and S., Cammas, J.-P., and Schultz, M. G.: Global model simulations anthropogenic emissions on summertime ozone formation in the of air pollution during the 2003 European heat wave, Atmos. Guanzhong Basin, China, Atmos. Chem. Phys., 18, 7489–7507, Chem. Phys., 10, 789–815, https://doi.org/10.5194/acp-10-789- https://doi.org/10.5194/acp-18-7489-2018, 2018. 2010, 2010. Liu, M., Huang, Y., Ma, Z., Jin, Z., Liu, X., Wang, H., Panastasiou, D. K., Melas, D., and Kambezidis, H. D.: Heat waves Liu, Y., Wang, J., Jantunen, M., Bi, J., and Kinney, P. characteristics and their relation to air quality in Athens, Global L.: Spatial and temporal trends in the mortality burden of Nest J., 16, 919–928, https://doi.org/10.30955/gnj.001530, 2014. air pollution in China: 2004–2012, Environ. Int., 98, 75–81, Pearl River Delta Regional Air Quality Monitoring Re- https://doi.org/10.1016/j.envint.2016.10.003, 2017. port/Environmental Protection Department: available Liu, Z., Yim, S. H. L., Wang, C., and Lau, N. C.: The Impact of the at: https://www.epd.gov.hk/epd/english/resources_pub/ Aerosol Direct Radiative Forcing on Deep Convection and Air publications/m_report.html, last access: 21 May 2021. Atmos. Chem. Phys., 21, 13443–13454, 2021 https://doi.org/10.5194/acp-21-13443-2021
I. C. Nduka et al.: Characteristics of HPE over the PRD region                                                                         13453

Pinheiro, S. de L. L. de A., Saldiva, P. H. N., Schwartz, J., and            of seasonal and vertical atmospheric conditions on air quality
   Zanobetti, A.: Isolated and synergistic effects of PM10 and av-           over the Pearl River Delta region, Atmos. Environ., 180, 69–78,
   erage temperature on cardiovascular and respiratory mortality,            https://doi.org/10.1016/j.atmosenv.2018.02.039, 2018a.
   Rev. Saúde Pública, 48, 881–888, https://doi.org/10.1590/S0034-         Tong, C. H. M., Yim, S. H. L., Rothenberg, D., Wang, C., Lin,
   8910.2014048005218, 2014.                                                 C.-Y., Chen, Y. D., and Lau, N. C.: Projecting the impacts
Qian, Z., He, Q., Lin, H.-M., Kong, L., Zhou, D., Liang, S., Zhu,            of atmospheric conditions under climate change on air quality
   Z., Liao, D., Liu, W., Bentley, C. M., Dan, J., Wang, B., Yang,           over the Pearl River Delta region, Atmos. Environ., 193, 79–87,
   N., Xu, S., Gong, J., Wei, H., Sun, H., Qin, Z., and HEI Health           https://doi.org/10.1016/j.atmosenv.2018.08.053, 2018b.
   Review Committee: Part 2. Association of daily mortality with           Unal, Y. S., Tan, E., and Mentes, S. S.: Summer heat waves over
   ambient air pollution, and effect modification by extremely high          western Turkey between 1965 and 2006, Theor. Appl. Clima-
   temperature in Wuhan, China, Res. Rep. Health Eff. Inst., 91–             tol., 112, 339–350, https://doi.org/10.1007/s00704-012-0704-0,
   217, 2010.                                                                2013.
Ramamurthy, P., González, J., Ortiz, L., Arend, M., and Moshary,           Wang, M. Y., Yim, S. H. L., Wong, D. C., and Ho, K. F.:
   F.: Impact of heatwave on a megacity: an observational analy-             Source contributions of surface ozone in China using an ad-
   sis of New York City during July 2016, Environ. Res. Lett., 12,           joint sensitivity analysis, Sci. Total Environ., 662, 385–392,
   054011, https://doi.org/10.1088/1748-9326/aa6e59, 2017.                   https://doi.org/10.1016/j.scitotenv.2019.01.116, 2019.
Scortichini, M., De Sario, M., De’Donato, F. K., Davoli, M.,               Wang, M. Y., Yim, S. H. L., Dong, G. H., Ho, K. F., and Wong,
   Michelozzi, P., and Stafoggia, M.: Short-Term Effects of Heat             D. C.: Mapping ozone source-receptor relationship and appor-
   on Mortality and Effect Modification by Air Pollution in 25               tioning the health impact in the Pearl River Delta region us-
   Italian Cities, Int. J. Environ. Res. Public Health, 15, 1771,            ing adjoint sensitivity analysis, Atmos. Environ., 222, 117026,
   https://doi.org/10.3390/ijerph15081771, 2018.                             https://doi.org/10.1016/j.atmosenv.2019.117026, 2020.
Shi, C., Nduka, I. C., Yang, Y., Huang, Y., Yao, R., Zhang,                Wang, Y., Nordio, F., Nairn, J., Zanobetti, A., and Schwartz,
   H., He, B., Xie, C., Wang, Z., and Yim, S. H. L.: Char-                   J. D.: Accounting for adaptation and intensity in project-
   acteristics and meteorological mechanisms of transbound-                  ing heat wave-related mortality, Environ. Res., 161, 464–471,
   ary air pollution in a persistent heavy PM2.5 pollution                   https://doi.org/10.1016/j.envres.2017.11.049, 2018.
   episode in Central-East China, Atmos. Environ., 223, 117239,            Wang, Y., Chan, A., Lau, G. N.-C., Li, Q., Yang, Y., and Yim, S. H.
   https://doi.org/10.1016/j.atmosenv.2019.117239, 2020.                     L.: Effects of urbanization and global climate change on regional
Shu, L., Wang, T., Han, H., Xie, M., Chen, P., Li, M., and                   climate in the Pearl River Delta and thermal comfort implica-
   Wu, H.: Summertime ozone pollution in the Yangtze River                   tions, 39, 2984–2997, https://doi.org/10.1002/joc.5996, 2019.
   Delta of eastern China during 2013–2017: Synoptic impacts               Wang, Y., Yim, S. H. L., Yang, Y., and Morin, C. W.: The effect of
   and source apportionment, Environ. Pollut., 257, 113631,                  urbanization and climate change on the mosquito population in
   https://doi.org/10.1016/j.envpol.2019.113631, 2020.                       the Pearl River Delta region of China, Int. J. Biometeorol., 64,
Silva, R. A., West, J. J., Lamarque, J.-F., Shindell, D. T., Collins, W.     501–512, https://doi.org/10.1007/s00484-019-01837-4, 2020.
   J., Dalsoren, S., Faluvegi, G., Folberth, G., Horowitz, L. W., Na-      Xia, Y., Guan, D., Meng, J., Li, Y., and Shan, Y.: Assessment of
   gashima, T., Naik, V., Rumbold, S. T., Sudo, K., Takemura, T.,            the pollution–health–economics nexus in China, Atmos. Chem.
   Bergmann, D., Cameron-Smith, P., Cionni, I., Doherty, R. M.,              Phys., 18, 14433–14443, https://doi.org/10.5194/acp-18-14433-
   Eyring, V., Josse, B., MacKenzie, I. A., Plummer, D., Righi, M.,          2018, 2018.
   Stevenson, D. S., Strode, S., Szopa, S., and Zengast, G.: The ef-       Xie, M., Zhu, K., Wang, T., Feng, W., Gao, D., Li, M., Li, S.,
   fect of future ambient air pollution on human premature mortal-           Zhuang, B., Han, Y., Chen, P., and Liao, J.: Changes in regional
   ity to 2100 using output from the ACCMIP model ensemble, At-              meteorology induced by anthropogenic heat and their impacts
   mos. Chem. Phys., 16, 9847–9862, https://doi.org/10.5194/acp-             on air quality in South China, Atmos. Chem. Phys., 16, 15011–
   16-9847-2016, 2016.                                                       15031, https://doi.org/10.5194/acp-16-15011-2016, 2016.
Skamarock, W. C. and Klemp, J. B.: A time-split nonhy-                     Yang, Y., Yim, S. H. L., Haywood, J., Osborne, M., Chan,
   drostatic atmospheric model for weather research and fore-                J. C. S., Zeng, Z., and Cheng, J. C. H.: Characteristics
   casting applications, J. Comput. Phys., 227, 3465–3485,                   of Heavy Particulate Matter Pollution Events Over Hong
   https://doi.org/10.1016/j.jcp.2007.01.037, 2008.                          Kong and Their Relationships With Vertical Wind Pro-
Stefanon, M., D’Andrea, F., and Drobinski, P.: Heatwave classifi-            files Using High-Time-Resolution Doppler Lidar Mea-
   cation over Europe and the Mediterranean region, Environ. Res.            surements, J. Geophys. Res.-Atmos., 124, 9609–9623,
   Lett., 7, 014023, https://doi.org/10.1088/1748-9326/7/1/014023,           https://doi.org/10.1029/2019JD031140, 2019.
   2012.                                                                   Yim, S. H. L.: Development of a 3D Real-Time Atmospheric Mon-
Streets, D. G., Bond, T. C., Carmichael, G. R., Fernandes, S. D., Fu,        itoring System (3DREAMS) Using Doppler LiDARs and Appli-
   Q., He, D., Klimont, Z., Nelson, S. M., Tsai, N. Y., Wang, M.             cations for Long-Term Analysis and Hot-and-Polluted Episodes,
   Q., Woo, J.-H., and Yarber, K. F.: An inventory of gaseous and            Remote Sens., 12, 1036, https://doi.org/10.3390/rs12061036,
   primary aerosol emissions in Asia in the year 2000, J. Geophys.           2020.
   Res., 108, 8809, https://doi.org/10.1029/2002JD003093, 2003.            Yim, S. H. L., Fung, J. C. H., Lau, A. K. H., and Kot, S. C.: Air
Tan, P.-N., Steinbach, M., Karpatne, A., and Kumar, V.: Introduc-            ventilation impacts of the “wall effect” resulting from the align-
   tion to data mining, 2nd Edn., Pearson, NY, 2019.                         ment of high-rise buildings, Atmos. Environ., 43, 4982–4994,
Tong, C. H. M., Yim, S. H. L., Rothenberg, D., Wang, C., Lin,                https://doi.org/10.1016/j.atmosenv.2009.07.002, 2009.
   C.-Y., Chen, Y. D., and Lau, N. C.: Assessing the impacts

https://doi.org/10.5194/acp-21-13443-2021                                                 Atmos. Chem. Phys., 21, 13443–13454, 2021
You can also read