Selective dendritic localization of mRNA in Drosophila mushroom body output neurons - eLife
←
→
Page content transcription
If your browser does not render page correctly, please read the page content below
SHORT REPORT

                                    Selective dendritic localization of mRNA
                                    in Drosophila mushroom body output
                                    neurons
                                    Jessica Mitchell1, Carlas S Smith1,2, Josh Titlow3, Nils Otto1, Pieter van Velde2,
                                    Martin Booth1,4, Ilan Davis3, Scott Waddell1*
                                    1
                                     Centre for Neural Circuits and Behaviour, University of Oxford, Oxford, United
                                    Kingdom; 2Delft Center for Systems and Control, Delft University of Technology,
                                    Delft, Netherlands; 3Department of Biochemistry, University of Oxford, Oxford,
                                    United Kingdom; 4Department of Engineering Science, University of Oxford,
                                    Oxford, United Kingdom

                                    Abstract Memory-relevant neuronal plasticity is believed to require local translation of new
                                    proteins at synapses. Understanding this process requires the visualization of the relevant mRNAs
                                    within these neuronal compartments. Here, we used single-molecule fluorescence in situ
                                    hybridization to localize mRNAs at subcellular resolution in the adult Drosophila brain. mRNAs for
                                    subunits of nicotinic acetylcholine receptors and kinases could be detected within the dendrites of
                                    co-labeled mushroom body output neurons (MBONs) and their relative abundance showed cell
                                    specificity. Moreover, aversive olfactory learning produced a transient increase in the level of
                                    CaMKII mRNA within the dendritic compartments of the g5b’2a MBONs. Localization of specific
                                    mRNAs in MBONs before and after learning represents a critical step towards deciphering the role
                                    of dendritic translation in the neuronal plasticity underlying behavioral change in Drosophila.

*For correspondence:
                                    Introduction
scott.waddell@cncb.ox.ac.uk         Memories are believed to be encoded as changes in the efficacy of specific synaptic connections.
                                    Dendritic localization of mRNA facilitates specificity of synaptic plasticity by enabling postsynaptic
Competing interests: The
                                    synthesis of new proteins where and when they are required (Holt et al., 2019). Visualizing individual
authors declare that no
                                    dendritically localized mRNAs in memory-relevant neurons is therefore crucial to understanding this
competing interests exist.
                                    process of neuronal plasticity.
Funding: See page 13                    Single-molecule fluorescence in situ hybridization (smFISH) enables cellular mRNAs to be imaged
Received: 03 September 2020         at single-molecule resolution through the hybridization of a set of complementary oligonucleotide
Accepted: 15 March 2021             probes, each labeled with a fluorescent dye. Recent improvements in smFISH permit mRNA tran-
Published: 16 March 2021            scripts to be visualized in the dense heterogenous tissue of intact Drosophila brains (Long et al.,
                                    2017; Yang et al., 2017). Combining whole fly brain smFISH with neuron-specific co-labeling makes
Reviewing editor: Mani
Ramaswami, Trinity College
                                    Drosophila an ideal model to investigate cell-specific mRNA localization and whether it is regulated
Dublin, Ireland                     in response to experience.
                                        Olfactory learning in Drosophila depresses cholinergic synaptic connections between odor-spe-
   Copyright Mitchell et al. This
                                    cific mushroom body Kenyon cells (KCs) and mushroom body output neurons (MBONs)
article is distributed under the
                                    (Barnstedt et al., 2016; Cohn et al., 2015; Handler et al., 2019; Hige et al., 2015; Owald et al.,
terms of the Creative Commons
Attribution License, which          2015; Perisse et al., 2016; Séjourné et al., 2011). This plasticity is driven by dopaminergic neurons
permits unrestricted use and        whose presynaptic terminals innervate anatomically discrete compartments of the mushroom body,
redistribution provided that the    where they overlap with the dendrites of particular MBONs (Aso et al., 2010; Aso et al., 2014;
original author and source are      Burke et al., 2012; Claridge-Chang et al., 2009; Li et al., 2020; Lin et al., 2014; Liu et al., 2012).
credited.                           Dopamine-driven plasticity is mediated by cAMP-dependent signaling and associated kinases such

Mitchell et al. eLife 2021;10:e62770. DOI: https://doi.org/10.7554/eLife.62770                                                      1 of 17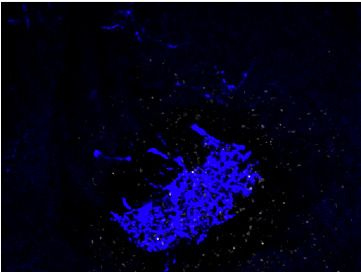
Short report                                                                                                      Neuroscience

                                    as calcium/calmodulin-dependent protein kinase II (CaMKII) and protein kinase A (PKA) (Boto et al.,
                                    2014; Handler et al., 2019; Hige et al., 2015; Kim et al., 2007; Qin et al., 2012; Tomchik and
                                    Davis, 2009; Yu et al., 2006; Zhang and Roman, 2013). Here, we demonstrate localization of
                                    mRNAs in the 3D volumes of MBON dendrites by registering smFISH signals with co-labeled neu-
                                    rons using a custom image analysis pipeline. Moreover, we find that aversive learning transiently ele-
                                    vates dendritic CaMKII transcript levels within g5b’2a MBONs.

                                    Results and discussion
                                    mRNA localization in the intact adult Drosophila brain
                                    Mammalian CaMKII mRNA is transported to neuronal dendrites, where it is locally translated in
                                    response to neuronal activity (Bagni et al., 2000; Miller et al., 2002; Ouyang et al., 1999). Dro-
                                    sophila CAMKII is critical for behavioral plasticity (Griffith, 1997; Malik et al., 2013) and is also
                                    thought to be locally translated (Ashraf et al., 2006). However, fly CAMKII mRNAs have not been
                                    directly visualized within individual neurons. We therefore first hybridized CaMKII smFISH probes to
                                    whole-mount brains and imaged the mushroom body (MB) calyx (Figure 1A, B), a recognizable neu-
                                    ropil containing the densely packed dendrites of ~2000 KCs and their presynaptic inputs from ~350
                                    cholinergic olfactory projection neurons (Bates et al., 2020a) using a standard spinning disk confocal
                                    microscope. To detect and quantify mRNA within the 3D volume of the brain, we developed a FIJI-
                                    compatible custom-built image analysis tool that segments smFISH image data and identifies spots
                                    within the 3D volume using a probability-based hypothesis test. This enabled detection of mRNAs
                                    with a false discovery rate of 0.05. CaMKII smFISH probes labeled 56 ± 5 discrete puncta within each
                                    calyx (Figure 1B, C). In comparison, smFISH probes directed to the a1 nicotinic acetylcholine recep-
                                    tor (nAChR) subunit labeled 33 ± 2 puncta in the calyx (Figure 1B, C). Puncta were diffraction limited
                                    and the signal intensity distribution was unimodal (Figure 1D–D’), indicating that they represent sin-
                                    gle mRNA molecules.

                                    mRNA localization within MBON dendrites
                                    Drosophila learning is considered to be implemented as plasticity of cholinergic KC-MBON synap-
                                    ses. To visualize and quantify mRNA specifically within the dendritic field of the g5b’2a and
                                    g1pedc>a/b MBONs, we expressed a membrane-tethered UAS-myr::SNAP reporter transgene using
                                    MBON-specific GAL4 drivers. This permitted simultaneous fluorescent labeling of mRNA with
                                    smFISH probes and the MBON using the SNAP Tag (Figure 1E). To correct for chromatic misalign-
                                    ment (Matsuda et al., 2018) that results from imaging heterogenous tissue at depth, we also co-
                                    stained brains with the dsDNA-binding dye Vybrant DyeCycle Violet (VDV). VDV dye has a broad
                                    emission spectrum so labeled nuclei can be imaged in both the SNAP MBON and smFISH mRNA
                                    channels. This triple-labeling approach allowed quantification and correction of any spatial mismatch
                                    between MBON and smFISH channels in x, y, and z planes, which ensures that smFISH puncta are
                                    accurately assigned within the 3D volume of the MBON dendritic field (Figure 1F).
                                       Using this smFISH approach, we detected an average of 32 ± 2 CaMKII mRNAs (Figure 1G, G’)
                                    within the dendrites of g5b’2a MBONs. However, in contrast to the calyx, we did not detect
                                    nAChRa1 in g5b’2a MBON dendrites (Figure 1H, H’). This differential localization of the CaMKII and
                                    nAChRa1 mRNAs within neurons of the mushroom body is indicative of cell specificity. To probe
                                    mRNA localization in MBONs more broadly, we used a single YFP smFISH probe set and a collection
                                    of fly strains harboring YFP insertions in endogenous genes (Lowe et al., 2014). We selected YFP
                                    insertions in the CaMKII, PKA-R2, and Ten-m genes as test cases and compared the localization of
                                    their YFP-tagged mRNAs between g5b’2a MBON and g1pedc>a/b MBON dendrites.
                                       The CaMKII::YFP allele is heterozygous in flies also expressing myr::SNAP in MBONs. Therefore,
                                    YFP smFISH probes detected half the number of CaMKII mRNAs in g5b’2a MBON dendrites com-
                                    pared to CaMKII-specific probes (Figure 2A, A’, C). Importantly, YFP probes hybridized to YFP-neg-
                                    ative control brains produced background signal (Figure 2B, B’) that was statistically distinguishable
                                    in brightness from genuine smFISH puncta (Figure 2D). Comparing data from YFP-negative and
                                    YFP-positive samples allowed us to define the false discovery rate to be 14% when using YFP-
                                    directed probes (Figure 2D, Figure 2—figure supplement 1). These results indicate that the YFP
                                    probes are specific and that the YFP insertion does not impede localization of CaMKII mRNA. We

Mitchell et al. eLife 2021;10:e62770. DOI: https://doi.org/10.7554/eLife.62770                                                     2 of 17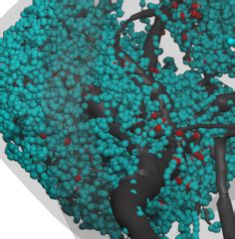
Short report                                                                                                            Neuroscience

     '                        (                                           !"#$%%                                         &'!()"*+

                                      !"#!$                               %#!$

                                                     2$3456
                                                  :;?

     *                         )                                           )!

                                          !"#!$                                  %#!$

         !                                        &                       (6+")$)"-' +5$''(%        (!"##"-'        !"#$%"&'!(')*
                                                                                                                     +$%+,%$)"-'
                                                                                        )*)#+,-
                                                                          &"'#($                    '.!#($
                                                      +$%"7/$)"-'*.$)$

                                                                                        )*)#+,-
                                                                          &"'#($                    899#($

                                                                                                                 .('./")(0#!1234
                                                                                        +-(+/01-2               +5$''(%*$%"&'!(')
                                                      (68(/"!(')$%*.$)$

                                                                          '&7#($                    '.!#($

                                                                                        2$3456
             %"#!$                                                        89"#($                    899#($

    !!"#"# $%&'()*+,-.*/(01233/'*45
    6#$788 !"#$%&                                                                9*:;
Short report                                                                                                                  Neuroscience

Figure 1 continued
distribution (full width half maximum, bottom) in MB calyx. (D’). Unimodal smFISH spot intensity distribution (signal/background) indicates imaging at
single-molecule resolution. (E) Reconstruction of a g5b’2a MBON (black) showing the dendritic field (blue) and MB (light gray). The projection to the
contralateral MB is truncated. (F) Alignment of dendrite and smFISH imaging channels using co-labeling with dsDNA Vybrant DyeCycle Violet (VDV)
dye. VDV is excited with 405 nm and emission is collected in the dendritic and smFISH imaging channels, which were then aligned in x, y, and z planes.
(G, G’) CaMKII smFISH within the g5b’2a MBON dendrite co-labeled with R66C08-GAL4-driven UAS-myr::SNAP and visualized with JF547SNAP dye.
Images are maximum intensity projections of ten 0.2 mm z-sections. (H, H’) nAchRa1 smFISH in g5b’2aMBONs. Images are maximum intensity
projections of ten 0.2 mm z-sections. (I) Single CaMKII smFISH puncta localized within a g5b’2a MBON dendrite (green arrowhead). Images are single
z-sections of 0.2 mm. (J) Single CaMKII smFISH puncta localized outside of the g5b’2a MBON dendrite (red arrowhead). Images are single z-sections of
0.2 mm.

                                    detected a similar abundance of CaMKII::YFP in the dendritic field of g5b’2a (Figure 2E) and the g1
                                    dendritic region of g1pedc>a/b (Figure 2F) MBONs (Figure 2G). In contrast, more PKA-R2 mRNAs
                                    were detected in the dendrites of g5b’2a MBONs compared to g1pedc>a/b MBONs (Figure 2G).
                                    Importantly, the relative abundance of dendritically localized CaMKII and PKA-R2 mRNAs did not
                                    simply reflect the levels of these transcripts detected in the MBON somata (Figure 2H). In addition,
                                    we did not detect Ten-m mRNAs in either g5b’2a or g1pedc>a/b MBON dendrites (Figure 2G, I),
                                    although they were visible in neighboring neuropil and at low levels in the MBON somata
                                    (Figure 2H). These results suggest that CaMKII and PKA-R2 mRNAs are selectively localized to
                                    MBON dendrites.
                                        Although we did not detect nAChRa1 mRNA within g5b’2a MBON dendrites, prior work has
                                    shown that nAChR subunits, including nAChRa1, are required in g5b’2a MBON postsynapses to reg-
                                    ister odor-evoked responses and direct odor-driven behaviors (Barnstedt et al., 2016). Since the
                                    YFP insertion collection does not include nAChR subunits, we designed nAChRa5 and nAChRa6-
                                    specific smFISH probes. These probes detected nAchRa5 and nAchRa6 mRNAs within g5b’2a and
                                    g1pedc>a/b MBON dendrites, with nAchRa6 being most abundant (Figure 2G). Importantly, we
                                    detected nAchRa1, nAchRa5, and nAchRa6 at roughly equivalent levels in the g5b’2a and
                                    g1pedc>a/b MBON somata (Figure 2H). Therefore, the selective localization of nAchRa5 and
                                    nAchRa6a6 mRNA to MBON dendrites indicates that these receptor subunits may be locally trans-
                                    lated to modify the subunit composition of postsynaptic nAChR receptors.
                                        Localized mRNAs were on average 2.8 more abundant in g5b’2a relative to the g1 region of
                                    g1pedc>a/b MBON dendrites (Figure 2G). We therefore tested whether this apparent differential
                                    localization correlated with dendritic volume and/or the number of postsynapses between these
                                    MBONs. Using the recently published electron microscope volume of the Drosophila ‘hemibrain’
                                    (Scheffer et al., 2020; Figure 2E, F), we calculated the dendritic volume of the g5b’2a MBON to be
                                    1515.36 nm3 and the g1 region of the g1pedc>a/b MBON to be 614.20 nm3. In addition, the g5b’2a
                                    regions of the g5b’2a MBON dendrite contain 30,625 postsynapses, whereas there are only 17,020
                                    postsynapses in the g1 region of the g1pedc>a/b MBON. Larger dendritic field volume and synapse
                                    number is therefore correlated with an increased number of localized nAchRa5, nAchRa6, and PKA-
                                    R2 mRNAs. The correlation, however, does not hold for CaMKII mRNA abundance. Selective locali-
                                    zation of mRNAs to MBON dendrites therefore appears to be more nuanced than simply reflecting
                                    the size of the dendritic arbor, the number of synapses, or the level of transcripts detected through-
                                    out the cell.

                                    Learning transiently changes CAMKII mRNA abundance in g5b’2a
                                    MBON dendrites
                                    We tested whether CaMKII::YFP mRNA abundance in g5b’2a and g1pedc>a/b MBONs was altered
                                    following aversive learning (Figure 3A, B). We also quantified mRNA in the somata and nuclei of
                                    these MBONs (Figure 3A, B’). Transcriptional activity is indicated by a bright nuclear transcription
                                    focus (Figure 3C, Figure 3—figure supplement 1). We initially subjected flies to four conditions
                                    (Figure 3D): (1) an ‘untrained’ group that was loaded and removed from the T-maze but not
                                    exposed to odors or shock; (2) an ‘odor only’ group, exposed to the two odors as in training but
                                    without shock; (3) a ‘shock only’ group that was handled as in training and received the shock deliv-
                                    ery but no odor exposure; and (4) a ‘trained’ group that was aversively conditioned by pairing one

Mitchell et al. eLife 2021;10:e62770. DOI: https://doi.org/10.7554/eLife.62770                                                                 4 of 17
Short report                                                                                                          Neuroscience

            !+"#," #-./012345627089:&&7/2)*
            !"#$%%&&'()*!"#$%&                               '()'() *(+,-(.
             #                      #!                        $                         $!

            !"#!$                   %#!$                     !"#!$                      %#!$

      !                         "                                     %                         &

                                                                                                           %"#!$

    (                                                          )

        '
     A+BC,"*#-./012345627089:&&7/2)*
     !"#$%%&&'()   )$20>,*&&'()   GE;08&&'()                 ;2$@*            ;2$+*        ;2$?*

        %# $
        %#!$
        %#!$

     !@DEF
Short report Neuroscience
Figure 2 continued
allele is heterozygous, resulting in detection of half as many CaMKII mRNAs in g5b’2a MBONs using YFP probes relative to that detected with CaMKII
gene-specific probes. (D) Signal/background intensity distribution of YFP probe signals in CaMKII::YFP brains relative to control brains with no
threshold on signal detection. The signal/background intensity threshold for quantitative analyses (dotted red line) resulted in a false discovery rate of
14% (indicated by the overlap of the histograms on the right side of the dotted red line) (see also Figure 2—figure supplement 1). (E) Reconstruction
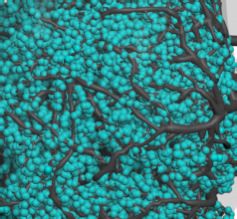
of a g5b’2a MBON. Individual postsynapses (turquoise spheres) and presynapses (red spheres) are labeled. The projection to the contralateral
mushroom body (MB) is truncated. (F) Reconstruction of a g1pedc>a/b MBON. Individual postsynapses (turquoise spheres) and presynapses (red
spheres) are labeled. The projection to the contralateral MB is truncated. (G) Quantification of mRNA localization in g5b’2a and g1pedc>a/b MBON
dendrites with YFP smFISH probes and gene-specific nicotinic acetylcholine receptor (nAChR) subunit smFISH probes. More PKA-R2 transcripts localize
within the dendrites of g5b’2a MBONs relative to g1pedc>a/b MBONs (unpaired t-test: p=0.004, t = 5.069, df = 11). Ten-m mRNAs did not localize to
either MBON dendritic field. CaMKII mRNAs were detected in equal abundance. nAchRa1 mRNAs did not localize to the dendrites of either g5b’2a or
g1pedc>a/b MBONs. More nAchRa5 (unpaired t-test: p=0.004, t = 3.368, df = 15) and nAchRa6 (unpaired t-test: p=0.046, t = 2.274, df = 10) mRNAs
localized to g5b’2a MBON dendrites relative to g1pedc>a/b MBON dendrites. (H) Quantification of mRNA in g5b’2a and g1pedc>a/b MBON somata
with YFP smFISH probes and gene-specific nAChR subunit smFISH probes. More CaMKII transcripts were present within g5b’2a MBON somata relative
to g1pedc>a/b MBON somata (unpaired t-test: p=0.0061, t = 3.103, df = 18). More Ten-m (Mann–Whitney test: p=0.0093, Mann–Whitney U = 120) and
nAchRa1 (unpaired t-test: p=0.0359, t = 2.250, df = 20) transcripts were detected in g1pedc>a/b MBON somata relative to g5b’2a MBON somata. (I)
Example smFISH images of mRNAs localized in g5b’2a (R66C08-GAL4>UAS-myr::SNAP) and g1pedc>a/b MBON (MB112C-GAL4>UAS-myr::SNAP)
dendrites. Images are maximum intensity projections of ten 0.2 mm z-sections. Asterisks denote significant difference (pa/b MBONs after learning did not reveal a
change in mRNA abundance in the dendrites or somata between trained flies and all control groups
at all timepoints measured (Figure 3F). These results indicate specificity to the response observed in
the g5b’2a MBONs.
Since CaMKII protein is also labeled with YFP in CaMKII::YFP flies, we assessed protein expression
by measuring YFP fluorescence intensity specifically within the MBON dendrites. This analysis did
not reveal a significant difference in fluorescence intensity across treatments (Figure 3—figure sup-
plement 2). However, since smFISH provides single-molecule estimates of mRNA abundance, a simi-
lar level of single-molecule sensitivity may be required to detect subcellular resolution changes in
protein copy number. Moreover, new synthesis and replacement of specific isoforms of CaMKII
could radically change local kinase activity (Kuklin et al., 2017; Zalcman et al., 2018), even without
an observable change in overall abundance.
Early studies in Drosophila demonstrated that broad disruption of CAMKII function impaired
courtship learning (Broughton et al., 2003; Griffith et al., 1994; Griffith et al., 1993; Joiner and
Griffith, 1997). In contrast, later studies that manipulated activity more specifically in olfactory pro-
jection neurons or particular classes of KCs reported a preferential loss of middle-term or long-term
Mitchell et al. eLife 2021;10:e62770. DOI: https://doi.org/10.7554/eLife.62770 6 of 17Short report Neuroscience
!!"#"# $%&'()*+,-.*/(01233/'*456#$788339:4; !
# #! &'()*+',-.,/)"0/+1*"
2,)345"*/#(.,+"#678"
$%"!# !"!# !"!#
"
!?@-$%" $%&'()*+,-.*/(01233/'*456#$788339:4; 9%*::;UAS-myr::SNAP). Images are maximum intensity
projections of ten 0.2 mm z-sections. (B, B’). CaMKII::YFP smFISH in g1pedc>a/b MBON dendrites and soma (MB112C-GAL4>UAS-myr::SNAP). Nuclear
transcription foci are indicated (red arrowheads). Images are maximum intensity projections of ten 0.2 mm z-sections. (C) CaMKII::YFP smFISH signal/
Figure 3 continued on next page
Mitchell et al. eLife 2021;10:e62770. DOI: https://doi.org/10.7554/eLife.62770 7 of 17Short report Neuroscience
Figure 3 continued
background in transcriptionally active g5b’2a somata. Transcription foci are readily distinguished as the brightest puncta in the soma/nucleus (red data
points). Note that only one transcription focus can be visualized per cell since the CaMKII::YFP allele is heterozygous. (D) Schematic of aversive training
and control protocols followed by smFISH. The yellow and red circles represent the two odors. (E) CaMKII::YFP mRNA numbers in g5b’2a MBON
dendrites increase 10 min after odor–shock pairing, relative to control groups (one-way ANOVA: untrained-10 min p=0.001; odor only-10 min p=0.016;
shock only-10 min p=0.002), and decrease to baseline by 2 hr (one-way ANOVA: 10 min-2 h pa/b MBON dendrites (one-way ANOVA:
f = 1.473, p=0.212), their somata (one-way ANOVA: f = 2.183, p=0.067), and there is no detected change in CaMKII::YFP transcription (X2=3.723, df = 5,
p=0.59). (G) Signal/background ratio of CaMKII::YFP transcription foci in g5b’2a MBON somata. (H) Signal/background ratio of CaMKII::YFP mRNA
localized in g5b’2a MBON dendrites. Asterisks denote significant difference (pa/b MBON responses to
the previously shock-paired odor are depressed immediately after aversive learning (Hige et al.,
2015; Perisse et al., 2016), prior studies observed a learning-related increase of the conditioned
odor response of g5b’2a MBONs (Bouzaiane et al., 2015; Owald et al., 2015), likely resulting from
a release of feedforward inhibition from g1pedc>a/b MBONs (Felsenberg et al., 2018;
Perisse et al., 2016). We therefore speculate that the specific change in CaMKII mRNA abundance
in the g5b’2a MBONs after aversive learning might be a consequence of network-level potentiation
of their activity, such as that that would result from a release from inhibition. Since CAMKII local
translation-dependent plasticity is expected to underlie more extended forms of memory
(Giese and Mizuno, 2013; Miller et al., 2002), it will be interesting to investigate whether the train-
ing-evoked change in CaMKII mRNA abundance in the g5b’2a MBON dendrites contributes to later
aversive memory formation and maintenance. This may be possible with MBON-specific targeting of
CAMKII mRNAs that contain the long 3’UTR, which is essential for dendritic localization and activity-
dependent local translation (Aakalu et al., 2001; Kuklin et al., 2017; Mayford et al., 1996;
Rook et al., 2000).
Materials and methods
Key resources table
Reagent type
(species) or resource Designation Source or reference Identifiers Additional information
Gene CaMKII NCBI Gene ID: 43828
(Drosophila melanogaster)
Gene PKA-R2 NCBI Gene ID: 36041
(Drosophila melanogaster)
Gene Ten-m NCBI Gene ID: 40464
(Drosophila melanogaster)
Gene nAChRa1 NCBI Gene ID: 42918
(Drosophila melanogaster)
Gene nAChRa5 NCBI Gene ID: 34826
(Drosophila melanogaster)
Gene nAChRa6 NCBI Gene ID: 34304
(Drosophila melanogaster)
Continued on next page
Mitchell et al. eLife 2021;10:e62770. DOI: https://doi.org/10.7554/eLife.62770 8 of 17Short report Neuroscience
Continued
Reagent type
(species) or resource Designation Source or reference Identifiers Additional information
Genetic reagent R66C08-GAL4 Bloomington Drosophila RRID:BDSC_49412
(Drosophila melanogaster) Stock Center
(Owald et al., 2015)
Genetic reagent MB112c-GAL4 Bloomington Drosophila RRID:BDSC_68263
(Drosophila melanogaster) Stock Center
(Perisse et al., 2016)
Genetic reagent UAS-myr::SNAPf Bloomington Drosophila RRID:BDSC_58376
(Drosophila melanogaster) Stock Center
Genetic reagent CaMKII::YFP Kyoto Stock Centre RRID:DGGR_115127
(Drosophila melanogaster) (Lowe et al., 2014)
Genetic reagent PKA-R2::YFP Kyoto Stock Centre RRID:DGGR_115174
(Drosophila melanogaster) (Lowe et al., 2014)
Genetic reagent Ten-m::YFP Kyoto Stock Centre RRID:DGGR_115131
(Drosophila melanogaster)
(Lowe et al., 2014)
Chemical compound 20% v/v paraformaldehyde Thermo Fisher Scientific Cat#15713S
Chemical compound RNase-free 10 PBS Thermo Fisher Scientific Cat#AM9625
Chemical compound Triton X-100 Sigma-Aldrich Cat#T8787
Chemical compound 20 RNase-free SSC Thermo Fisher Scientific Cat#AM9763
Chemical compound Deionized formamide Thermo Fisher Scientific Cat#AM9342
Chemical compound 50% dextran sulphate Millipore Cat#S4030
Chemical compound Vybrant DyeCycle Violet Stain Thermo Fisher Scientific Cat#V35003
Chemical compound Vectashield anti-fade Vector Laboratories Cat#H-1000-10
mounting medium
Chemical compound JF549-SNAPTag Grimm et al., 2015
Chemical compound Mineral oil Sigma-Aldrich Cat#M5904
Chemical compound 4-Methocyclohexanol Sigma-Aldrich Cat#218405
(98%)
Chemical compound 3-Octanol (99%) Sigma-Aldrich Cat#153095
Software, algorithm FIJI NIH http://fiji.sc/
(Schindelin et al., 2012)
Software, algorithm MATLAB R2019b The MathWorks, https://www.mathworks.com/
Natick, MA products/matlab.html
Software, algorithm GraphPad Prism 8 GraphPad Software, https://www.graphpad.com/
La Jolla, CA scientific-software/prism/
Software, algorithm Drosophila brain This paper see Data availability section
smFISH analysis (Mitchell, 2021)
Software, algorithm Blender Blender Foundation, https://www.blender.org
Amsterdam
Software, algorithm NAVis 0.2.0 Bates et al., 2020b https://pypi.org/
project/navis/
Fly strains
Flies were raised on standard cornmeal agar food in plastic vials at 25˚C and 40–50% relative humid-
ity on a 12 hr:12 hr light:dark cycle. Details of fly strains are listed in the Key Resources Table.
smFISH probes
Oligonucleotide probe sets were designed using the web-based probe design software https://
www.biosearchtech.com/stellaris-designer. The YFP smFISH probe set was purchased from LGC Bio-
Search Technologies (CA, USA) prelabeled with Quasar-670 dye. CaMKII, nAChRa1, nAChRa5, and
nAChRa6 DNA oligonucleotide sets were synthesized by Sigma-Aldrich (Merck) and enzymatically
Mitchell et al. eLife 2021;10:e62770. DOI: https://doi.org/10.7554/eLife.62770 9 of 17Short report Neuroscience
labeled with ATTO-633 according to Gaspar et al., 2017. DNA oligonucleotide sequences for each
smFISH probe set are provided in Supplementary file 1.
Whole Drosophila brain smFISH
Whole adult brain smFISH was performed essentially as described (Yang et al., 2017). The 2–4-day-
old adult Drosophila brains were dissected in 1 phosphate buffered saline (PBS) and fixed in 4% v/
v paraformaldehyde for 20 min at room temperature. Brains were washed 2 with PBS, followed by
20 min in 0.3% v/v Triton X-100 in PBS (PBTX) to permeabilize the tissue, then 15 min in PBTX with
500 nM JF549-SNAPTag (Grimm et al., 2015) for neuronal labeling. Then, 3 10 min washes in
PBTX removed excess dye. Samples were then incubated in wash buffer (2 RNase-free SSC + 10%
v/v deionized formamide) for 10 min at 37˚C, wash buffer was replaced with hybridization buffer (2
RNase-free SSC, 10% v/v deionized formamide, 5% w/v dextran sulphate, 250 nM smFISH probes),
and samples incubated overnight at 37˚C. Hybridization buffer was removed before samples were
washed 2 in freshly prepared wash buffer and incubated 40 min in wash buffer containing Vybrant
DyeCycle Violet Stain (1:1000) to label nuclei. Samples were then washed 3 times in wash buffer,
mounted on a glass slide covered with Vectashield anti-fade mounting medium (refractive index
1.45), and immediately imaged.
Olfactory conditioning
Aversive olfactory conditioning was performed essentially as described by Tully and Quinn, 1985. 3-
Octanol (OCT) was used as the shock-paired odor. 4-Methylcyclohexanol (MCH) was used as the
unpaired odor. Odors were prepared at concentrations of 9 ml OCT in 8 ml mineral oil, and 8 ml
MCH in 8 ml mineral oil. Groups of ~100 flies were aliquoted into plastic vials containing standard
cornmeal agar food and a 2 6 cm piece of filter paper. Flies were conditioned as follows: 1 min
OCT paired with 12 90 V shocks at 5 s interstimulus interval; 45 s clean air; 1 min MCH. Control
groups were handled in the same way except for the differing presentation of either odors or shock.
Untrained flies experienced no odor or shock, the odor only group experienced the two odor pre-
sentations without shock, and the shock only group received the shock presentations but no odors.
Aversive olfactory conditioning was performed at 23 ˚C and 70% relative humidity. Following train-
ing, flies were returned to food vials and brains were dissected either 10 min, 1 hr, or 2 hr later, and
smFISH analyses performed.
For the ’unpaired’ experiment, the interval between presentations was extended from 45 to 180 s
to avoid trace conditioning of the unpaired odor. In the trained group, flies were presented with 1
min OCT paired with 12 90 V shocks at 5 s interstimulus interval, 180 s clean air, and then 1 min
MCH. In the unpaired group, flies received 12 90 V shocks at 5 s interstimulus interval (no odor
pairing), 180 s clean air, and then 1 min MCH. Other control groups were handled in the same way
except that the odor only group experienced the two odor presentations without shock and the
shock only group received the shock presentations but no odors. Following training, flies were
returned to food vials and brains were dissected 10 min later for smFISH analyses.
Microscopy
Samples were imaged on a spinning disk confocal microscope (Perkin Elmer UltraView VoX) with a
60 1.35 N.A. oil immersion UPlanSApo objective (Olympus) and a filter set to image fluorophores
in DAPI, FITC, TRITC, and CY5 channels (center/bandwidth; excitation: 390/18, 488/24, 542/27, 632/
22 nm; emission: 435/48, 594/45, 676/34 nm), the corresponding laser lines (488/4.26, 561/6.60,
640/3.2, 405/1.05, 440/2.5, 514/0.8 nm/mW), and an EMCCD camera (ImagEM, Hamamatsu Photon-
ics). The camera pixel size is 8.34 mm, resulting in a pixel size in image space of approximately 139
nm. Optical sections were acquired with 200 nm spacing along the z-axis within a 512 512 pixel
(71.2 71.2 mm) field of view.
Deconvolution
Deconvolution was carried out using commercially available software (Huygens Professional
v19.10.0p1, SVI Delft, The Netherlands). Raw image data generated in .mvd2 file format were con-
verted to OME.tiff format using FIJI (Schindelin et al., 2012) (convert_mvd2_to_tif.ijm). Spherical
aberration was estimated from the microscope parameters (see Microscopy). Z-dependent
Mitchell et al. eLife 2021;10:e62770. DOI: https://doi.org/10.7554/eLife.62770 10 of 17Short report Neuroscience
momentum preserving deconvolution (CLME algorithm, theoretical high-NA PSF, iteration optimized
with quality change threshold 0.1% and iterations 40 maximum, signal-to-noise ratio 20, area radius
of background estimation is 700 nm, a brick mode is 1 PSF per brick, single array detector with
reduction mode SuperXY) was then applied to compensate for the depth-dependent distortion in
point spread function, thereby reducing artifacts and increasing image sharpness.
Multi-channel alignment
Misalignment between channels was corrected for using Chromagnon (v. 0.81) (Matsuda et al.,
2018). To estimate channel misalignment, nuclei were labeled with the broad emission spectrum
dye (Vybrant DyeCycle Violet Stain, Thermo Fisher) (Smith et al., 2015). The dye was excited at 405
nm, and emission was recorded using the appropriate filters for each imaging channel. Chromatic
shift was estimated by finding the affine transformation that delivers a minimum mean square error
between the nuclear stain in the various channels. Nuclear calibration channels for chromatic shift
correction were separated using ImageJ (see macro Split_ometiff_channels_for_chromcorrect.ijm).
The affine transformation was estimated and alignment was performed by calling Chromagnon from
Python (see script chromagnon_bash.py). The resulting aligned and deconvolved images were saved
in .dv format for further downstream analysis.
Calculating postsynaptic abundance and volume of g5b’2a and
g1pedc>a/b MBON dendrites
Neuromorphological calculations were performed with NAVis 0.2.0 library functions in Python
(https://pypi.org/project/navis/) (Bates et al., 2020a) using data obtained from the Drosophila hemi-
brain dataset (v.1.1) (https://neuprint.janelia.org) (Scheffer et al., 2020). To calculate the dendritic
volume and postsynaptic abundance of g5b’2a and g1pedc>a/b MBONs, neuron skeletons, neuropil
meshes, and synapse data were first imported. Neural skeletons were then used to generate 3D neu-
ron reconstructions. Dendritic processes of the g5b’2a MBON were determined by intersecting neu-
ronal skeletons with the MB mesh containing the g5 and b’2a compartments. Dendritic processes of
the g1pedc>a/b MBON were determined by intersecting the skeleton within the g1 MB compart-
ment mesh. The available g1 MB compartment mesh did not encompass the entirety of the
g1pedc>a/b MBON dendrites in the g1 MB compartment, so the volume of the mesh was scaled up
1.35. This intersects with almost all g1pedc>a/b MBON dendrites in the g1 MB compartment, but
not any other substantial part of the neuron. Dendritic volume (nm3) was calculated as the sum of
the neurite voxels multiplied by 83 since the resolution of each voxel is 8 nm3. The number of postsy-
napses within these compartments was also determined using the synapse data that accompany the
neuron skeletons (Scheffer et al., 2020).
Data visualization smFISH data were visualized in FIJI (Schindelin et al., 2012). Maximum intensity
projections representing 2 mm sections are presented for visualization purposes. Figure 1I and J are
single z-sections (representing a 0.2 mm section). The 3D reconstructions of g5b’2a and g1pedc>a/b
MBONs were created in Blender v.2.8.2 with NAVis 0.2.0 plug-in and using data obtained from
http://www.neuprint.janelia.org.
mRNA detection
An smFISH spot detection MATLAB script based on Smith et al., 2015 was written to quantify local-
ized mRNA transcripts in Drosophila brains. Software for processing smFISH datasets is available as
Supplementary Software. The smFISH channel was extracted and stored as a 3D grayscale image.
mRNA signal was detected using 3D generalized likelihood ratio test (Smith et al., 2015). The false
detection rate is 0.05, and the spot width is sx,y = 1.39 and sz = 3.48. After 3D detection, the inten-
sity, background, width, and subpixel position of the detected mRNA spots are estimated using
maximum likelihood estimation (MLE) (Smith et al., 2010).To reduce the impact of overlapping
spots in 3D, only a 2D cross section is used from the z-plane where the spot is detected. To filter out
spurious detections, all spots with a width >5 pixels are discarded.
mRNA-dendrite co-localization
To quantify calyx and dendritic localized smFISH puncta, the calyx and dendritic area were first seg-
mented manually. The contour of the calyx and dendritic area is converted to a mask (M1) using the
Mitchell et al. eLife 2021;10:e62770. DOI: https://doi.org/10.7554/eLife.62770 11 of 17Short report Neuroscience
MATLAB R2019b function roipoly. To quantify smFISH puncta co-localizing with dendrite label, a
mask of the dendrite label is created by enhancing the image using a difference of Gaussians filter
(width of 1 and 5 pixels) and then thresholding the product between the enhanced image (A) and
masked area (M1 ) to obtain a mask (M2):
M2 ¼ A M1 >meanðA M1 Þ þ stdðA M1 Þ
where mean() and std() are the sample mean and sample standard deviation of the image intensity
values, and A B is the Hadamard product between A and B. The sample standard deviation is calcu-
lated as
vffiffiffiffiffiffiffiffiffiffiffiffiffiffiffiffiffiffiffiffiffiffiffiffiffiffiffiffiffiffiffiffiffiffiffi
N
u
u 1 X
std ð xÞ ¼ t ðxi xÞ2
N 1 i¼1
where N is the number of data points. smFISH signal within g5b’2a MBON dendrites innervating the
g5 and b’2a MB compartments was analyzed. smFISH signal within the g1pedc>a/b dendrites inner-
vating the g1 MB compartment was analyzed. Sections of 10 0.2 mm individual z-slices of MB calyx,
g5b’2a MBON dendrites, or g1pedc>a/b MBON dendrites were analyzed. smFISH puncta overlap-
ping with the calyx or dendrite mask were considered co-localizing and therefore localized within
that neuronal compartment.
Spot brightness and full width half maximum (FWHM) analysis
For each detection, a region of interest (ROI) is extracted as a 2D box in the x–y plane with a size of
2(3sx,y+1). For each ROI, the MLE of the x and y position, the number of photons, the number of
background photons, and the width of the 2D Gaussian, sx,y, is computed. The FWHM of the spots
pffiffiffiffiffiffiffiffiffiffiffiffi
is calculated as FWHM ¼ 2 2lnð2Þ sx;y .
Verification of transcription foci
Soma containing bright nuclear transcription foci were selected to quantify the difference in intensity
relative to diffraction-limited smFISH puncta. The nuclear localization of the smFISH puncta with the
highest photon count was validated by visual inspection and considered to correspond to the tran-
scription site. The width (sx,y) of the transcription foci significantly differs from the sparse smFISH
signal and is estimated by fitting a 2D Gaussian to the transcription site using the MATLAB 2019b
nonlinear least-squares routine lsqcurvefit. Transcription foci brightness and background were com-
puted using the same MLE protocol as for diffraction-limited spots, but with the estimated sx,y.
YFP fluorescence intensity
To quantify YFP fluorescence intensity within co-labeled neurons, we developed a FIJI-compatible
macro plug-in. Depth-dependent bleaching was first corrected for over the z-stack using an expo-
nential fit. Background signal was then subtracted in each z-section using a rolling ball filter with a
width of 60 pixels. Five z-sections above and below the center of the image were cropped for analy-
sis. YFP fluorescence intensity was recorded within the dendrites or soma of the co-labeled neuron
using the mask described above (mRNA-dendrite co-localization). Fluorescence intensity was calcu-
lated as analog digital units (adu)/volume (dendrites or soma) to give adu/voxel. Software for analyz-
ing fluorescent protein expression in single neurons is available as Supplementary Software.
Statistical analyses
Data were visualized and analyzed statistically using GraphPad Prism version 8.3.1 (332). The distri-
bution of a dataset was assessed with a Shapiro–Wilk test. Gaussian distributed smFISH abundance
was compared between two groups using an unpaired t-test. Gaussian distributed smFISH abun-
dance between multiple groups was compared using a one-way ANOVA followed by Tukey’s post
hoc test. Non-Gaussian distributed smFISH abundance was compared between two groups using a
Mann–Whitney U test. Proportions of transcriptionally active soma were compared to transcription-
ally inactive soma using a chi-square test. YFP-positive and -negative smFISH intensity distributions
were compared with a two-sided Wilcoxon rank-sum test. YFP fluorescence intensity across
Mitchell et al. eLife 2021;10:e62770. DOI: https://doi.org/10.7554/eLife.62770 12 of 17Short report Neuroscience
treatments was compared using a one-way ANOVA for Gaussian distributed data and a Kruskal–
Wallis test for non-Gaussian distributed data. Statistical significance is defined as pShort report Neuroscience
Author ORCIDs
Nils Otto http://orcid.org/0000-0001-9713-4088
Pieter van Velde http://orcid.org/0000-0002-7281-8026
Ilan Davis http://orcid.org/0000-0002-5385-3053
Scott Waddell https://orcid.org/0000-0003-4503-6229
Decision letter and Author response
Decision letter https://doi.org/10.7554/eLife.62770.sa1
Author response https://doi.org/10.7554/eLife.62770.sa2
Additional files
Supplementary files
. Supplementary file 1. Oligonucleotide sequences of single-molecule fluorescence in
situ hybridization (smFISH) probe sets.
. Transparent reporting form
Data availability
Pipeline code and the User Manual are available in the GitHub repository at https://github.com/
qnano/smFISHlearning copy archived at https://archive.softwareheritage.org/swh:1:rev:
c73d1b977c767256982b40736f42b87d940caf05/. An example dataset of raw and processed images
is available at https://figshare.com/articles/dataset/Example_data/13568438. All other processed
and raw datasets that support the findings of this study are available at https://doi.org/10.6084/m9.
figshare.13573475.
The following datasets were generated:
Database and
Author(s) Year Dataset title Dataset URL Identifier
Mitchell J, Smith C, 2021 Data for figures of Selective https://doi.org/10.6084/ figshare, 10.6084/m9.
Titlow J, Otto N, dendritic localization of mRNA in m9.figshare.13573475 figshare.13573475
Velde P, Booth MJ, Drosophila Mushroom Body
Davis I, Waddell S Output Neurons
Velde P 2021 Example data for Dendritic https://figshare.com/arti- figshare, 10.6084/m9.
localization of mRNA in Drosophila cles/dataset/Example_ figshare.13568438
Mushroom Body Output Neurons data/13568438
References
Aakalu G, Smith WB, Nguyen N, Jiang C, Schuman EM. 2001. Dynamic visualization of local protein synthesis in
hippocampal neurons. Neuron 30:489–502. DOI: https://doi.org/10.1016/S0896-6273(01)00295-1, PMID: 113
95009
Akalal DB, Yu D, Davis RL. 2010. A late-phase, long-term memory trace forms in the g neurons of Drosophila
mushroom bodies after olfactory classical conditioning. Journal of Neuroscience 30:16699–16708. DOI: https://
doi.org/10.1523/JNEUROSCI.1882-10.2010, PMID: 21148009
Ashraf SI, McLoon AL, Sclarsic SM, Kunes S. 2006. Synaptic protein synthesis associated with memory is
regulated by the RISC pathway in Drosophila. Cell 124:191–205. DOI: https://doi.org/10.1016/j.cell.2005.12.
017, PMID: 16413491
Aso Y, Siwanowicz I, Bräcker L, Ito K, Kitamoto T, Tanimoto H. 2010. Specific dopaminergic neurons for the
formation of labile aversive memory. Current Biology 20:1445–1451. DOI: https://doi.org/10.1016/j.cub.2010.
06.048, PMID: 20637624
Aso Y, Hattori D, Yu Y, Johnston RM, Iyer NA, Ngo TT, Dionne H, Abbott LF, Axel R, Tanimoto H, Rubin GM.
2014. The neuronal architecture of the mushroom body provides a logic for associative learning. eLife 3:
e04577. DOI: https://doi.org/10.7554/eLife.04577, PMID: 25535793
Bagni C, Mannucci L, Dotti CG, Amaldi F. 2000. Chemical stimulation of synaptosomes modulates alpha -Ca2+/
calmodulin-dependent protein kinase II mRNA association to polysomes. The Journal of Neuroscience 20:
RC76–. PMID: 10783400
Barnstedt O, Owald D, Felsenberg J, Brain R, Moszynski JP, Talbot CB, Perrat PN, Waddell S. 2016. Memory-
Relevant mushroom body output synapses are cholinergic. Neuron 89:1237–1247. DOI: https://doi.org/10.
1016/j.neuron.2016.02.015, PMID: 26948892
Mitchell et al. eLife 2021;10:e62770. DOI: https://doi.org/10.7554/eLife.62770 14 of 17Short report Neuroscience
Bates AS, Manton JD, Jagannathan SR, Costa M, Schlegel P, Rohlfing T, Jefferis GS. 2020a. The Natverse, a
versatile toolbox for combining and analysing neuroanatomical data. eLife 9:e53350. DOI: https://doi.org/10.
7554/eLife.53350, PMID: 32286229
Bates AS, Schlegel P, Roberts RJV, Drummond N, Tamimi IFM, Turnbull R, Zhao X, Marin EC, Popovici PD,
Dhawan S, Jamasb A, Javier A, Serratosa Capdevila L, Li F, Rubin GM, Waddell S, Bock DD, Costa M, Jefferis
G. 2020b. Complete connectomic reconstruction of olfactory projection neurons in the fly brain. Current
Biology 30:3183–3199. DOI: https://doi.org/10.1016/j.cub.2020.06.042, PMID: 32619485
Boto T, Louis T, Jindachomthong K, Jalink K, Tomchik SM. 2014. Dopaminergic modulation of cAMP drives
nonlinear plasticity across the Drosophila mushroom body lobes. Current Biology 24:822–831. DOI: https://doi.
org/10.1016/j.cub.2014.03.021, PMID: 24684937
Bouzaiane E, Trannoy S, Scheunemann L, Plaçais P-Y, Preat T. 2015. Two Independent Mushroom Body Output
Circuits Retrieve the Six Discrete Components of Drosophila Aversive Memory. Cell Reports 11:1280–1292.
DOI: https://doi.org/10.1016/j.celrep.2015.04.044
Broughton SJ, Tully T, Greenspan RJ. 2003. Conditioning deficits of CaM-kinase transgenic Drosophila
melanogaster in a new excitatory courtship assay. Journal of Neurogenetics 17:91–102. DOI: https://doi.org/
10.1080/01677060390228342, PMID: 14504030
Burke CJ, Huetteroth W, Owald D, Perisse E, Krashes MJ, Das G, Gohl D, Silies M, Certel S, Waddell S. 2012.
Layered reward signalling through octopamine and dopamine in Drosophila. Nature 492:433–437. DOI: https://
doi.org/10.1038/nature11614, PMID: 23103875
Buxbaum AR, Wu B, Singer RH. 2014. Single b-actin mRNA detection in neurons reveals a mechanism for
regulating its translatability. Science 343:419–422. DOI: https://doi.org/10.1126/science.1242939, PMID: 2445
8642
Claridge-Chang A, Roorda RD, Vrontou E, Sjulson L, Li H, Hirsh J, Miesenböck G. 2009. Writing memories with
light-addressable reinforcement circuitry. Cell 139:405–415. DOI: https://doi.org/10.1016/j.cell.2009.08.034,
PMID: 19837039
Cohn R, Morantte I, Ruta V. 2015. Coordinated and Compartmentalized Neuromodulation Shapes Sensory
Processing in Drosophila. Cell 163:1742–1755. DOI: https://doi.org/10.1016/j.cell.2015.11.019
Felsenberg J, Jacob PF, Walker T, Barnstedt O, Edmondson-Stait AJ, Pleijzier MW, Otto N, Schlegel P, Sharifi N,
Perisse E, Smith CS, Lauritzen JS, Costa M, Jefferis G, Bock DD, Waddell S. 2018. Integration of parallel
opposing memories underlies memory extinction. Cell 175:709–722. DOI: https://doi.org/10.1016/j.cell.2018.
08.021, PMID: 30245010
Gaspar I, Wippich F, Ephrussi A. 2017. Enzymatic production of single-molecule FISH and RNA capture probes.
RNA 23:1582–1591. DOI: https://doi.org/10.1261/rna.061184.117, PMID: 28698239
Giese KP, Mizuno K. 2013. The roles of protein kinases in learning and memory. Learning & Memory 20:540–552.
DOI: https://doi.org/10.1101/lm.028449.112, PMID: 24042850
Griffith LC, Verselis LM, Aitken KM, Kyriacou CP, Danho W, Greenspan RJ. 1993. Inhibition of calcium/
calmodulin-dependent protein kinase in Drosophila disrupts behavioral plasticity. Neuron 10:501–509.
DOI: https://doi.org/10.1016/0896-6273(93)90337-Q, PMID: 8384859
Griffith LC, Wang J, Zhong Y, Wu CF, Greenspan RJ. 1994. Calcium/calmodulin-dependent protein kinase II and
potassium channel subunit eag similarly affect plasticity in Drosophila. PNAS 91:10044–10048. DOI: https://doi.
org/10.1073/pnas.91.21.10044, PMID: 7937834
Griffith LC. 1997. Drosophila melanogaster as a model system for the study of the function of calcium/
calmodulin-dependent protein kinase II in synaptic plasticity. Invertebrate Neuroscience 3:93–102. DOI: https://
doi.org/10.1007/BF02480364, PMID: 9783436
Grimm JB, English BP, Chen J, Slaughter JP, Zhang Z, Revyakin A, Patel R, Macklin JJ, Normanno D, Singer RH,
Lionnet T, Lavis LD. 2015. A general method to improve fluorophores for live-cell and single-molecule
microscopy. Nature Methods 12:244–250. DOI: https://doi.org/10.1038/nmeth.3256
Handler A, Graham TGW, Cohn R, Morantte I, Siliciano AF, Zeng J, Li Y, Ruta V. 2019. Distinct dopamine
receptor pathways underlie the temporal sensitivity of associative learning. Cell 178:60–75. DOI: https://doi.
org/10.1016/j.cell.2019.05.040, PMID: 31230716
Hige T, Aso Y, Modi MN, Rubin GM, Turner GC. 2015. Heterosynaptic plasticity underlies aversive olfactory
learning in Drosophila. Neuron 88:985–998. DOI: https://doi.org/10.1016/j.neuron.2015.11.003, PMID: 26637
800
Holt CE, Martin KC, Schuman EM. 2019. Local translation in neurons: visualization and function. Nature Structural
& Molecular Biology 26:557–566. DOI: https://doi.org/10.1038/s41594-019-0263-5, PMID: 31270476
Joiner MA, Griffith LC. 1997. CaM kinase II and visual input modulate memory formation in the neuronal circuit
controlling courtship conditioning. The Journal of Neuroscience 17:9384–9391. DOI: https://doi.org/10.1523/
JNEUROSCI.17-23-09384.1997, PMID: 9364084
Kim YC, Lee HG, Han KA. 2007. D1 dopamine receptor dDA1 is required in the mushroom body neurons for
aversive and appetitive learning in Drosophila. Journal of Neuroscience 27:7640–7647. DOI: https://doi.org/10.
1523/JNEUROSCI.1167-07.2007, PMID: 17634358
Kuklin EA, Alkins S, Bakthavachalu B, Genco MC, Sudhakaran I, Raghavan KV, Ramaswami M, Griffith LC. 2017.
The long 3’UTR mRNA of CaMKII Is Essential for Translation-Dependent Plasticity of Spontaneous Release in
Drosophila melanogaster. The Journal of Neuroscience 37:10554–10566. DOI: https://doi.org/10.1523/
JNEUROSCI.1313-17.2017, PMID: 28954869
Li F, Lindsey JW, Marin EC, Otto N, Dreher M, Dempsey G, Stark I, Bates AS, Pleijzier MW, Schlegel P, Nern A,
Takemura SY, Eckstein N, Yang T, Francis A, Braun A, Parekh R, Costa M, Scheffer LK, Aso Y, et al. 2020. The
Mitchell et al. eLife 2021;10:e62770. DOI: https://doi.org/10.7554/eLife.62770 15 of 17Short report Neuroscience
connectome of the adult Drosophila mushroom body provides insights into function. eLife 9:e62576.
DOI: https://doi.org/10.7554/eLife.62576, PMID: 33315010
Lin S, Owald D, Chandra V, Talbot C, Huetteroth W, Waddell S. 2014. Neural correlates of water reward in thirsty
Drosophila. Nature Neuroscience 17:1536–1542. DOI: https://doi.org/10.1038/nn.3827, PMID: 25262493
Liu C, Plaçais PY, Yamagata N, Pfeiffer BD, Aso Y, Friedrich AB, Siwanowicz I, Rubin GM, Preat T, Tanimoto H.
2012. A subset of dopamine neurons signals reward for odour memory in Drosophila. Nature 488:512–516.
DOI: https://doi.org/10.1038/nature11304, PMID: 22810589
Long X, Colonell J, Wong AM, Singer RH, Lionnet T. 2017. Quantitative mRNA imaging throughout the entire
Drosophila brain. Nature Methods 14:703–706. DOI: https://doi.org/10.1038/nmeth.4309
Lowe N, Rees JS, Roote J, Ryder E, Armean IM, Johnson G, Drummond E, Spriggs H, Drummond J, Magbanua
JP, Naylor H, Sanson B, Bastock R, Huelsmann S, Trovisco V, Landgraf M, Knowles-Barley S, Armstrong JD,
White-Cooper H, Hansen C, et al. 2014. Analysis of the expression patterns, subcellular localisations and
interaction partners of Drosophila proteins using a pigP protein trap library. Development 141:3994–4005.
DOI: https://doi.org/10.1242/dev.111054, PMID: 25294943
Malik BR, Gillespie JM, Hodge JJ. 2013. CASK and CaMKII function in the mushroom body a’/b’ neurons during
Drosophila memory formation. Frontiers in Neural Circuits 7:1–16. DOI: https://doi.org/10.3389/fncir.2013.
00052, PMID: 23543616
Matsuda A, Schermelleh L, Hirano Y, Haraguchi T, Hiraoka Y. 2018. Accurate and fiducial-marker-free correction
for three-dimensional chromatic shift in biological fluorescence microscopy. Scientific Reports 8:1–14.
DOI: https://doi.org/10.1038/s41598-018-25922-7
Mayford M, Baranes D, Podsypanina K, Kandel ER. 1996. The 3’-untranslated region of CaMKII alpha is a cis-
acting signal for the localization and translation of mRNA in dendrites. PNAS 93:13250–13255. DOI: https://
doi.org/10.1073/pnas.93.23.13250, PMID: 8917577
Miller S, Yasuda M, Coats JK, Jones Y, Martone ME, Mayford M. 2002. Disruption of dendritic translation of
CaMKIIalpha impairs stabilization of synaptic plasticity and memory consolidation. Neuron 36:507–519.
DOI: https://doi.org/10.1016/S0896-6273(02)00978-9, PMID: 12408852
Mitchell J. 2021. smFISHlearning. Software Heritage. swh:1:rev:c73d1b977c767256982b40736f42b87d940caf05.
https://archive.softwareheritage.org/swh:1:dir:7ffedd35a927474c8d7c86ca74ecc1c9a720353c;origin=https://
github.com/qnano/smFISHlearning;visit=swh:1:snp:f47eb251b0507d25b676395ada5a075c08a40cda;anchor=swh:
1:rev:c73d1b977c767256982b40736f42b87d940caf05/
Ouyang Y, Rosenstein A, Kreiman G, Schuman EM, Kennedy MB. 1999. Tetanic stimulation leads to increased
accumulation of Ca(2+)/calmodulin-dependent protein kinase II via dendritic protein synthesis in hippocampal
neurons. The Journal of Neuroscience 19:7823–7833. DOI: https://doi.org/10.1523/JNEUROSCI.19-18-07823.
1999, PMID: 10479685
Owald D, Felsenberg J, Talbot CB, Das G, Perisse E, Huetteroth W, Waddell S. 2015. Activity of defined
mushroom body output neurons underlies learned olfactory behavior in Drosophila. Neuron 86:417–427.
DOI: https://doi.org/10.1016/j.neuron.2015.03.025, PMID: 25864636
Perisse E, Owald D, Barnstedt O, Talbot CB, Huetteroth W, Waddell S. 2016. Aversive learning and appetitive
motivation toggle Feed-Forward inhibition in the Drosophila Mushroom Body. Neuron 90:1086–1099.
DOI: https://doi.org/10.1016/j.neuron.2016.04.034, PMID: 27210550
Qin H, Cressy M, Li W, Coravos JS, Izzi SA, Dubnau J. 2012. Gamma neurons mediate dopaminergic input during
aversive olfactory memory formation in Drosophila. Current Biology 22:608–614. DOI: https://doi.org/10.1016/
j.cub.2012.02.014, PMID: 22425153
Rook MS, Lu M, Kosik KS. 2000. CaMKIIalpha 3’ untranslated region-directed mRNA translocation in living
neurons: visualization by GFP linkage. The Journal of Neuroscience 20:6385–6393. DOI: https://doi.org/10.
1523/JNEUROSCI.20-17-06385.2000, PMID: 10964944
Scheffer LK, Xu CS, Januszewski M, Lu Z, Takemura SY, Hayworth KJ, Huang GB, Shinomiya K, Maitlin-Shepard
J, Berg S, Clements J, Hubbard PM, Katz WT, Umayam L, Zhao T, Ackerman D, Blakely T, Bogovic J, Dolafi T,
Kainmueller D, et al. 2020. A connectome and analysis of the adult Drosophila central brain. eLife 9:e57443.
DOI: https://doi.org/10.7554/eLife.57443, PMID: 32880371
Schindelin J, Arganda-Carreras I, Frise E, Kaynig V, Longair M, Pietzsch T, Preibisch S, Rueden C, Saalfeld S,
Schmid B, Tinevez JY, White DJ, Hartenstein V, Eliceiri K, Tomancak P, Cardona A. 2012. Fiji: an open-source
platform for biological-image analysis. Nature Methods 9:676–682. DOI: https://doi.org/10.1038/nmeth.2019,
PMID: 22743772
Séjourné J, Plaçais PY, Aso Y, Siwanowicz I, Trannoy S, Thoma V, Tedjakumala SR, Rubin GM, Tchénio P, Ito K,
Isabel G, Tanimoto H, Preat T. 2011. Mushroom body efferent neurons responsible for aversive olfactory
memory retrieval in Drosophila. Nature Neuroscience 14:903–910. DOI: https://doi.org/10.1038/nn.2846,
PMID: 21685917
Smith CS, Joseph N, Rieger B, Lidke KA. 2010. Fast, single-molecule localization that achieves theoretically
minimum uncertainty. Nature Methods 7:373–375. DOI: https://doi.org/10.1038/nmeth.1449, PMID: 20364146
Smith CS, Preibisch S, Joseph A, Abrahamsson S, Rieger B, Myers E, Singer RH, Grunwald D. 2015. Nuclear
accessibility of b-actin mRNA is measured by 3D single-molecule real-time tracking. Journal of Cell Biology
209:609–619. DOI: https://doi.org/10.1083/jcb.201411032
Tomchik SM, Davis RL. 2009. Dynamics of learning-related cAMP signaling and stimulus integration in the
Drosophila olfactory pathway. Neuron 64:510–521. DOI: https://doi.org/10.1016/j.neuron.2009.09.029,
PMID: 19945393
Mitchell et al. eLife 2021;10:e62770. DOI: https://doi.org/10.7554/eLife.62770 16 of 17Short report Neuroscience
Tully T, Quinn WG. 1985. Classical conditioning and retention in normal and mutant Drosophila melanogaster.
Journal of Comparative Physiology A 157:263–277. DOI: https://doi.org/10.1007/BF01350033
Yang L, Titlow J, Ennis D, Smith C, Mitchell J, Young FL, Waddell S, Ish-Horowicz D, Davis I. 2017. Single
molecule fluorescence in situ hybridisation for quantitating post-transcriptional regulation in Drosophila brains.
Methods 126:166–176. DOI: https://doi.org/10.1016/j.ymeth.2017.06.025, PMID: 28651965
Yu D, Akalal DB, Davis RL. 2006. Drosophila alpha/beta mushroom body neurons form a branch-specific, long-
term cellular memory trace after spaced olfactory conditioning. Neuron 52:845–855. DOI: https://doi.org/10.
1016/j.neuron.2006.10.030, PMID: 17145505
Zalcman G, Federman N, Romano A. 2018. CaMKII isoforms in learning and memory: localization and function.
Frontiers in Molecular Neuroscience 11:1–14. DOI: https://doi.org/10.3389/fnmol.2018.00445, PMID: 30564099
Zhang S, Roman G. 2013. Presynaptic inhibition of gamma lobe neurons is required for olfactory learning in
Drosophila. Current Biology 23:2519–2527. DOI: https://doi.org/10.1016/j.cub.2013.10.043, PMID: 24291093
Mitchell et al. eLife 2021;10:e62770. DOI: https://doi.org/10.7554/eLife.62770 17 of 17You can also read


