Ground-penetrating radar imaging reveals glacier's drainage network in 3D
←
→
Page content transcription
If your browser does not render page correctly, please read the page content below
The Cryosphere, 15, 3975–3988, 2021
https://doi.org/10.5194/tc-15-3975-2021
© Author(s) 2021. This work is distributed under
the Creative Commons Attribution 4.0 License.

Ground-penetrating radar imaging reveals
glacier’s drainage network in 3D
Gregory Church1,2 , Andreas Bauder1 , Melchior Grab1,2 , and Hansruedi Maurer2
1 Laboratory     of Hydraulics, Hydrology and Glaciology (VAW), ETH Zurich, Zurich, Switzerland
2 Institute   of Geophysics, ETH Zurich, Zurich, Switzerland

Correspondence: Gregory Church (church@vaw.baug.ethz.ch)

Received: 8 March 2021 – Discussion started: 14 April 2021
Revised: 26 July 2021 – Accepted: 27 July 2021 – Published: 23 August 2021

Abstract. Hydrological systems of glaciers have a direct im-      ments (Schoof, 2010) or lubricating the hard bedrock. In
pact on the glacier dynamics. Since the 1950s, geophysical        alpine glaciers and in Greenland, the subglacial drainage net-
studies have provided insights into these hydrological sys-       work is fed from surface meltwater that is routed through
tems. Unfortunately, such studies were predominantly con-         the englacial drainage network (Fountain and Walder, 1998).
ducted using 2D acquisitions along a few profiles, thus fail-     At the beginning of the melt season and with an increased
ing to provide spatially unaliased 3D images of englacial and     availability of surface meltwater, the subglacial drainage net-
subglacial water pathways. The latter has likely resulted in      work often experiences an increase in water pressure, since
flawed constraints for the hydrological modelling of glacier      the drainage network cannot adapt quickly enough to the in-
drainage networks. Here, we present 3D ground-penetrating         crease in meltwater influx (Iken et al., 1983). During these
radar (GPR) results that provide high-resolution 3D im-           periods with increased subglacial water pressure, changes in
ages of an alpine glacier’s drainage network. Our results         the glacier’s sliding velocity are often observed (Gudmunds-
confirm a long-standing englacial hydrology theory stating        son et al., 2000; Sugiyama and Gudmundsson, 2004; Mac-
that englacial conduits flow around glacial overdeepenings        gregor et al., 2005), and it has been widely documented that
rather than directly over the overdeepening. Furthermore,         increased glacier sliding velocities have the potential to in-
these results also show exciting new opportunities for high-      crease the glacier’s mass loss (Zwally et al., 2002; Joughin
resolution 3D GPR studies of glaciers.                            et al., 2008; Schoof, 2010). Whilst the existence of these vari-
                                                                  ations in ice flow velocities are undisputed, there are limited
                                                                  observations of the hydrological system’s geometry and its
                                                                  temporal variations, thus hampering a deeper understanding
1   Introduction                                                  of these seasonal variations (Hart et al., 2015; Church et al.,
                                                                  2020).
Glacier movement is the combination of internal ice defor-           The glacier’s hydrological system can be probed using
mation and basal motion. Basal motion comprises both ice          a variety of methods. Direct observations have been made
sliding over the glacier bed and the deformation of subglacial    from boreholes (Fountain et al., 2005), tracer testing (Nienow
till (Cuffey and Paterson, 2010). Sliding at the ice–bed inter-   et al., 1996), speleology (Gulley, 2009; Gulley et al., 2009;
face is responsible for high ice flow velocities (often 100 %–    Temminghoff et al., 2019), and geophysical measurements.
400 % faster than the annual mean flow velocity, Macgre-          The latter include predominantly active (Peters et al., 2008;
gor et al., 2005; Bingham et al., 2006; Bartholomew et al.,       Zechmann et al., 2018; Church et al., 2019) and passive
2010; Tuckett et al., 2019) as a result of reduced friction at    (Podolskiy and Walter, 2016; Lindner et al., 2020; Nanni
the ice–bed interface (Bartholomaus et al., 2008). This re-       et al., 2020) seismic measurements or ground-penetrating
duction of friction is caused by the subglacial drainage net-     radar (GPR) measurements (Moorman and Michel, 2000;
work that lubricates this interface and increases subglacial      Stuart et al., 2003; Irvine-Fynn et al., 2006; Harper et al.,
water pressure, thereby either weakening subglacial sedi-

Published by Copernicus Publications on behalf of the European Geosciences Union.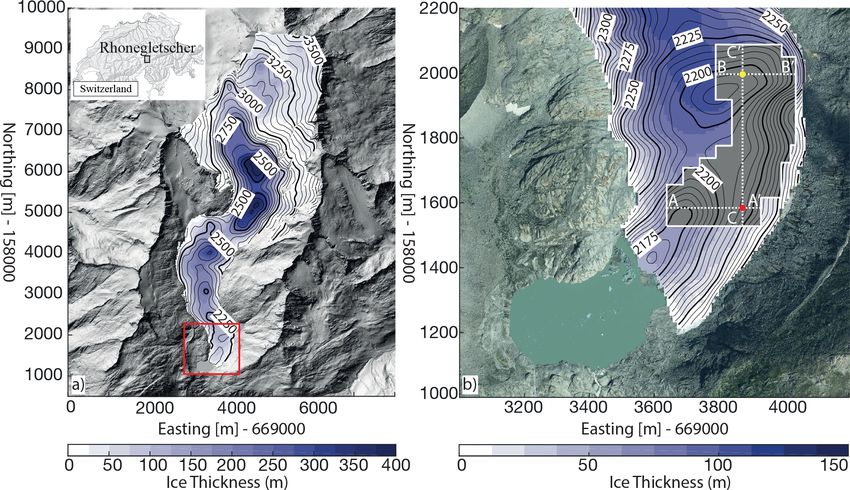
3976                        G. Church et al.: Ground-penetrating radar imaging reveals glacier’s drainage network in 3D

2010; Bælum and Benn, 2011; Hansen et al., 2020). Most              the riegel that produces the overdeepening. This hypothesis
glaciological GPR studies published so far relied on two-           has a direct consequence on glacier sliding theory as no sub-
dimensional (2D) data, where GPR measurements were ac-              glacial waterways should exist in the overdeepening, thereby
quired along profiles. The 2D data sets are typically un-           potentially altering the glacier’s sliding velocity.
able to image complex subsurface structures, such as glacier           In this study there are three main objectives, namely to
drainage networks, and the resulting interpretations may thus
be inconclusive. For small-scale targets, such as archaeol-             – demonstrate the feasibility of and opportunities offered
ogy sites (Böniger and Tronicke, 2010) and shallow fault                  by 3D GPR imaging on glaciers,
zones (McClymont et al., 2008), 3D GPR surveys have es-                 – provide much needed hydrological observations to de-
tablished themselves as a powerful and efficient tool to image            termine whether they are in agreement with long-
complex subsurface structures. Moreover, 3D radar surveys                 standing glacier hydraulic theory regarding englacial
have also been leveraged in large-scale applications to inves-            water pathways around overdeepenings as described by
tigate extraterrestrial ice bodies (Putzig et al., 2018). Three-          Lliboutry (1983),
dimensional GPR surveys are composed of densely spaced
multiple line-by-line 2D GPR profiles that are collectively             – provide an insight into future opportunities for high-
processed and are able to avoid both sampling bias in the                 resolution radar studies of glaciers.
profile’s inline direction and aliasing in the cross-line direc-
tion. Spatially unaliased 3D GPR data sets (i.e. data sets with
a data point spacing smaller than the dominant wavelength           2    Survey site and previous work
of the GPR signals, Sheriff and Geldart, 1995; Grasmueck
                                                                    The 3D GPR acquisition was conducted on Rhonegletscher, a
et al., 2005) are rare in glaciological applications. This is un-
                                                                    temperate glacier located in the central Swiss Alps (Fig. 1a).
fortunate because 3D GPR provides subsurface images that
                                                                    The Rhonegletscher is representative for the majority of Eu-
can be viewed from arbitrary directions, thus allowing for an
                                                                    ropean mountain glaciers with regard to its temperature dis-
unequivocal interpretation. Furthermore, 3D GPR glaciolog-
                                                                    tribution, ice dynamics, and size (GLAMOS, 2017; Beniston
ical surveys can provide high spatial resolution imaging of
                                                                    et al., 2018). Rhonegletscher is the sixth largest glacier in
the glacier’s drainage network. Such an approach would be
                                                                    the Swiss Alps (length: 8 km; surface area: 15.5 km2 , as of
particularly useful for glacier drainage networks and should
                                                                    2015 (GLAMOS, 2017)) and is heavily exposed to glacier
be feasible because of the strong reflections caused by the
                                                                    melt due to the changing climate. Over the last few decades,
very pronounced electrical impedance contrasts at ice–water
                                                                    the glacier has continued to thin, and it is currently retreat-
interfaces (Reynolds, 1997).
                                                                    ing. As a result, a proglacial lake fed by the drainage network
   To date, there are only a small number of glaciologi-
                                                                    has been forming at its terminus since 2005 (Tsutaki et al.,
cal studies leveraging 3D GPR to gain insights into the
                                                                    2013).
glacier’s hydraulic system. A 3D GPR data set was used
                                                                        The 3D GPR survey was motivated by the results of ear-
by Harper et al. (2010) to investigate basal crevasses and
                                                                    lier 2D geophysical surveys. In 2017, a strong englacial re-
the subglacial hydraulic network on Bench Glacier, Alaska.
                                                                    flection was identified from both active 2D seismic data and
More recently, Egli et al. (2021) acquired and processed 3D
                                                                    2D GPR measurements, and reflection analysis resulted in a
GPR surveys over two Swiss glaciers and successfully im-
                                                                    water-filled englacial conduit being identified (Church et al.,
aged the subglacial drainage network with the analysis of
                                                                    2019). In the 2018 melt season a borehole was drilled into the
the reflected GPR amplitudes. Several glaciological studies
                                                                    englacial conduit and a borehole camera observed a water-
(Schaap et al., 2019; Hansen et al., 2020; Church et al.,
                                                                    filled and actively flowing hydraulic network. During 2018
2020) have used multiple 2D GPR profiles to investigate the
                                                                    and 2019, repeated GPR measurements on a coarse grid of
englacial drainage structure in both cold and temperate ice;
                                                                    2D lines (Church et al., 2020) provided initial imaging of
however, as far as we are aware, there are no studies leverag-
                                                                    a potential drainage network and its seasonal changes. The
ing 3D GPR in order to image an englacial drainage network.
                                                                    repeated measurements provided evidence that the englacial
   The direction that meltwater flows under and within a
                                                                    conduit was 0.4 m ± 0.35 m thick and 17.5 m ± 8.5 m wide
glacier is driven by the spatial gradient of the hydraulic po-
                                                                    and highlighted seasonal variations of an actively flowing
tential, outlined by Shreve (1972), where the hydraulic gra-
                                                                    englacial conduit. However, the surveys failed to image the
dient is a function of both the water pressure gradient and
                                                                    larger extent of the drainage network and determine whether
the elevation potential gradient. Subglacial water flows along
                                                                    it connects to a subglacial hydraulic network. Additionally, it
the hydraulic gradient, and upon meeting an overdeepening,
                                                                    had limited spatial resolution due to the 2D nature of the GPR
Lliboutry (1983) hypothesized that the water flows along
                                                                    data. The englacial network is located within an overdeepen-
the glacier’s flank as so-called gradient conduits, therefore
                                                                    ing and therefore provides a suitable candidate to determine
avoiding the deepest part of the overdeepening (Cook and
                                                                    whether the network is in agreement with current hydraulic
Swift, 2012). According to Lliboutry’s theory, these conduits
                                                                    theory.
should be located at the same altitude as the lowest point of

The Cryosphere, 15, 3975–3988, 2021                                                     https://doi.org/10.5194/tc-15-3975-2021
G. Church et al.: Ground-penetrating radar imaging reveals glacier’s drainage network in 3D                                         3977

Figure 1. (a) Rhonegletscher ice thickness in 2019 (colours) and bedrock elevation (contours) estimated using the GlaTe model from 59
interpolated radar profiles acquired between 2003 and 2008 as described by Grab et al. (2021). The red box represents the zoomed area for
panel (b). (b) Lower ablation zone of Rhonegletscher showing ice thickness (colour) and bedrock elevation (contours). The grey polygon
represents the 3D GPR survey sites; three GPR profiles, i.e. A–A’, B–B’, and C–C’, are shown in Fig. 2; and the crossing points of the GPR
profiles are represented by yellow and red dots. Co-ordinates for all plots are local Swiss co-ordinates LV03. Orthophoto was provided by
Swiss Federal Office of The topology is reproduced by permission of swisstopo (JA100120), © 2020 swisstopo (JD100042).

3     Methods                                                          receiving antennas every second. The average accuracy of the
                                                                       GNSS during GPR acquisition was 0.008 m.
3.1    Data acquisition                                                   The survey area was covered with 281 2D GPR profiles,
                                                                       resulting in a total profile length of approximately 85 km. The
To detect and characterize the drainage network located at             GPR data for our 3D processing workflow were collected
the glacier’s tongue, we acquired a high-resolution 25 MHz             perpendicular to the ice flow direction with 2 m interspacing
3D GPR survey. Between 15 and 23 July 2020, GPR data                   between 2D GPR profiles. The line spacing was chosen such
were acquired over the area expected to harbour the englacial          that the diffractions and reflections within the ice body would
conduit network (Fig. 1b).                                             not become aliased for our antenna frequency of 25 MHz. To
   The survey covered an area of 140 000 m2 , within which             ensure data were consistent across the duration of the sur-
the ice thickness varied between 25 and 110 m and where                vey, two GPR lines were always repeated from the previous
the glacier bed forms a distinct overdeepening (Fig. 1b).              day’s acquisition. Furthermore, six orthogonal profiles were
The common-offset GPR data were collected using a Sen-                 collected along the glacier flow for quality control purposes.
sor & Software PulseEkko® system with an antenna separa-
tion of 4 m and carried by hand at approximately 1 m above             3.2   Data processing
the glacier ice surface. The sampling rate of the GPR sys-
tem was 1 GHz, giving a time resolution of 1 ns. The use               All GPR common offset data were processed using a com-
of a large sampling frequency allows small topographical               bination of an in-house MATLAB-based toolbox (GPRglaz)
changes from trace to trace of < 0.2 m to be observed (King,           (Grab et al., 2018) and SeisSpace ProMAX 3-D. The pro-
2020). A GPR stacking of 4 improved the signal-to-noise ra-            cessing was based upon a typical 3D seismic data processing
tio and allowed the GPR data to be acquired with an aver-              workflow. Initially, the GPR data were assigned to their cor-
age walking speed of approximately 0.4 m per GPR trace.                responding GNSS data. Since the GNSS data were recorded
For all GPR lines, a high-precision global navigation satel-           every second and GPR data were recorded approximately ev-
lite system (GNSS) continuously recorded the x, y, and z               ery 0.3 s, the GNSS data were linearly interpolated to provide
coordinates of the centre point between the transmitting and           the same temporal resolution as the GPR data. The data were

https://doi.org/10.5194/tc-15-3975-2021                                                       The Cryosphere, 15, 3975–3988, 2021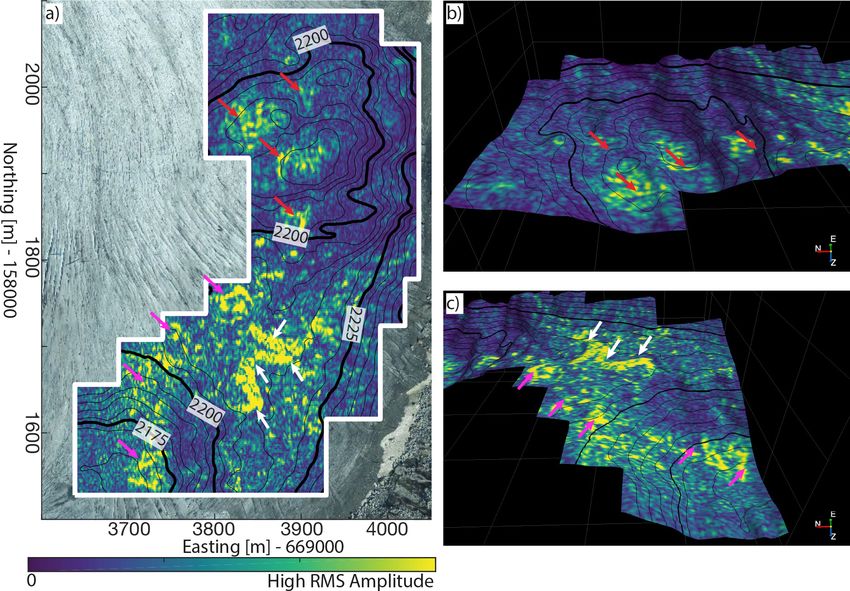
3978 G. Church et al.: Ground-penetrating radar imaging reveals glacier’s drainage network in 3D
then corrected for time zero, and a Butterworth bandpass fil- nally, the reflected GPR amplitudes were extracted from both
ter was applied in order to suppress any noise outside the the ice–bed interface and the drainage network by using a 2 m
GPR frequency band and thus to increase the signal-to-noise window (±1 m) centred around the feature. During interpre-
ratio. Overlapping GPR data between different acquisition tation, care was taken along the edges of the survey as a result
days were used to investigate whether a data matching filter of GPR data migration edge effects.
was required. However, no amplitude matching was required,
due to the fact that the GPR equipment used produced stable
and repeatable GPR data. Subsequently, the data were 3D 4 Results
binned using a master grid of 2 m between GPR profiles (in-
4.1 Overview of GPR results
line spacing) and 0.5 m between GPR data points within the
profile (crossline spacing). The 3D binning consists of as- Displaying 3D models adequately is generally a non-trivial
signing each GPR trace to the closest bin centre. As a result task. Below, we discuss the GPR results using a variety of
of the variable walking speed and walking around crevasses vertical and horizontal cross sections. In our view, such data
during acquisition, a number of bins had more than a single sets are represented best in the form of movies showing scans
GPR trace assigned (known as over-fold), whereas other bins along different directions. We therefore highly encourage the
(i.e. a bin located within a crevasse) were empty. GPR data readers to check the Video Supplement.
points were removed from bins that had more than one GPR Selected 2D profiles of the 3D GPR data cube are shown
data point, and this therefore resulted in the bins containing in Fig. 2. A water-filled englacial conduit can be identified
either a single GPR data point or no GPR data point. Such a as a continuous specular strong reflector (Fig. 2). The major-
processing step is required in order not to leave an amplitude ity of the ice–bed interface is identifiable as a weak reflec-
imprint on the data during the GPR interpolation stage. The tion (Fig. 2), indicating that subglacial water is not present.
resulting single-fold GPR data were interpolated such that However, in isolated areas, the ice–bed interface has been
all bins were filled and the GPR data were positioned at the identified via strong ice–bed reflections (Fig. 2c), thereby in-
centre of their bins. dicating the presence of subglacial water.
A 3D Kirchhoff migration algorithm re-positioned the re- The lateral extent of the englacial and subglacial network
flected and diffracted signals to their correct subsurface loca- can be characterized by analysing horizontal slices of the 3D
tion. The Kirchhoff migration algorithm was performed us- GPR data cube at different elevations above mean sea level.
ing an EM wave propagation velocity of ice (0.167 m ns−1 ) A slice at 2216 m a.s.l. shows a strong meandering reflection
as velocities between 0.165 and 0.170 m ns−1 were con- in the northern part of the survey (Fig. 3a). The strong re-
firmed for this site by Church et al. (2020). Furthermore, the flection is traceable on the eastern edge of the survey be-
migration algorithm corrected for amplitude losses from ge- fore fading out towards the southern edge. At 2213 m a.s.l.
ometrical spreading, whereas no correction for radiation pat- (Fig. 3b), there is a continuation of the strong reflection, but it
tern was applied. Prior to interpretation, a topographic cor- becomes more diffusive in the central part of the survey area.
rection, an amplitude correction using a Q attenuation com- At 2210 m a.s.l. (Fig. 3c), we observe another strong mean-
pensation (Irving and Knight, 2003), and a second Butter- dering reflection that heads southwards towards the terminus
worth bandpass filter were applied to further improve the of the glacier. There is an approximately 6 m topographic dif-
signal-to-noise ratio and to suppress the high frequency noise ference between the drainage network in the survey’s north-
artificially increased by the Q compensation correction. Fi- ern edge and the southern edge, indicating that the imaged
nally, the data were converted from the time to depth domain drainage network has a shallow global inclination along the
using a constant velocity of 0.167 m ns−1 . flow (< 1◦ ).
The 3D interpretation was performed in dGB Earth
Sciences OpendTect. The ice–bed interface was manually 4.2 Spatial distribution of drainage network
picked, linearly interpolated, smoothed, and constrained to
within the survey area. Secondly, the drainage network was The 3D GPR survey imaged an active meltwater drainage
located from the 3D processed GPR data as the strongest network within the survey boundary. It comprises both an
continuous coherent reflection and manually picked with englacial and subglacial drainage network. The entire de-
aid of previous GPR, seismic, and borehole studies (Church tectable drainage network was identified from the final pro-
et al., 2019, 2020). Subsequently, the drainage network was cessed GPR data, and reflected amplitudes from the drainage
linearly interpolated and smoothed. In order to ensure the network were extracted (Fig. 4a) as detailed in the data pro-
picked drainage network encompassed the entire observable cessing section. The conduit network can be delineated by
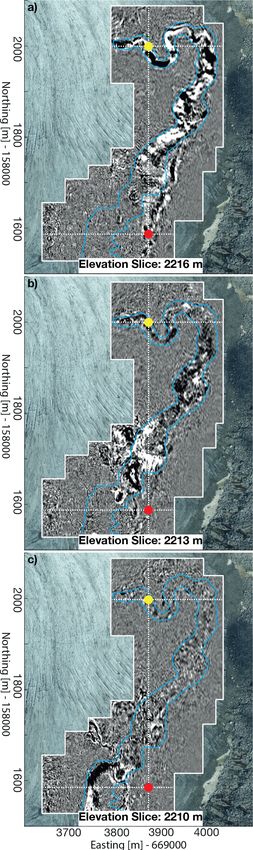
drainage network in the GPR survey area, GPR elevation areas of high amplitude (yellow in Fig. 4a). Furthermore, the
slices were investigated to locate strong englacial and sub- drainage network can be split into four separate components
glacial reflections that could represent a water-filled drainage labelled in Fig. 4b:
network (Fig. 3) and the root-mean-squared amplitude was
extracted between the surface and the ice–bed interface. Fi-
The Cryosphere, 15, 3975–3988, 2021 https://doi.org/10.5194/tc-15-3975-2021
G. Church et al.: Ground-penetrating radar imaging reveals glacier’s drainage network in 3D                                                 3979

Figure 2. (a) GPR inline profile (perpendicular to ice flow direction): the glacier surface, drainage network, and basal interface are marked,
and the red line represents the crossing point for profile (c). (b) GPR inline profile (perpendicular to ice flow direction): the yellow line
represents the crossing point for profile (c). (c) GPR crossline profile (parallel to ice flow direction). The locations of the profiles are shown
in Figs. 1b and 3.

Component A. a meandering well-defined englacial con-                         Given the glacier ice flow direction (N–S) and the ice
   duit spanning the overdeepening oriented perpendicular                  thickness distribution, the water in the conduit is expected
   to the glacier flow,                                                    to flow from north to south. The high-resolution results al-
                                                                           low the width of the drainage network to be examined, and
Component B. an englacial conduit oriented parallel to the                 the uncertainty is attributed to the post-migration lateral res-
   glacier flow traversing the overdeepening and flows                     olution. The mean width of the northern sinusoidal englacial
   alongside the glacier’s flank,                                          conduit, which flows across the overdeepening (Fig. 4b,
Component C. a subglacial drainage network that consists                   Component A), is 8 ± 1.7 m. As the network flows south-
   of a single main conduit (Fig. 4a) of a sinusoidal nature               wards around the overdeepening (Fig. 4b, Component B), the
   connected to the up-glacier englacial conduit in B,                     width increases to 11 ± 1.7 m. Furthermore, the mean width
                                                                           of the subglacial drainage conduit (Fig. 4b, Component C)
Component D. a diffusive network of englacial conduits to-                 is 17 ± 1.7 m, and finally at the southern edge of the survey
   wards the terminus of the glacier located that are poorly               site the mean width of the diffusive englacial drainage net-
   imaged.                                                                 work is 25 ± 1.7 m (Fig. 4b, Component D). The thickness of

https://doi.org/10.5194/tc-15-3975-2021                                                            The Cryosphere, 15, 3975–3988, 2021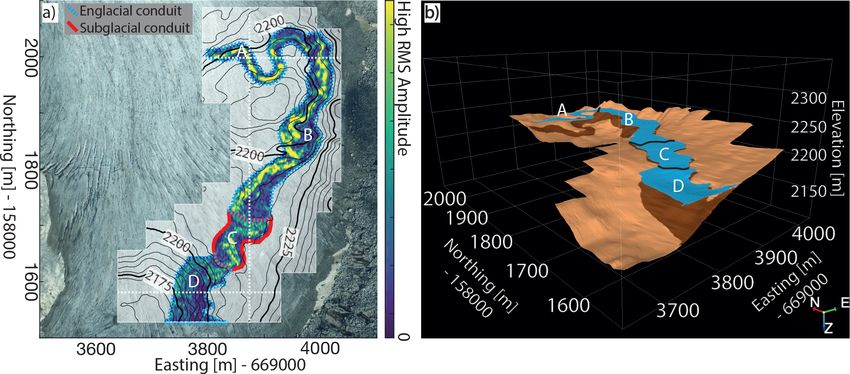
3980                         G. Church et al.: Ground-penetrating radar imaging reveals glacier’s drainage network in 3D

                                                                        the conduit in Section A has previously been investigated in
                                                                        Church et al. (2020), and it was found to be at the limit of the
                                                                        25 MHz GPR vertical resolution at 0.4 m, when assuming the
                                                                        conduit is water filled. The conduit thickness in Sections B,
                                                                        C, and D is also at the limit of the vertical resolution, as only
                                                                        a single reflection is visible (Fig. 2c). If the conduit thickness
                                                                        was beyond the vertical resolution, two separate englacial re-
                                                                        flections would be visible, representing the top and bottom of
                                                                        the conduit. Consequently, the channels throughout the study
                                                                        area are thinner than 0.4 m, and therefore their shape is sig-
                                                                        nificantly smaller in the vertical direction than the lateral di-
                                                                        rection.

                                                                        4.3   Basal reflected amplitude

                                                                        The amplitude of the ice–bed interface was also extracted.
                                                                        This provided insights into the basal conditions, such as
                                                                        bedrock type and whether subglacial water is present. In the
                                                                        southern region of the survey site, the ice–bed interface re-
                                                                        flection has an identical amplitude and spatial distribution to
                                                                        the drainage network (Fig. 5a and c, white arrows), thereby
                                                                        indicating that this area is identical to the drainage network
                                                                        identified in Fig. 4a. In the northern region of the survey site,
                                                                        there are numerous isolated high-amplitude basal reflections
                                                                        (Fig. 5a), mostly situated within localized flat areas (Fig. 5b
                                                                        red arrows) and most likely indicating a pooling of water. In
                                                                        addition, ubiquitous areas of high-amplitude basal reflections
                                                                        are present along the southern region of the survey that could
                                                                        indicate the presence of subglacial water (Fig. 5a and c pink
                                                                        arrows). In comparison to the isolated patches in the north-
                                                                        ern region, these high-amplitude basal patches in the south-
                                                                        ern region appear to be partially connected to each other, in-
                                                                        dicating the possibility of an additional subglacial drainage
                                                                        system away from the main drainage network. These areas
                                                                        were not picked as part of the main drainage network due to
                                                                        their different data characteristics (not being connected to the
                                                                        main drainage network; white arrows in Fig. 5).

                                                                        4.4   Comparison of 2D and 3D GPR processing

                                                                        Using 2D GPR surveys along single profiles is the current ap-
                                                                        proach in glaciological applications, although such data sets
                                                                        have imaging limitations. Besides being unable to provide
                                                                        high-resolution 3D subsurface images, 2D GPR techniques
                                                                        assume that all reflections originate from the vertical plane
Figure 3. (a) Depth slice through the GPR 3D data cube at
                                                                        of the acquisition. Complex englacial structure or basal ge-
2216 m a.s.l., (b) 2213 m a.s.l., and (c) 2210 m a.s.l. The blue line   ometry can result in a reflection originating from outside of
represents the outline of the drainage network. The dashed white        the acquisition plane, in turn resulting in distortions in the
line represents the GPR profiles from Fig. 2 and the red and yel-       final processed GPR image. Figure 6 shows an example ray
low dots represent their crossing points. Orthophoto was provided       path causing such a distortion as a result of off-nadir reflec-
by Swiss Federal Office of Topology. Reproduced by permission of        tions. These distortions are particularly severe for complex
swisstopo (JA100120), © 2020 swisstopo (JD100042).                      geometry of alpine glaciers, and even with the use of densely
                                                                        spaced 2D GPR lines that are processed independently with a
                                                                        2D migration, these features will not be correctly positioned.
                                                                        Recent studies have experimented with acquiring swaths of

The Cryosphere, 15, 3975–3988, 2021                                                         https://doi.org/10.5194/tc-15-3975-2021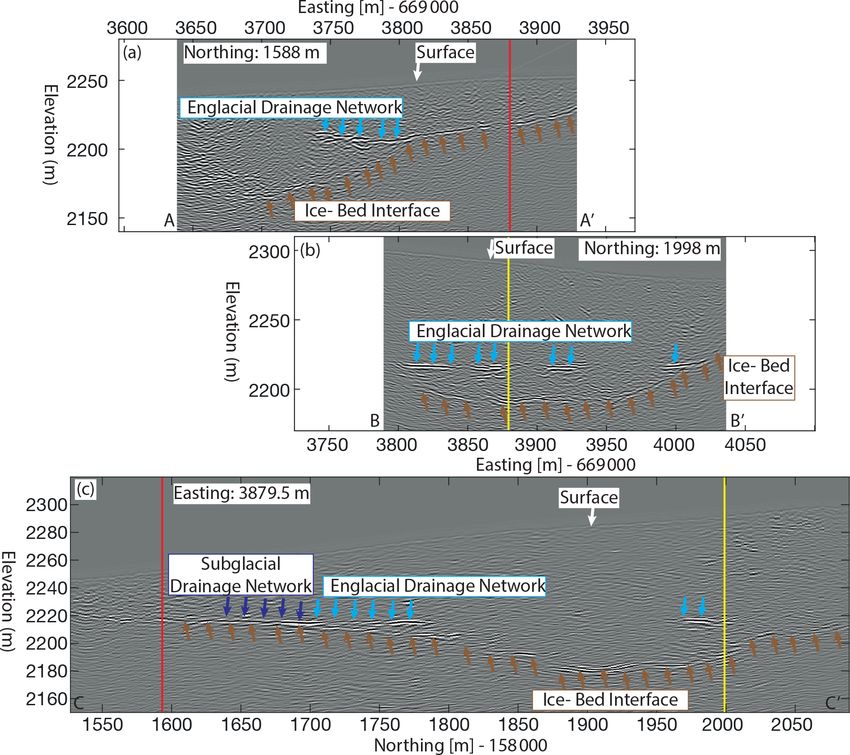
G. Church et al.: Ground-penetrating radar imaging reveals glacier’s drainage network in 3D                                        3981

Figure 4. (a) The root-mean-squared amplitude, extracted from the picked glacial drainage network, within ±1 m of the drainage network.
Contours represent the basal topography picked from the 3D GPR processed data. Colours of the drainage network represent the reflected
amplitudes, and areas of high amplitude indicate the presence of water. (b) A 3D view of basal interface (brown) and drainage network
(blue). The drainage network is split into four components, labelled A to D and referred to in the text. Orthophoto was provided by Swiss
Federal Office of Topology. Reproduced by permission of swisstopo (JA100120), © 2020 swisstopo (JD100042).

radar profiles using fixed-wing aircraft to bridge the gap be-         5     Discussion
tween 2D and 3D acquisition geometries by accounting for
these off-nadir reflections (Holschuh et al., 2020).                   5.1    Geometry of drainage network
   The 3D GPR acquisition and processing is able to fully
mitigate these distortions. The Rhonegletscher GPR data                Alongside Harper et al. (2010) and Egli et al. (2021), this
cube is the product of a 3D processing workflow, and with              study is one of a few times that a glacier’s drainage net-
the employment of 3D migration over conventional 2D mi-                work is imaged in 3D with GPR data, thus providing high-
gration, the off-nadir distortions are removed and an im-              resolution information of the geometry from such a sys-
provement in lateral resolution is gained. A 3D migration              tem. The Rhonegletscher’s drainage network identified in
effectively collapses the Fresnel zone in both inline and              this study has a meandering nature throughout the survey
crossline directions, thereby reducing the lateral resolution          area, with an increasing network width towards the termi-
to the wavelength of the EM wave propagating through ice.              nus of the glacier. Moreover, it consists of a single domi-
This lateral resolution leads to improvements in subsurface            nant conduit that alternately flows through englacial and sub-
imaging, as two closely laterally separated reflectors are able        glacial channels, known as Röthlisberger channels (Röthlis-
to be imaged as two individual reflectors.                             berger, 1972). Such a drainage network is known as an ef-
   A comparison between GPR data processed with two dif-               ficient channelized network. Studies from both polar (Chan-
ferent workflows (2D GPR workflow (Fig. 7a) and 3D GPR                 dler et al., 2013) and temperate (Nienow et al., 1996, 1998;
workflow (Fig. 7b)) highlights the imaging differences on              Mair et al., 2002) glaciers have shown that the glacier’s
both the englacial conduit network and the ice–bed interface.          drainage network is slow and inefficient early in the melt
Generally, both workflows produce similar subsurface im-               season. Typically, it evolves into a fast channelized drainage
ages; however, there are subtle differences that indicate a less       network just before the peak of the glacier’s discharge.
ambiguous interpretation with the 3D GPR workflow. The                 Since the peak discharge for Rhonegletscher is typically mid-
ice–bed interface in the 3D GPR data cube has increased re-            August (GLAMOS, 2017) (1 month after data acquisition),
flector continuity in comparison to the 2D workflow (Fig. 7,           the drainage network is expected to be in a channelized con-
brown arrows). Furthermore, the englacial conduit imaged               figuration.
using a 3D GPR workflow has fewer artefacts and is absent                 The theoretical shape of englacial drainage conduits is
of events that are incorrectly intersecting the englacial con-         circular; however, the drainage network imaged on Rhone-
duits (Fig. 7, blue arrows). Additional 2D and 3D GPR com-             gletscher is up to 60 times wider than its thickness when
parisons are provided as figures in the Supplement (Fig. S1).          water filled (according to both borehole observations and re-
                                                                       flected GPR polarity). Such an observation contradicts the
                                                                       theory of circular conduit cross-sectional shape proposed

https://doi.org/10.5194/tc-15-3975-2021                                                      The Cryosphere, 15, 3975–3988, 2021
3982 G. Church et al.: Ground-penetrating radar imaging reveals glacier’s drainage network in 3D Figure 5. (a) Map view of the extracted basal root-mean-squared amplitude within a ±1 m window. Contours represent the basal topography picked from the 3D GPR processed data. (b) Extracted basal amplitude in the northern part of the survey highlighting isolated high-amplitude basal reflections situated in localized flat zones. (c) Extracted basal amplitude in the southern part of the survey, highlighting connected high- amplitude basal reflections. The red arrows represent isolated water cavities along the basal interface, and the white arrows represent the main drainage network detected in Fig. 4. The pink arrows indicate the presence of subglacial water flow away from the main drainage network identified in Fig. 4. Orthophoto was provided by Swiss Federal Office of Topology. Reproduced by permission of swisstopo (JA100120), © 2020 swisstopo (JD100042). independently by both Shreve and Röthlisberger (Röthlis- part of the overdeepening (Cook and Swift, 2012). Accord- berger, 1972; Shreve, 1972) but is in line with the further ing to Lliboutry’s theory, these conduits should be located at development by Hooke et al. (1990). The latter author con- the same altitude as the lowest point of the riegel that pro- cluded that conduit’s are broad and low based upon mea- duces the overdeepening. The 3D GPR data suggest that in sured and calculated subglacial water pressures on Stor- the case of Rhonegletscher, the flow paths indeed route melt- glaciären, Sweden. Such channels can directly impact the water around the overdeepening rather than across it (Fig. 4b, glacier dynamics, as Hooke channels can lead to increased Component B). Similarly, the elevation of the englacial con- hydraulic friction and thus higher water pressure than theo- duit that is routing meltwater around the overdeepening co- rized R channels. This increase in hydraulic friction is a re- incides with the elevation of the riegel and also the proglacial sult not only of the channel’s shape but also higher closure lake level. These observations support the long-standing the- rates of the conduit. Thereby, the impact on ice dynamics is ory by Lliboutry (1983) but were never verified by field ob- that such a configuration would support higher sliding veloc- servations. ities. Furthermore, Werder et al. (2010) found that the hy- Subglacial and englacial water flows as a response of draulic friction interpreted from tracer experiments could be changing hydraulic potentials. This hydraulic potential can explained by assuming low and broad channels (i.e. Hooke be estimated by assuming spatially uniform flotation frac- channels). tion as described in Flowers and Clarke (1999). The imaged Lliboutry (1983) hypothesized that when water encounters Rhonegletscher’s drainage network followed the gradient of an overdeepening, the water flows along the glacier’s flank as the hydraulic potential and not along a single hydraulic po- so-called gradient conduits, therefore avoiding the deepest tential contour. The Cryosphere, 15, 3975–3988, 2021 https://doi.org/10.5194/tc-15-3975-2021
G. Church et al.: Ground-penetrating radar imaging reveals glacier’s drainage network in 3D                                             3983

Figure 6. Lower portion of Rhonegletscher showing an example acquired GPR data point. The GPR antennas are located on the surface, and
the yellow lines represent the shortest ray path for a reflection from the glacier basement. The dashed black ray path represents the basement
imaging point when performing 2D GPR processing. This ray path does not correspond to the true basement position but the out-of-plane
basement reflection point. This type of ray path is known as an off-nadir reflection.

Figure 7. (a) A single GPR data profile processed using with a 2D GPR workflow. (b) Single line extracted from multiple GPR profiles
processed using a 3D GPR workflow.

5.2   Water accumulation in temperate glaciers                           lished (Ridley et al., 1993; Siegert et al., 2005; Palmer et al.,
                                                                         2013), but their spatial extent is often unclear as a result of
                                                                         the limitations of 2D GPR surveys.
In addition to the detection of the primary drainage network,               From our 3D GPR data set, we are able to delineate high-
the 3D GPR data provided possible evidence of subglacial                 resolution lateral changes to the basal interface. Furthermore,
water accumulation. GPR-based detection of large amounts                 3D GPR has the potential to identify smaller subglacial wa-
of subglacial water, such as subglacial lakes, is well estab-

https://doi.org/10.5194/tc-15-3975-2021                                                          The Cryosphere, 15, 3975–3988, 2021
3984 G. Church et al.: Ground-penetrating radar imaging reveals glacier’s drainage network in 3D
ter accumulations, such as expected to occur within water- when lines are spaced far apart (beyond the horizontal resolu-
filled cavities. Subglacial cavities can form when the slid- tion). The 3D GPR processing provides significant imaging
ing ice uncouples from the glacier bed as a result of ei- improvements over conventional 2D GPR by providing an
ther rapid glacier sliding or pronounced bed roughness (Nye, increase in lateral resolution from 17 to 1.7 m in a glaciolog-
1970). Two types of subglacial cavity system are gener- ical setting with 25 MHz GPR antennas. Such an imaging im-
ally distinguished – isolated cavities and linked cavities – provement can be seen by comparing the extracted englacial
and both cavity systems alter the glacier’s dynamics (Lli- conduit reflection from a sparse network of 2D GPR pro-
boutry, 1976, 1979; Hoffman et al., 2016; Rada and Schoof, files in 2019 as described in Church et al. (2020) and the 3D
2018). The high-amplitude reflections along the basal inter- GPR processing described here. The extracted amplitude of
face (Fig. 5a) likely represent either water accumulations the englacial conduit (Fig. S3) from the 3D GPR process-
along basal bedrock or saturated sediments, both of which ing in the north of the survey (Section A in Fig. 4a) shows a
appear to be isolated from each other. However, saturated conduit width of 8 ± 1.7 m, whereas the 2D GPR suggests a
sediments are unlikely on Rhonegletscher, as a result of out- significantly wider englacial network 17.5 ± 8.5 m.
crops showing a granite bedrock with little sediment cover The major limiting factors of such future 3D GPR sur-
and borehole observations within the survey area showing veys are the time-consuming nature of ground-based GPR
a hard bedrock basal interface (Church et al., 2019). Fur- data acquisition, the accessibility of the field site due to dan-
thermore, the location of these high-amplitude basal reflec- gers on the glacier (such as heavily crevassed areas), and
tions can be explained from the hydraulic potential when the safety of personnel carrying heavy GPR systems. All
assuming low subglacial water pressure (Fig. S2a). On the of these concerns could be addressed with drone technol-
other hand, when assuming high subglacial water pressure ogy. Drone technology is often used in cryosphere research
these high amplitudes are located along the hydraulic gra- (Gaffey and Bhardwaj, 2020); however, GPR-based drone
dient (Fig. S2d). Due to the nature of the diurnal subglacial surveys are currently limited to landmine detection (Col-
water pressure on Rhonegletscher (Sugiyama et al., 2008), orado et al., 2017; Sipos et al., 2017) and soil mapping (Wu
it is therefore likely that these high-amplitude basal reflec- et al., 2019). Developments of lightweight GPR systems are
tions are indicative of potentially isolated water-filled cavi- anticipated to provide the possibility of equipping small un-
ties forming an inefficient drainage network. crewed aerial vehicles with the capacity to acquire 3D radar
High-amplitude basal reflections could also result from data in a fast and efficient manner. With sufficient power a
air-filled cavities. If an air-filled cavity existed, the recorded drone-based solution would acquire the Rhonegletscher data
EM reflection would have opposite polarity to a reflection within an estimated 7 h of flying time, instead of the 9 d spent
caused by a water-filled cavity or hard bed. In the case of for the ground-based study.
the Rhonegletscher 3D GPR data set, the phase of the basal
reflection remained consistent across the survey, suggesting
that there are no imaged air-filled cavities within the sur-
vey area. Furthermore, it is interesting to note both an inef- 6 Conclusions
ficient drainage network and an efficient network can coex-
ist in overdeepenings (Hooke et al., 1990; Rada and Schoof, By using a 3D GPR data set, we have produced unaliased
2018). Although our data provide an instantaneous image of imaging of the Rhonegletscher’s drainage network in a sec-
these systems, repeated 3D GPR surveys could also yield in- tion of its ablation zone that has led to the agreement of
sights into their temporal dynamics. long-standing glacier hydraulic theory. Upon meeting an
overdeepening, meltwater is routed alongside the flank of the
5.3 Future of 2D and 3D GPR within glaciology glacier within so-called gradient conduits and thereby avoid-
ing the overdeepening.
A 3D approach presented within this work is feasible and The geometry of the drainage network was determined by
highly beneficial for detecting and quantifying dimensions of extracting the root-mean-squared reflected GPR amplitude.
a glacier’s hydrological network when compared to 2D GPR. Using this extracted GPR attribute, we were able to delin-
For large-scale investigations in Greenland and Antarctica, eate a hydrological system in 3D that includes connected
it will be more challenging to conduct 3D GPR surveys as englacial and subglacial conduits. Such observations were
a result of their spatial distribution, and therefore 2D GPR only possible due to the 3D nature of our data. The 2D GPR
acquisition will likely continue to prevail. However, future imaging would have failed in determining the continuity of
radar surveys could be complemented with the use of 3D this hydraulic system, and with such 2D GPR data a connec-
GPR acquisition in order to reduce the ambiguity of inter- tion would only be the result of speculation. We found the
pretations in places of interest. The 2D and 3D GPR data dimensions of the conduit were 60 times wider than its thick-
processing comparison (Figs. 7 and S1) highlights the subtle ness, which is in contrast to the theory that conduits are circu-
difference in the advantage of 3D GPR processing. However, lar. However, these observations are in line with further con-
the 2D GPR dramatically suffers from poor lateral resolution duit geometry developments by Hooke et al. (1990). From
The Cryosphere, 15, 3975–3988, 2021 https://doi.org/10.5194/tc-15-3975-2021G. Church et al.: Ground-penetrating radar imaging reveals glacier’s drainage network in 3D 3985
the geometry of the conduit network, we are able to confirm knowledge the Landmark Graphics Corporation for providing data
that the hydraulic system is an efficient drainage network. processing software through the Landmark University Grant Pro-
In addition to observing the main efficient drainage gram. The authors wish to acknowledge all volunteers for their valu-
network, the extracted GPR-reflected amplitude from the able help in the fieldwork. Furthermore, we would like to thank both
glacier’s basal interface suggested that subglacial water is Daniel Farinotti for an insightful in-house review, which improved
the clarity of the manuscript, and Mauro Werder for important in-
potentially pooling in numerous isolated localized flat areas.
sights into the discussion of the paper. We would also like to thank
This localized pooling of water forms an inefficient drainage the editor Joseph MacGregor and the two anonymous reviewers for
network. Thereby, both efficient and inefficient drainage net- their constructive comments in order to improve the quality of the
works are able to coexist within overdeepenings. manuscript.
The 3D GPR data have been adopted and have proven to
be successful for imaging small-scale targets within the fields
of archaeology and investigating shallow fault zones and to Financial support. This research has been supported by the
a lesser extent in glaciological investigations. This study il- Schweizerischer Nationalfonds zur Förderung der Wis-
lustrates the feasibility and the opportunities that are offered senschaftlichen Forschung (grant nos. 200021_169329/1 and
by implementing 3D GPR to image glaciers and their hy- 200021_169329/2).
draulic networks. Alongside the development of lightweight
GPR systems and uncrewed aerial vehicles, such future 3D
GPR surveys will be acquired faster and in a more efficient Review statement. This paper was edited by Joseph MacGregor and
manner, thereby ultimately leading to significant improve- reviewed by two anonymous referees.
ments in our understanding of glacier hydrology.
References
Data availability. The data is available upon request.
Bælum, K. and Benn, D. I.: Thermal structure and drainage sys-
tem of a small valley glacier (Tellbreen, Svalbard), investi-
Video supplement. Movies showing inline, cross, and gated by ground penetrating radar, The Cryosphere, 5, 139–149,
depth slices through the 3D GPR cube can be found at https://doi.org/10.5194/tc-5-139-2011, 2011.
https://doi.org/10.3929/ethz-b-000471304. Bartholomaus, T. C., Anderson, R. S., and Anderson, S. P.: Re-
sponse of glacier basal motion to transient water storage, Nat.
Geosci., 1, 33–37, doi10.1038/ngeo.2007.52, 2008.
Supplement. The supplement related to this article is available on- Bartholomew, I., Nienow, P., Mair, D., Hubbard, A., King, M. A.,
line at: https://doi.org/10.5194/tc-15-3975-2021-supplement. and Sole, A.: Seasonal evolution of subglacial drainage and ac-
celeration in a Greenland outlet glacier, Nat. Geosci., 3, 408–411,
https://doi.org/10.1038/ngeo863, 2010.
Beniston, M., Farinotti, D., Stoffel, M., Andreassen, L. M., Cop-
Author contributions. GC, MG, AB, and HM designed the 3D GPR
pola, E., Eckert, N., Fantini, A., Giacona, F., Hauck, C., Huss,
experiment, which were carried out by GC. GC processed and in-
M., Huwald, H., Lehning, M., López-Moreno, J.-I., Magnusson,
terpreted the data, with help from all co-authors. GC wrote the
J., Marty, C., Morán-Tejéda, E., Morin, S., Naaim, M., Proven-
manuscript with comments and suggestions for improvements from
zale, A., Rabatel, A., Six, D., Stötter, J., Strasser, U., Terzago, S.,
all co-authors.
and Vincent, C.: The European mountain cryosphere: a review of
its current state, trends, and future challenges, The Cryosphere,
12, 759–794, https://doi.org/10.5194/tc-12-759-2018, 2018.
Competing interests. The authors declare that they have no conflict Bingham, R. G., Nienow, P. W., Sharp, M. J., and Copland,
of interest. L.: Hydrology and dynamics of a polythermal (mostly cold)
High Arctic glacier, Earth Surf. Proc. Land., 31, 1463–1479,
https://doi.org/10.1002/esp.1374, 2006.
Disclaimer. Publisher’s note: Copernicus Publications remains Böniger, U. and Tronicke, J.: Improving the interpretabil-
neutral with regard to jurisdictional claims in published maps and ity of 3D GPR data using target-specific attributes: appli-
institutional affiliations. cation to tomb detection, J. Archaeol. Sci., 37, 360–367,
https://doi.org/10.1016/j.jas.2009.09.049, 2010.
Chandler, D. M., Wadham, J. L., Lis, G. P., Cowton, T.,
Acknowledgements. Data acquisition has been provided by the Sole, A., Bartholomew, I., Telling, J., Nienow, P., Bagshaw,
Exploration and Environment Geophysics (EEG) group and the E. B., Mair, D., Vinen, S., and Hubbard, A.: Evolution
Laboratory of Hydraulics, Hydrology and Glaciology (VAW) of of the subglacial drainage system beneath the Greenland
ETH Zurich. We especially thank Leon Bührle, Enrico Mattea, Ice Sheet revealed by tracers, Nat. Geosci., 6, 195–198,
Daniel May, Valerie Krampe, and Céline Walker for their support https://doi.org/10.1038/ngeo1737, 2013.
during the field data acquisition. We would like to gratefully ac- Church, G., Bauder, A., Grab, M., Rabenstein, L., Singh, S., and
Maurer, H.: Detecting and characterising an englacial conduit
https://doi.org/10.5194/tc-15-3975-2021 The Cryosphere, 15, 3975–3988, 20213986 G. Church et al.: Ground-penetrating radar imaging reveals glacier’s drainage network in 3D network within a temperate Swiss glacier using active seismic, Gudmundsson, G. H., Bassi, A., Vonmoos, M., Bauder, A., Fis- ground penetrating radar and borehole analysis, Ann. Glaciol., cher, U. H., and Funk, M.: High-resolution measurements of 60, 193–205, https://doi.org/10.1017/aog.2019.19, 2019. spatial and temporal variations in surface velocities of Unteraar- Church, G., Grab, M., Schmelzbach, C., Bauder, A., and Mau- gletscher, Bernese Alps, Switzerland, Ann. Glaciol., 31, 63–68, rer, H.: Monitoring the seasonal changes of an englacial conduit https://doi.org/10.3189/172756400781820156, 2000. network using repeated ground-penetrating radar measurements, Gulley, J.: Structural control of englacial conduits in the temper- The Cryosphere, 14, 3269–3286, https://doi.org/10.5194/tc-14- ate Matanuska Glacier, Alaska, USA, J. Glaciol., 55, 681–690, 3269-2020, 2020. https://doi.org/10.3189/002214309789470860, 2009. Colorado, J., Devia, C., Perez, M., Mondragon, I., Mendez, Gulley, J. D., Benn, D. I., Müller, D., and Luckman, A.: A D., and Parra, C.: Low-altitude autonomous drone nav- cut-and-closure origin for englacial conduits in uncrevassed igation for landmine detection purposes, 2017 Interna- regions of polythermal glaciers, J. Glaciol., 55, 66–80, tional Conference on Unmanned Aircraft Systems, ICUAS https://doi.org/10.3189/002214309788608930, 2009. 2017, Miami, FL, USA, 13–16 June 2017, 540–546, Hansen, L. U., Piotrowski, J. A., Benn, D. I., and Sevestre, H.: A https://doi.org/10.1109/ICUAS.2017.7991303, 2017. cross-validated three-dimensional model of an englacial and sub- Cook, S. J. and Swift, D. A.: Subglacial basins: Their origin and im- glacial drainage system in a High-Arctic glacier, J. Glaciol., 66, portance in glacial systems and landscapes, Earth-Sci. Rev., 115, 278–290, https://doi.org/10.1017/jog.2020.1, 2020. 332–372, https://doi.org/10.1016/j.earscirev.2012.09.009, 2012. Harper, J. T., Bradford, J. H., Humphrey, N. F., and Meier- Cuffey, K. M. and Paterson, W. S. B.: The Physics of Glaciers, Aca- bachtol, T. W.: Vertical extension of the subglacial demic Press, 4th edn., 2010. drainage system into basal crevasses, Nature, 467, 579–582, Egli, P. E., Irving, J., and Lane, S. N.: Characterization of https://doi.org/10.1038/nature09398, 2010. subglacial marginal channels using 3-D analysis of high- Hart, J. K., Rose, K. C., Clayton, A., and Martinez, K.: Englacial density ground-penetrating radar data, J. Glaciol., 67, 759–772, and subglacial water flow at Skálafellsjökull, Iceland derived https://doi.org/10.1017/jog.2021.26, 2021. from ground penetrating radar, in situ Glacsweb probe and bore- Flowers, G. E. and Clarke, G. K. C.: Surface and bed topography hole water level measurements, Earth Surf. Proc. Land., 40, of Trapridge Glacier, Yukon Territory, Canada: digital elevation 2071–2083, https://doi.org/10.1002/esp.3783, 2015. models and derived hydraulic geometry, J. Glaciol., 45, 165–174, Hoffman, M. J., Andrews, L. C., Price, S. A., Catania, G. A., Neu- https://doi.org/10.1017/S0022143000003142, 1999. mann, T. A., Lüthi, M. P., Gulley, J., Ryser, C., Hawley, R. L., Fountain, A. G. and Walder, J. S.: Water flow through and Morriss, B.: Greenland subglacial drainage evolution regu- temperate glaciers, Rev. Geophys., 36, 299–328, lated by weakly connected regions of the bed, Nat. Commun., 7, https://doi.org/10.1029/97RG03579, 1998. 13903, https://doi.org/10.1038/ncomms13903, 2016. Fountain, A. G., Jacobel, R. W., Schlichting, R., and Holschuh, N., Christianson, K., Paden, J., Alley, R. B., and Anan- Jansson, P.: Fractures as the main pathways of wa- dakrishnan, S.: Linking postglacial landscapes to glacier dynam- ter flow in temperate glaciers, Nature, 433, 618–621, ics using swath radar at Thwaites glacier, Antarctica, Geology, https://doi.org/10.1038/nature03296, 2005. 48, 268–272, https://doi.org/10.1130/G46772.1, 2020. Gaffey, C. and Bhardwaj, A.: Applications of Unmanned Aerial Ve- Hooke, R. L., Laumann, T., and Kohler, J.: Subglacial Water Pres- hicles in Cryosphere: Latest Advances and Prospects, Remote sures and the Shape of Subglacial Conduits, J. Glaciol., 36, 67– Sensing, 12, 948, https://doi.org/10.3390/rs12060948, 2020. 71, https://doi.org/10.3189/S0022143000005566, 1990. GLAMOS: The Swiss Glaciers 2013/14 and 2014/15, edited Iken, A., Rothlisberger, H., Flotron, A., and Haeberli, W.: The up- by: Bauder, A., Glaciological Report No. 135/136 of the lift of Unteraargletscher at the beginning of the melt season – a Cryospheric Commission (EKK) of the Swiss Academy of Sci- consequence of water storage at the bed?, J. Glaciol., 29, 28–47, ences (SCNAT) published by VAW/ETH Zürich, Tech. rep., https://doi.org/10.1017/S0022143000005128, 1983. https://doi.org/10.18752/glrep_135-136, 2017. Irvine-Fynn, T. D. L., Moorman, B. J., Williams, J. L. M., Grab, M., Bauder, A., Ammann, F., Langhammer, L., Hellmann, and Walter, F. S. A.: Seasonal changes in ground-penetrating S., Church, G. J., Schmid, L., Rabenstein, L., and Maurer, radar signature observed at a polythermal glacier, By- H. R.: Ice volume estimates of Swiss glaciers using helicopter- lot Island, Canada, Earth Surf. Proc. Land., 31, 892–909, borne GPR an example from the Glacier de la Plaine Morte, https://doi.org/10.1002/esp.1299, 2006. in: 2018 17th International Conference on Ground Penetrating Irving, J. D. and Knight, R. J.: Removal of wavelet dispersion Radar (GPR), IEEE, Rapperswil, Switzerland, 18–21 June 2018, from ground-penetrating radar data, Geophysics, 68, 960–970, https://doi.org/10.1109/ICGPR.2018.8441613, 2018. https://doi.org/10.1190/1.1581068, 2003. Grab, M., Mattea, E., Bauder, A., Huss, M., Rabenstein, L., Joughin, I., Das, S. B., King, M. A., Smith, B. E., and Hodel, E., Linsbauer, A., Langhammer, L., Schmid, L., Howat, I. M.: Seasonal Speedup Along the Western Church, G., Hellmann, S., Délèze, K., Schaer, P., Lathion, Flank of the Greenland Ice Sheet, Science, 320, 781–783, P., Farinotti, D., and Maurer, H.: Ice thickness distribution https://doi.org/10.1126/science.1153288, 2008. of all Swiss glaciers based on extended ground-penetrating King, E. C.: The precision of radar-derived subglacial bed topog- radar data and glaciological modeling, J. Glaciol., 1–19, raphy: A case study from Pine Island Glacier, Antarctica, Ann. https://doi.org/10.1017/jog.2021.55, 2021. Glaciol., 61, 154–161, https://doi.org/10.1017/aog.2020.33, Grasmueck, M., Weger, R., and Horstmeyer, H.: Full- 2020. resolution 3D GPR imaging, Geophysics, 70, 12JF–Z26, https://doi.org/10.1190/1.1852780, 2005. The Cryosphere, 15, 3975–3988, 2021 https://doi.org/10.5194/tc-15-3975-2021
G. Church et al.: Ground-penetrating radar imaging reveals glacier’s drainage network in 3D                                                 3987

Lindner, F., Walter, F., Laske, G., and Gimbert, F.: Glaciohydraulic     Putzig, N. E., Smith, I. B., Perry, M. R., Foss, F. J., Campbell, B. A.,
   seismic tremors on an Alpine glacier, The Cryosphere, 14, 287–           Phillips, R. J., and Seu, R.: Three-dimensional radar imaging of
   308, https://doi.org/10.5194/tc-14-287-2020, 2020.                       structures and craters in the Martian polar caps, Icarus, 308, 138–
Lliboutry, L.: Physical Processes in Temperate Glaciers, J. Glaciol.,       147, https://doi.org/10.1016/j.icarus.2017.09.023, 2018.
   16, 151–158, https://doi.org/10.3189/S002214300003149X,               Rada, C. and Schoof, C.: Channelized, distributed, and discon-
   1976.                                                                    nected: subglacial drainage under a valley glacier in the Yukon,
Lliboutry, L.: Local Friction Laws for Glaciers: A Criti-                   The Cryosphere, 12, 2609–2636, https://doi.org/10.5194/tc-12-
   cal Review and New Openings, J. Glaciol., 23, 67–95,                     2609-2018, 2018.
   https://doi.org/10.3189/s0022143000029750, 1979.                      Reynolds, J. M.: An introduction to applied and environmental geo-
Lliboutry, L.: Modifications to the Theory of Intraglacial Water-           physics, John Wiley & Sons, 1997.
   ways for the Case of Subglacial Ones, J. Glaciol., 29, 216–226,       Ridley, J. K., Cudlip, W., and Laxon, S. W.: Identification of sub-
   https://doi.org/10.3189/S0022143000008273, 1983.                         glacial lakes using ERS-1 radar altimeter, J. Glaciol., 39, 625–
Macgregor, K. R., Riihimaki, C. A., and Anderson, R. S.:                    634, https://doi.org/10.1017/S002214300001652X, 1993.
   Spatial and temporal evolution of rapid basal sliding                 Röthlisberger,      H.:    Water      Pressure      in      Intra-    and
   on Bench Glacier, Alaska, USA, J. Glaciol., 51, 49–63,                   Subglacial       Channels,     J.    Glaciol.,       11,     177–203,
   https://doi.org/10.3189/172756505781829485, 2005.                        https://doi.org/10.1017/S0022143000022188, 1972.
Mair, D., Nienow, P., Sharp, M., Wohlleben, T., and Willis, I.: Influ-   Schaap, T., Roach, M. J., Peters, L. E., Cook, S., Ku-
   ence of subglacial drainage system evolution on glacier surface          lessa, B., and Schoof, C.: Englacial drainage structures in
   motion: Haut Glacier d’Arolla, Switzerland, J. Geophys. Res.,            an East Antarctic outlet glacier, J. Glaciol., 66, 166–174,
   107, 2175, https://doi.org/10.1029/2001JB000514, 2002.                   https://doi.org/10.1017/jog.2019.92, 2019.
McClymont, A. F., Green, A. G., Streich, R., Horstmeyer,                 Schoof, C.: Ice-sheet acceleration driven by melt supply variabil-
   H., Tronicke, J., Nobes, D. C., Pettinga, J., Campbell, J.,              ity, Nature, 468, 803–806, https://doi.org/10.1038/nature09618,
   and Langridge, R.: Visualization of active faults using ge-              2010.
   ometric attributes of 3D GPR data: An example from the                Sheriff,     R.      E.     and      Geldart,     L.       P.:     Explo-
   Alpine Fault Zone, New Zealand, Geophysics, 73, B11,                     ration      Seismology,       Cambridge        University        Press,
   https://doi.org/10.1190/1.2825408, 2008.                                 https://doi.org/10.1017/CBO9781139168359, 1995.
Moorman, B. J. and Michel, F. A.: Glacial hydrological                   Shreve, R. L.: Movement of Water in Glaciers, J. Glaciol., 11, 205–
   system characterization using ground-penetrating radar, Hy-              214, https://doi.org/10.3189/S002214300002219X, 1972.
   drol. Process., 14, 2645–2667, https://doi.org/10.1002/1099-          Siegert, M. J., Carter, S., Tabacco, I., Popov, S., and Blankenship,
   1085(20001030)14:153.0.CO;2-2, 2000.                    D. D.: A revised inventory of Antarctic subglacial lakes, Antarct.
Nanni, U., Gimbert, F., Vincent, C., Gräff, D., Walter, F., Pi-             Sci., 17, 453–460, https://doi.org/10.1017/S0954102005002889,
   ard, L., and Moreau, L.: Quantification of seasonal and di-              2005.
   urnal dynamics of subglacial channels using seismic observa-          Sipos, D., Planinsic, P., and Gleich, D.: On drone ground pen-
   tions on an Alpine glacier, The Cryosphere, 14, 1475–1496,               etrating radar for landmine detection, in: 2017 First Interna-
   https://doi.org/10.5194/tc-14-1475-2020, 2020.                           tional Conference on Landmine: Detection, Clearance and Leg-
Nienow, P., Sharp, M., and Willis, I.: Temporal Switch-                     islations (LDCL), IEEE, Beirut, Lebanon, 26–28 April 2017,
   ing Between Englacial and Subglacial Drainage Path-                      https://doi.org/10.1109/LDCL.2017.7976931, 2017.
   ways: Dye Tracer Evidence from the Haut Glacier                       Stuart, G., Murray, T., Gamble, N., Hayes, K., and Hodson, A.:
   D’arolla, Switzerland, Geogr. Ann. Ser. A, 78, 51–60,                    Characterization of englacial channels by ground-penetrating
   https://doi.org/10.1080/04353676.1996.11880451, 1996.                    radar: An example from austre Brøggerbreen, Svalbard, J. Geo-
Nienow, P., Sharp, M., and Willis, I.: Seasonal changes                     phys. Res., 108, 2525, https://doi.org/10.1029/2003JB002435,
   in the morphology of the subglacial drainage system,                     2003.
   Haut Glacier d’Arolla, Switzerland, Earth Surf. Process.              Sugiyama, S. and Gudmundsson, G. H.: Short-term variations in
   Land., 23, 825–843, https://doi.org/10.1002/(SICI)1096-                  glacier flow controlled by subglacial water pressure at Lauteraar-
   9837(199809)23:93.0.CO;2-2, 1998.                       gletscher, Bernese Alps, Switzerland, J. Glaciol., 50, 353–362,
Nye, J.: Glacier sliding without cavitation in a linear vis-                https://doi.org/10.3189/172756504781829846, 2004.
   cous approximation, Proc. R. Soc. Lond. A, 315, 381–403,              Sugiyama, S., Tsutaki, S., Nishimura, D., Blatter, H., Bauder, A.,
   https://doi.org/10.1098/rspa.1970.0050, 1970.                            and Funk, M.: Hot water drilling and glaciological observations
Palmer, S. J., Dowdeswell, J. A., Christoffersen, P., Young,                at the terminal part of Rhonegletscher , Switzerland in 2007,
   D. A., Blankenship, D. D., Greenbaum, J. S., Benham,                     Bull. Glaciol. Res., 26, 41–47, 2008.
   T., Bamber, J., and Siegert, M. J.: Greenland subglacial              Temminghoff, M., Benn, D. I., Gulley, J. D., and Sevestre, H.:
   lakes detected by radar, Geophys. Res. Lett., 40, 6154–6159,             Characterization of the englacial and subglacial drainage sys-
   https://doi.org/10.1002/2013GL058383, 2013.                              tem in a high Arctic cold glacier by speleological mapping
Peters, L. E., Anandakrishnan, S., Holland, C. W., Horgan, H. J.,           and ground-penetrating radar, Geogr. Ann. Ser. A, 101, 98–117,
   Blankenship, D. D., and Voigt, D. E.: Seismic detection of a sub-        https://doi.org/10.1080/04353676.2018.1545120, 2019.
   glacial lake near the South Pole, Antarctica, Geophys. Res. Lett.,    Tsutaki, S., Sugiyama, S., Nishimura, D., and Funk, M.: Acceler-
   35, 1–5, https://doi.org/10.1029/2008GL035704, 2008.                     ation and flotation of a glacier terminus during formation of a
Podolskiy, E. A. and Walter, F.: Cryoseismology, Rev. Geophy., 54,          proglacial lake in Rhonegletscher, Switzerland, J. Glaciol., 59,
   708–758, https://doi.org/10.1002/2016RG000526, 2016.                     559–570, https://doi.org/10.3189/2013JoG12J107, 2013.

https://doi.org/10.5194/tc-15-3975-2021                                                           The Cryosphere, 15, 3975–3988, 2021
You can also read