Stable isotopes in cave ice suggest summer temperatures in east-central Europe are linked to Atlantic Multidecadal Oscillation variability - CP
←
→
Page content transcription
If your browser does not render page correctly, please read the page content below
Clim. Past, 16, 2445–2458, 2020
https://doi.org/10.5194/cp-16-2445-2020
© Author(s) 2020. This work is distributed under
the Creative Commons Attribution 4.0 License.

Stable isotopes in cave ice suggest summer temperatures in
east-central Europe are linked to Atlantic Multidecadal
Oscillation variability
Carmen-Andreea Bădăluţă1,2,3 , Aurel Pers, oiu1,4 , Monica Ionita5 , and Natalia Piotrowska6
1 Stable  Isotope Laboratory, Ştefan cel Mare University, Suceava, 720229, Romania
2 Department    of Geography, Ştefan cel Mare University, Suceava, 720229, Romania
3 Institute for Geological and Geochemical Research, Research Centre for Astronomy and Earth Sciences MTA,

Budapest, 1112, Hungary
4 Emil Racoviţă Institute of Speleology, Romanian Academy, Cluj-Napoca, 400006, Romania
5 Alfred Wegener Institute, Helmholtz Center for Polar and Marine Research, Bremerhaven, 27515, Germany
6 Institute of Physics, Silesian University of Technology, Gliwice, 44-100, Poland

Correspondence: Carmen-Andreea Bădăluţă (carmen.badaluta@usm.ro) and Aurel Pers, oiu (aurel.persoiu@gmail.com)

Received: 22 November 2019 – Discussion started: 13 January 2020
Revised: 20 October 2020 – Accepted: 28 October 2020 – Published: 10 December 2020

Abstract. The climate of east-central Europe (ECE) is the         contrary to those that show a marked contrast between the
result of a combination of influences originating in the wider    two periods in terms of both winter and annual air tempera-
North Atlantic realm, the Mediterranean Sea, and the west-        tures, suggesting that cooling during the LIA was primarily
ern Asian and Siberian regions. Previous studies have shown       the result of wintertime climatic changes.
that the complex interplay between the large-scale atmo-
spheric patterns across the region results in strongly dissimi-
lar summer and winter conditions on timescales ranging from       1   Introduction
decades to millennia. To put these into a wider context, long-
term climate reconstructions are required, but, largely due       Rapid global warming (IPCC, 2018) and the ensuing suite
to historical reasons, these are lacking in ECE. We address       of climatic changes that it triggers (Coumou and Rahmstorf,
these issues by presenting a high-resolution, radiocarbon-        2012) demands a clear understanding of the background
dated record of summer temperature variations during the          mechanisms in order to be able to disentangle natural and an-
last millennium in ECE, based on stable isotope analysis of       thropogenic processes (Haustein et al., 2017; IPCC, 2018).
a 4.84 m long ice core extracted from Focul Viu Ice Cave          Especially important are high-resolution reconstructions of
(Western Carpathians, Romania). Comparisons with both in-         the past variability of different climatic variables, such as
strumental and proxy-based data indicate that the stable iso-     seasonal air temperatures, precipitation amounts and mois-
tope composition of cave ice records the changes in sum-          ture sources, that allow for direct comparisons with the dy-
mer air temperature and has a similar temporal evolution          namics of natural forcing and further decipherment of the
to that of the Atlantic Multidecadal Oscillation on decadal       mechanisms of past and present climate dynamics. The last
to multidecadal timescales, suggesting that changes in the        1000 years are particularly significant, as the European cli-
North Atlantic are transferred, likely via atmospheric pro-       mate has generally changed from warm to cold (the Medieval
cesses towards the wider Northern Hemisphere. On centen-          Warm Period–Little Ice Age transition; Jones et al., 2009)
nial timescales, the data show little summer temperature dif-     and back to warm (the present-day warming; Neukom et al.,
ferences between the Medieval Warm Period (MWP) and the           2019). These transitions allow for the links between forc-
Little Ice Age (LIA) in eastern Europe. These findings are        ing and climatic response to be tested. While several global
                                                                  (Jones and Mann, 2004; Mann et al., 2009) and hemispheric

Published by Copernicus Publications on behalf of the European Geosciences Union.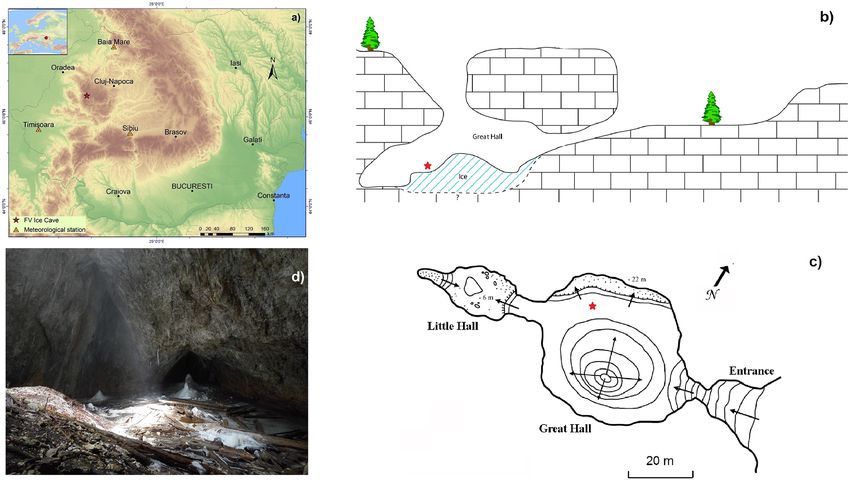
2446                       C.-A. Bădăluţă et al.: Summer temperatures in east-central Europe are linked to AMO variability

(Moberg et al., 2005; Neukom et al., 2019; PAGES 2k Con-            values measured along an ice core drilled in Focul Viu Ice
sortium, 2019; Ljungqvist et al., 2019) climatic reconstruc-        Cave (Western Carpathian Mountains, Romania).
tions have been published, these made no seasonal differen-
tiation – a task that became recently increasingly necessary
to constrain seasonally distinctive climatic changes (e.g.,         2   Site information
Ljungqvist et al., 2019), as these respond to different forc-
ing mechanisms (e.g., Pers, oiu et al., 2019). On multidecadal      Focul Viu Ice Cave (FV; 107 m long and ∼ 30 m deep) is
timescales, the summer climate over Europe is mainly in-            located in the central Bihor Mountains, Romania (46◦ 340 N,
fluenced by the Atlantic Multidecadal Oscillation, or AMO           22◦ 400 E; 1165 m above sea level; Fig. 1a; Pers, oiu and Onac,
(Schlesinger et al., 1994; Kaplan et al., 1998; Kerr, 2000;         2019). The cave has a simple morphology (Fig. 1b, c) with a
Knudsen et al., 2011, 2014). The AMO is a climate mode of           small entrance that opens into the Great Hall (68 m × 46 m),
variability associated with periodic anomalies in sea surface       which, in turn, is followed by a narrow gallery (Little Hall,
temperatures (SSTs) in northern, extra-tropical latitudes. The      20 m × 5 m). The ceiling of the Great Hall opens to the
positive phase is characterized by positive SST anomalies           surface (Fig. 1c) which allows precipitation to reach the
spanning the whole North Atlantic Ocean and is associated           cave. Below the opening, covering the entire surface of the
with above normal temperatures over the central and eastern         Great Hall, a layered ice block has developed, with an esti-
parts of Europe, whereas the negative phase is characterized        mated thickness of 20 m and minimum volume of 30 000 m3
by negative SST anomalies over the North Atlantic Ocean             (Orghidan et al., 1984; Brad et al., 2018). The descendent
and is associated with below normal temperatures over the           morphology of the cave and the presence of the two open-
central and eastern parts of Europe. Over Europe, the in-           ings determine a specific type of air circulation (Pers, oiu and
fluence of the AMO is clearest during summer (Sutton and            Onac, 2019): cold air inflow through the lower entrance and
Dong, 2012; Ionita et al., 2012, 2017; O’Reilly et al., 2017).      warm air outflow through the upper entrance in winter, and
   In temperate climatic regions, one of the most sensitive         slow convective circulation within the cave (with no air mass
environmental archives are ice caves (Holmlund et al., 2005;        exchange with the outside) during summer. As a result of
Kern and Pers, oiu, 2013), i.e., rock caves hosting perennial       this air circulation, the dynamics of air temperature inside
accumulations of ice. In such caves, ice forms either by            and outside of the cave follow a similar pattern between Oc-
freezing of water or direct snow deposition in the entrance         tober and April, whereas cave temperatures are stable at 0 ◦ C
shafts (e.g., Mavlyudov, 2018). Several studies have shown          between May and September, regardless of changes outside
that these deposits host a wealth of information on past cli-       (Pers, oiu et al., 2007).
mate variability. Stoffel et al. (2009), Pers, oiu et al. (2017)       A direct consequence of the predominantly negative air
and Sancho et al. (2018) have shown that proxies in cave ice        temperatures in the cave is the genesis, accumulation and
forming during winter months record the changes in temper-          preservation of ice (Fig. 1b, c). During summer, infiltrating
ature and moisture sources, which are likely influenced by          rainwater accumulates on top of the existing ice block to
the dynamics of the North Atlantic Oscillation. Other stud-         form a layer of water that is approximately 0–20 cm deep.
ies have used pollen and plant macrofossils recovered from          Monitoring of air temperature in the cave has shown that air
cave ice to reconstruct past vegetation dynamics (Feurdean et       temperature drop below 0 ◦ C outside the cave in early au-
al., 2011; Leunda et al., 2019), while some works have used         tumn (September), leading to cold air avalanches reaching
the accumulation rate of ice as indicators of past climatic         the inner parts of the cave (Pers, oiu et al., 2007). The inflow
variability (e.g., Kern et al., 2018) or atmospheric processes      of cold air leads to the freezing of the lake water from top to
(Kern et al., 2009). Studies of ice caves in southern Europe        bottom, forming a 1–20 cm thick layer of ice (“summer ice”).
have also highlighted the sensitivity of cave glaciers to sum-      Although the air temperature might briefly rise above 0 ◦ C
mer climatic conditions (Colucci et al., 2016; Colucci and          in autumn, temperatures inside the cave do not exceed 0 ◦ C.
Guglielmin, 2019; Pers, oiu et al., 2020). Regardless of the de-    Thus, the layer of ice formed on top of the lake will prevent
position style, the ice records the original stable isotope com-    the subsequent addition of water to the lake, thereby preserv-
position of precipitation that further reflects changes in air      ing the original isotopic composition of water reflecting that
temperature; thus, it is an important archive of past tempera-      of summer precipitation. Infiltration and subsequent freezing
ture and moisture source variability (Pers, oiu et al., 2011a,      of water during warm periods in winter result in additional
b). The Carpathian Mountains host ice caves (Brad et al.,           layers of ice on top of the ice block (“winter ice”). How-
2018) that preserve a large variety of geochemical informa-         ever, at the onset of melting, this winter ice melts (Pers, oiu
tion on past climate and environmental changes (Fórizs et al.,      et al., 2011b). The result of these processes is a multiannual,
2004; Kern et al., 2004; Citterio et al., 2005; Pers, oiu et al.,   layered, ice block, consisting of annual couplets of clear ice
2017). Here, we present a reconstruction of summer climate          (on top) and a sediment-rich layer beneath. Inflow of warm
variability and large-scale circulation drivers during the last     water in wet summers leads to rapid ablation of the ice at
1000 years in east-central Europe based on the δ 18 O and δ 2 H     the top of the ice block, partly altering the annual layering.
                                                                    The processes of cave ice formation by water freezing and

Clim. Past, 16, 2445–2458, 2020                                                        https://doi.org/10.5194/cp-16-2445-2020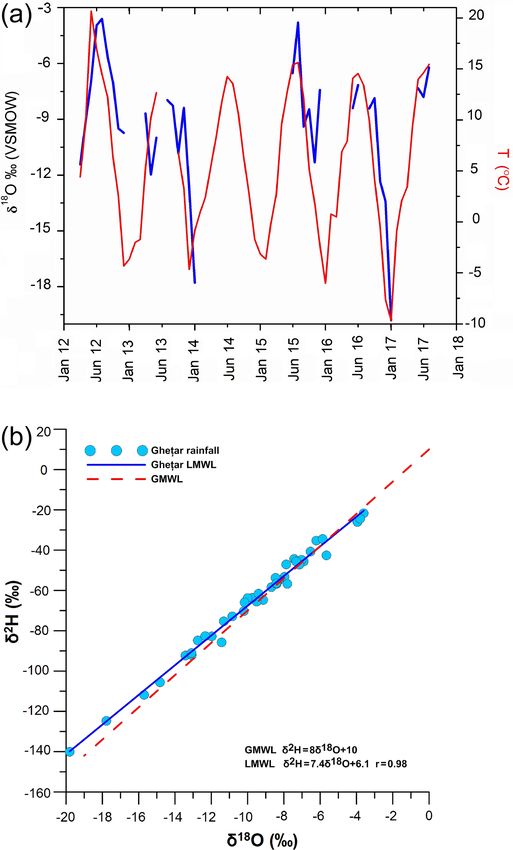
C.-A. Bădăluţă et al.: Summer temperatures in east-central Europe are linked to AMO variability                                     2447

Figure 1. Location of the Focul Viu Ice Cave (the red star) in Europe (a), a cross section (b) and map (c) of the cave (the red star indicates
the drilling site), and (d) a general view of the Great Hall (the person in yellow on the left is standing at the drilling site). The base map
in panel (a) is the digital elevation model (DEM), which was downloaded from http://geospatial.org (last access: 16 October 2020) and
processed in ArcGIS by CAB. The map in panel (b) is our own work (Aurel Pers, oiu), and the map in panel (c) is modified from our previous
work (Brad et al., 2018).

the registration of environmental signals by various proxies             ering into account), and each piece was subsequently sealed
(e.g., stable isotope composition of ice, pollen content) have           in plastic bags, allowed to melt at room temperature, trans-
been described from the nearby Scăris, oara Ice Cave (Pers, oiu         ferred to 20 mL HDPE (high-density poly ethylene) scintil-
and Pazdur, 2011; Feurdean et al., 2011) and, given the sim-             lation vials and stored at 4 ◦ C prior to analysis.
ilarities between the two caves, are also pertinent to Focul                 Precipitation samples were collected monthly be-
Viu Ice Cave. The one notable difference is the timing of the            tween March 2012 and December 2018 at Gheţar (GT,
onset of freezing: in Scăris, oara Ice Cave, the onset of freez-        46◦ 290 28.4500 N, 22◦ 490 26.0200 E; 1100 m a.s.l.; ∼ 13 km
ing is delayed until late autumn and early winter (Pers, oiu et          southeast of the FV) using collectors built according to
al., 2017), whereas in Focul Viu Ice Cave it starts in early             International Atomic Energy Agency (IAEA) specifications.
autumn.                                                                      Water samples were analyzed for stable isotope compo-
                                                                         sition at the Stable Isotope Laboratory, Ştefan cel Mare
                                                                         University (Suceava, Romania), using a Picarro L2130-i
3     Methods
                                                                         CRDS (cavity ring-down spectroscopy) analyzer connected
                                                                         to a high-precision vaporizing module. All samples were fil-
3.1    Drilling and stable isotope analyses
                                                                         tered through 0.45 µm nylon membranes before analysis and
The FV ice core (4.87 m long and 10 cm diameter) was                     were manually injected into the vaporization module mul-
drilled in May 2016 from the Great Hall of FV (Fig. 1d) using            tiple times until the standard deviation of the last four in-
a modified PICO electric drill (Koci and Kuivine, 1984) man-             jections was less than 0.03 for δ 18 O and less than 0.3 for
ufactured by Heavy Duties S.R.L, Cluj-Napoca, Romania. A                 δ 2 H. The average of these last four injections was normal-
rock embedded in the ice at 4.87 m below the surface stopped             ized on the SMOW–SLAP scale using two internal standards
the drilling effort, but previous work in the cave has shown             calibrated against VSMOW2 and SLAP2 standards provided
that the thickness of the ice block exceeds 15 m (Orghidan               by the IAEA and further used in our interpretation. A third
et al., 1984; Kern et al., 2004; Pers, oiu and Onac, 2019). The          standard was used to check the long-term stability of the an-
ice core was cut into 1 cm long pieces (taking the annual lay-           alyzer. The stable isotope values are reported using standard

https://doi.org/10.5194/cp-16-2445-2020                                                                Clim. Past, 16, 2445–2458, 2020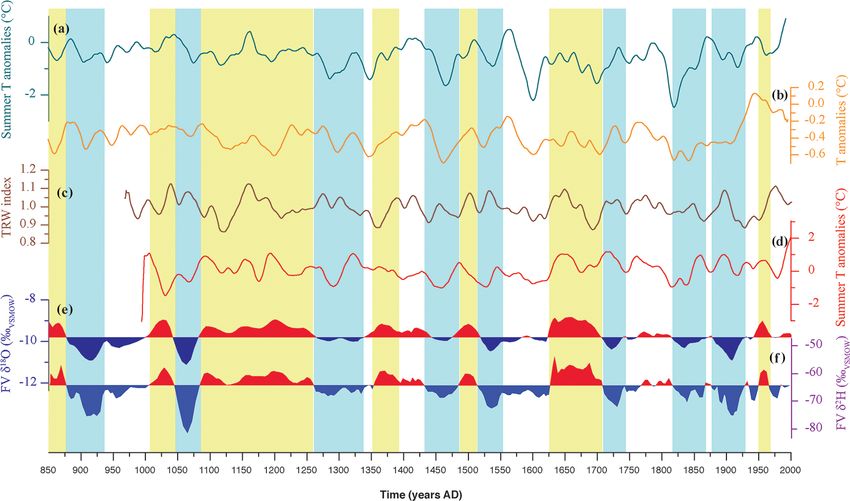
2448                      C.-A. Bădăluţă et al.: Summer temperatures in east-central Europe are linked to AMO variability

δ notation, and the precision is estimated to be better than     the model was 85 %, confirming a good statistical perfor-
0.1 ‰ for δ 18 O and better than 0.5 ‰ for δ 2 H based on re-    mance when the threshold of 60 % is surpassed. The sections
peated measurements of an internal standard.                     between the dated depths were assumed to have a constant
                                                                 deposition rate. The complete age–depth model is shown in
3.2    Radiocarbon dating and age–depth model
                                                                 Fig. 2. The mean age derived from the model was used for
       construction
                                                                 further analysis and is also reported in Table 1. The con-
                                                                 structed age–depth model was compared with that of Maggi
The wide opening to the surface in the ceiling of the Great      et al. (2008), plotted in green in Fig. 2, and a broad agreement
Hall (Fig. 1c) allows for a large volume of organic mat-         was found between both chronologies. All of our rejected
ter to fall into the cave and subsequently become trapped        ages are older than those of Maggi et al. (2008), and we sus-
in the ice, including large pieces of wood that tend to cut      pect that these were based on dating old wood that had al-
through layers of ice, with the latter possibly encompassing     ready been in the cave for decades before being incorporated
decades of ice accumulation. Furthermore, ice melting and        in the ice (see the “old wood effect” discussion above and
water freezing processes usually result in inclined ice sur-     Fig. 1c). Further, the same authors identified several poten-
faces and slow tipping of any heavy materials sitting on top     tial markers of volcanic eruptions, and their ages agree within
of the ice (see the position of tree trunks in Fig. 1). As a     ±40 years with those of our model. Another evaluation was
consequence, wood with an age older than that of the newly       obtained by comparing our stable isotope record with those
forming ice can be incorporated in the ice block, resulting      of Kern et al. (2004) and Forizs et al. (2004); although the
in sample ages much older than the ice layers (“old wood         latter lack a precise chronology, a simple visual correlation
effect”). However, the challenge of identifying such organic     between the records indicates a satisfactory match. In order
material contrasts with the desire for precise chronologies,     to avoid any circular reasoning, we decided against the use of
which rely on a high number of data points. Thus, all possi-     other records, e.g., the regional temperature record, to further
ble organic samples were recovered and dated, and unreliable     anchor our chronology.
ages that were identified at the stage of age–depth modeling
were removed. Out of 14 samples recovered from the ice core      3.3    Climate data
and potentially suitable for radiocarbon dating, two were not
datable due to their extremely small carbon yield. Acceler-      The sea surface temperature (SST) is extracted from ver-
ator mass spectrometry (AMS) radiocarbon analyses were           sion 5 of the Extended Reconstructed Sea Surface Temper-
performed at the Institute of Physics, Silesian University of    ature data (ERSSTv5) of Huang et al. (2018). This dataset
Technology, Poland (Piotrowska, 2013). All samples were          covers the period from 1854 to present and has a spatial
precleaned with standard acid–alkali–acid treatment, dried       resolution of 2◦ × 2◦ . The AMO index used in this study
and subjected to graphite preparation using an AGE-3 sys-        was obtained from https://climexp.knmi.nl/data/iamo_ersst_
tem (Ionplus, Switzerland) equipped with an Elementar vario      ts.dat (last access: 19 October 2020) and is also based on the
MICRO cube elemental analyzer and automated graphitiza-          ERSSTv5 dataset. Station-based meteorological data were
tion unit (Wacker et al., 2010; Nemec et al., 2010). The 14 C    provided by the Romanian National Meteorological Admin-
concentrations in graphite produced from unknown samples,        istration for three stations (Baia Mare, Sibiu and Timis, oara)
Oxalic Acid II standards and coal blanks of comparable car-      that have some of the longest instrumental records in Roma-
bon masses were measured by the DirectAMS laboratory,            nia and bracket the location of the study site. To remove the
Bothell, USA (Zoppi et al., 2007). The results are reported      short-term variability and retain only the multidecadal sig-
in Table 1. The radiocarbon dates were calibrated using Ox-      nal in our data, both the temperature time series and the SST
Cal v4.3 (Bronk Ramsey, 2009) and the IntCal13 calibration       data were smoothed with a 21-year running mean filter prior
curve (Reimer et al., 2013). The NH1 curve (Hua et al., 2013)    to correlation analysis.
was used for one post-bomb date.
   Because organic material can fall into the cave decades to
                                                                 4     Results and discussion
centuries before being trapped in the ice (see Fig. 1b), we
have carefully screened the radiocarbon results prior to age–    4.1    Ice accumulation in Focul Viu Ice Cave
depth modeling with the aim of selecting the most reliable
dates forming a chronological sequence. In total, four dates     The results of the radiocarbon analyses performed on organic
were selected for age–depth modeling. For the top of the ice     matter recovered from the ice are shown in Table 1, and the
core, a uniform age distribution from 1991 to 2016 CE was        age–depth model is displayed in Fig. 2. The maximum age of
assigned, allowing for the possibility of surface ice melting.   the ice is 1000 ± 20 cal BP at 4.45 m below surface, based on
The model was constructed using the OxCal P_Sequence al-         direct dating of organic remains (Table 1) and extrapolated
gorithm (Bronk Ramsey, 2008) with a variable prior k pa-         to 1100 cal BP at 4.86 m below surface
rameter (k = 1, U (−2, 2); Bronk Ramsey and Lee, 2013) and          High accumulation rates were recorded between 850 and
extrapolated to a depth of 4.86 m. The agreement index of        950 CE (0.39–0.41 cm yr−1 ) and between 1220 and 1970 CE

Clim. Past, 16, 2445–2458, 2020                                                     https://doi.org/10.5194/cp-16-2445-2020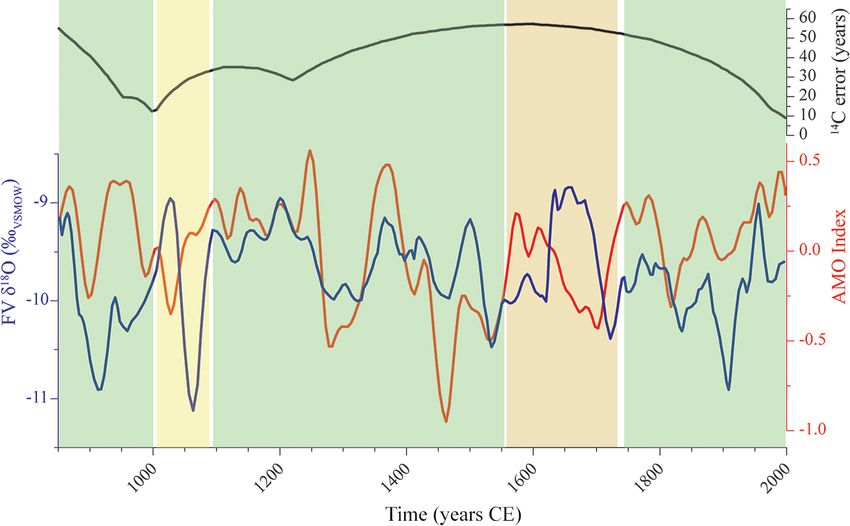
C.-A. Bădăluţă et al.: Summer temperatures in east-central Europe are linked to AMO variability                             2449

Table 1. Radiocarbon data from the Focul Viu Ice Cave. Agreement indices for individual samples based on the P_Sequence algorithm
(Bronk Ramsey, 2008) are provided for accepted dates. Modeled ages for all dated depths are given as mean and σ values, rounded to the
nearest five.

 No      Lab   Sample        Depth    Material        Graphite       14 C age   Status and    Calibrated age ranges,   Modeled age
        code   name           (cm)                       mass           (BP)    agreement     unmodeled (CE)            mean (CE)
       GdA-                                              (mg)                   index                                      and 1σ
 1      4889   FV’-5/19-       21.5   Needles and         0.86   −1410 ± 25     Accepted      68.2 % probability          1975 ± 20
               22                     leaves, small                             (A = 64 %)    1985–1988 CE (68.2 %)
                                      fragments                                               95.4 % probability
                                                                                              1958–1959 CE (9.6 %)
                                                                                              1985–1988 CE (85.8 %)
 2      5084   FV3/57-59         58   Leaf                0.54      525 ± 30    Rejected      68.2 % probability          1890 ± 45
                                      fragments                                               1400–1435 CE (68.2 %)
                                                                                              95.4 % probability
                                                                                              1320–1350 CE (14.9 %)
                                                                                              1390–1445 CE (80.5 %)
 3      4890   FV’/62-64         63   Large wood          1.00      875 ± 25    Rejected      68.2 % probability          1880 ± 45
                                      fragment                                                1150–1215 CE (68.2 %)
                                                                                              95.4 % probability
                                                                                              1045–1095 CE (18.1 %)
                                                                                              1120–1140 CE (4.6 %)
                                                                                              1145–1225 CE (72.7 %)
 4      5085   FV15/114-      114.5   Needle              0.25      470 ± 50    Rejected      68.2 % probability          1760 ± 60
               115                    fragment,                                               1405–1465 CE (68.2 %)
                                      small                                                   95.4 % probability
                                                                                              1320–1350 CE (4.8 %)
                                                                                              1390–1520 CE (87.1 %)
                                                                                              1595–1620 CE (3.5 %)
 5      4891   FV3-           155.5   Small wood          0.61      570 ± 25    Rejected      68.2 % probability          1665 ± 65
               10/155-156             fragment                                                1320–1350 CE (40.2 %)
                                                                                              1390–1410 CE (28.0 %)
                                                                                              95.4 % probability
                                                                                              1305–1365 CE (57.6 %)
                                                                                              1385–1420 CE (37.8 %)
 6      5086   FV6-4/232-     232.5   Needles and         0.14     1045 ± 70    Rejected      68.2 % probability          1490 ± 65
               235                    leaves, small                                           890–1040 CE (68.2 %)
                                      fragments                                               95.4 % probability
                                                                                              780–795 CE (1.3 %)
                                                                                              805–845 CE (2.6 %)
                                                                                              860–1160 CE (91.5 %)
 7      4892   FV7/276-         277   Large wood          0.99      960 ± 35    Rejected      68.2 % probability          1390 ± 60
               278                    fragment                                                1020–1050 CE (22.4 %)
                                                                                              1080–1125 CE (34.5 %)
                                                                                              1135–1150 CE (11.3 %)
                                                                                              95.4 % probability
                                                                                              1015–1160 CE (95.4 %)
 8      5087   FV8-3/308-       311   Small plant         0.90      925 ± 25    Rejected      68.2 % probability          1310 ± 50
               310                    fragments                                               1040–1100 CE (42.8 %)
                                                                                              1120–1155 CE (25.4 %)
                                                                                              95.4 % probability
                                                                                              1030–1165 CE (95.4 %)
 9      4893   FV9-             349   Leaves,             0.99      780 ± 35    Accepted      68.2 % probability          1225 ± 30
               14/348-350             fragments                                 (A = 72 %)    1220–1270 CE (68.2 %)
                                                                                              95.4 % probability
                                                                                              1190–1285 CE (95.4 %)

https://doi.org/10.5194/cp-16-2445-2020                                                          Clim. Past, 16, 2445–2458, 2020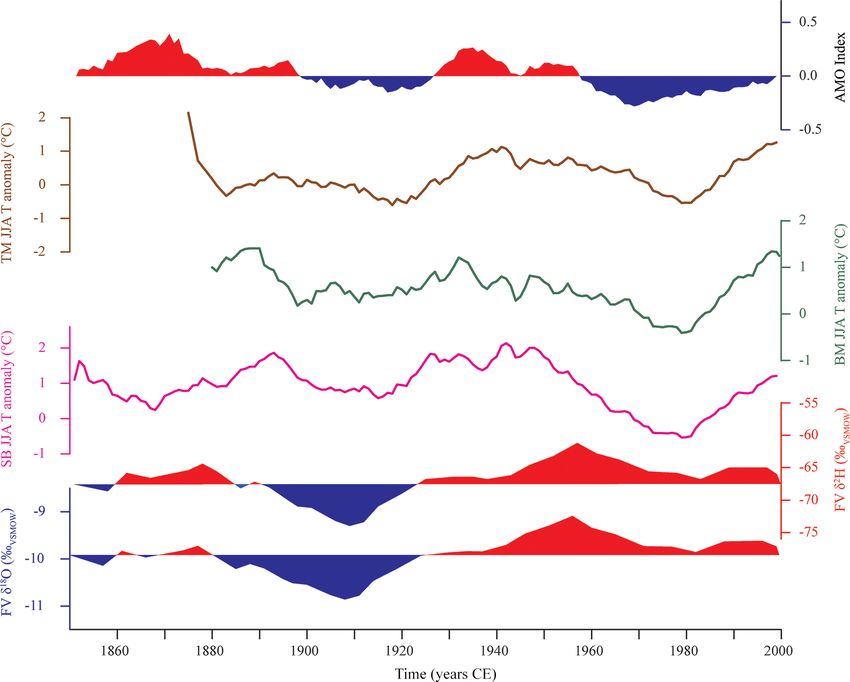
2450 C.-A. Bădăluţă et al.: Summer temperatures in east-central Europe are linked to AMO variability
Table 1. Continued.
No Lab Sample Depth Material Graphite 14 C age Status and Calibrated age ranges, Modeled age
code name (cm) mass (BP) agreement unmodeled (CE) mean (CE)
GdA- (mg) index and 1σ
10 5089 FV11- 430.5 Small plant 0.61 1030 ± 20 Accepted 68.2 % probability 1000 ± 15
19/428-433 fragments (A = 97 %) 990–1020 CE (68.2 %)
95.4 % probability
980–1030 CE (95.4 %)
11 5090 FV12- 445 Small plant 0.41 1140 ± 20 Accepted 68.2 % probability 950 ± 25
2/444-446 fragments (A = 90 %) 885–905 CE (19.7 %)
915–965 CE (48.5 %)
95.4 % probability
775–790 CE (3.1 %)
805–820 CE (1.1 %)
825–845 CE (2.3 %)
860–980 CE (88.9 %)
(0.36–0.44 cm yr−1 ). Between 950 and 1220 CE, the net ac-
cumulation rate dropped to between 0.29 and 0.34 cm yr−1 .
The highest net accumulation rates recorded after 1970 CE
(0.56 cm yr−1 ) contradict recent findings from other ice caves
in the Carpathian Mountains (Kern and Pers, oiu, 2013),
which all register record melting. However, this value might
be an artifact of the age–depth modeling (see above) as well
as of the very short time span considered; thus, it is unreliable
for further interpretation. The low accumulation rates span-
ning the MWP are similar to those recorded in the Scăris, oara
Ice Cave (Pers, oiu et al., 2017, Bădăluţă, 2019), the Hund-
salm ice cave in Austria (Spötl et al., 2014) and the ice caves
in the Velebit Mountains in Croatia (Kern et al., 2018), po-
tentially suggesting a regional signal of climatic conditions
unfavorable for ice accumulation. Ice can melt as a result of
either warm summers with enhanced conductive heat trans-
fer to the cave or wet summers with rapid ablation result-
ing from water flowing across the top of the ice block. Sub-
sequently, ice growth is influenced by the amount of water
present at the onset of freezing, the timing of this onset and
its duration. The low accumulation rates during the MWP
were likely the result of enhanced melting during warm (see
Sect. 4.2 below) and wet (Feurdean et al., 2015) conditions.
After 1450 CE, the climate in the region was dominated by
dry summers with frequent storms and cold winters (Pers, oiu,
2017). These conditions led to reduced summer melting and
enhanced winter growth, which are conditions favorable for
net ice accumulation.
Figure 2. Age–depth model of the Focul Viu ice core. The cali- 4.2 Stable isotopes in Focul Viu cave ice – a proxy for
brated age range of samples used in the model is indicated in blue; summer air temperatures and AMO variability
rejected samples are indicated in red. Samples in green are from
the ice core drilled in 2004 (Maggi et al., 2008). Dark and light The variability of δ 18 O and δ 2 H in precipitation at Gheţar
blue shading indicates the 95 % and 68 % confidence ranges of the (∼ 13 km south of the cave’s location and at the same al-
model, respectively. titude), assessed for the 2012–2017 CE period, follows that
of temperature (Fig. 3a), with the maximum values (−3.6 ‰
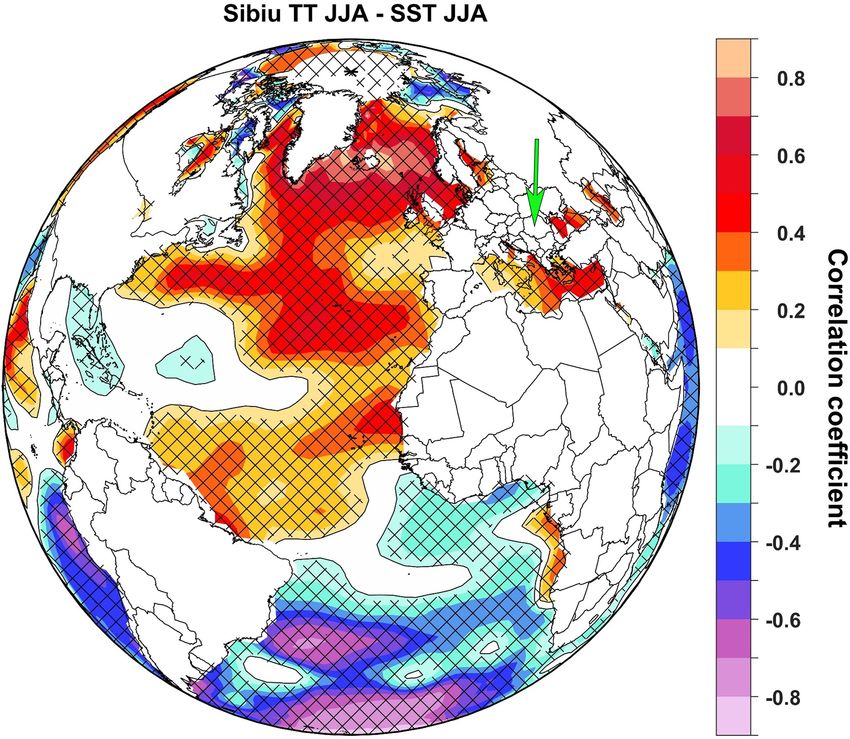
Clim. Past, 16, 2445–2458, 2020 https://doi.org/10.5194/cp-16-2445-2020C.-A. Bădăluţă et al.: Summer temperatures in east-central Europe are linked to AMO variability 2451 and −26 ‰ for δ 18 O and δ 2 H, respectively) in July and Au- gust and the minimum values (−19.8 ‰ and −140 ‰ for δ 18 O and δ 2 H, respectively) in January. Similar results were found by Bojar et al. (2009) and Ersek et al. (2018) for the same region, suggesting that the 18 O / 16 O and 2 H / 1 H ratios in precipitation register temperature changes on a regional scale. The Local Meteoric Water Line, defined by the equa- tion δ 18 O = 7.4 × δ 2 H + 6.1 (Fig. 3b), has a slope and inter- cept very similar to those found by Ersek et al. (2018). Pre- cipitation in the region is mainly delivered by weather sys- tems carrying moisture from the Atlantic Ocean, with the Mediterranean Sea contributing moisture during autumn and winter (Nagavciuc et al., 2019b). The deuterium excess in precipitation (d-excess or d), defined as d = δ 2 H − 8 × δ 18 O (Dansgaard, 1964) allows for a clear separation of the air masses: the Atlantic Ocean (d-excess close to the global av- erage of 10; Craig, 1961) and the Mediterranean Sea (d- excess between 12 and 17, resulting from the high evapora- tive conditions in the eastern Mediterranean Sea). Similarly high values of d-excess have been measured in precipitation in southwestern Romania (Drăgus, in et al., 2017) and in pre- cipitation in northeastern Romania (Bădăluţă et al., 2019) and have been linked to air masses originating in the strongly evaporated Mediterranean and Black seas, respectively. Observations on the dynamics of cave ice during the past 18 years have shown that it starts to grow in early autumn due to the freezing of water accumulated during summer. As the ceiling of the cave is opened to the outside, precipita- tion directly reaches the site of ice formation; thus, the sta- ble isotope composition of precipitation is not modified in the epikarst above the cave, and the original δ 18 O and δ 2 H values of summer (June–July–August, JJA) precipitation are preserved in the cave water. However, while freezing pro- cesses in caves could alter the original δ 18 O (and δ 2 H) values in cave ice, several studies have shown (e.g., in the nearby Figure 3. (a) Temporal variability of δ 18 O and δ 2 H in precipitation Scăris, oara Ice Cave; Pers, oiu et al., 2011b) that the original and air temperature at Gheţar (10 km south of the Focul Viu Ice climatic signal embedded in the stable isotope composition Cave and at the same altitude). (b) The Local Meteoric Water Line of cave ice is preserved and can be used as a proxy for exter- (LMWL) of precipitation at the same station, plotted against the nal climate variability. Global Meteoric Water Line (GMWL). Overall, our observations of cave ice genesis and dynamics and the stable isotope monitoring data clearly indicate that summer air temperatures are registered and preserved in the and enhanced warming after 1980 CE, which all follow the ice block in the FV. In order to test the long-term stability of AMO variability. The δ 18 Oice values show a similar temporal these connections, we have analyzed the links between the evolution, with the slight offsets between the observational FV δ 18 Oice record and instrumental data from three nearby data and δ 18 O likely being due to the dating uncertainty (20– meteorological stations over the 1851–2016 CE period. On 35 years). Further, we have computed the correlation map be- multidecadal timescales, summer air temperature changes in tween the summer mean air temperature at SB station (with the region are mainly controlled by the dynamics of the At- the longest instrumental record) and the summer SST as indi- lantic Multidecadal Oscillation (Ionita et al., 2012). Figure 4 cator of AMO variability (Sutton and Dong, 2012). Figure 5 shows the JJA air temperature at the Baia Mare (BM), Sibiu clearly shows that positive (negative) temperature anomalies (SB) and Timis, oara (TM) stations, the AMO index and the over the analyzed region are associated with positive (nega- FV δ 18 Oice . The instrumental temperature data indicate large tive) SST anomalies over the North Atlantic Ocean, resem- multidecadal variability, with a cold period between 1890 bling the SST anomalies associated with the positive (neg- and 1920 CE, followed by a warm period between 1921 and ative) phase of the AMO (Mesta-Nuñez and Enfield 1999; 1960 CE, a slightly colder period between 1960 and 1980 CE Latif et al., 2004; Knight et al., 2005). The strongest corre- https://doi.org/10.5194/cp-16-2445-2020 Clim. Past, 16, 2445–2458, 2020
2452                        C.-A. Bădăluţă et al.: Summer temperatures in east-central Europe are linked to AMO variability

Figure 4. Temporal variability of the Atlantic Multidecadal Oscillation instrumental index; summer (JJA) air temperature (anomalies with
respect to the 1961–1990 CE period) recorded at the Baia Mare (BM), Timis, oara (TM) and Sibiu (SB) weather stations; and FV δ 18 O
and δ 2 H (‰) during the instrumental period. In the lower panels, the positive (red) and negative (blue) anomalies are shown against the
1850–2000 CE averages for the FV δ values.

lations (Fig. 5) are found between local air temperature and           tion that are further recorded by climate proxies: stable iso-
SSTs in the North Atlantic and the eastern Mediterranean               topes in cave ice (this study) and tree ring parameters (width
Sea, which are the main sources of moisture feeding local              and cellulose stable isotopes) (Popa and Kern, 2009; Nagav-
precipitation (Bădăluţă et al., 2019). These results are also in   ciuc et al., 2019a). The increased contribution of recycled
agreement with the results of Della-Marta et al. (2007), who           moisture to precipitation has been reported from several lo-
showed that summer positive temperature anomalies and heat             cations in central Europe, further supporting our inference
waves over Europe are triggered, at least partially, by the            (Goìmez-Hernaìndez et al., 2013; Kern et al., 2020).
phase of the AMO. A recent study of δ 18 O variability in                 Combining all of the abovementioned data, we find that,
oak tree rings in northwestern Romania (∼ 75 km north of               on timescales ranging from years to decades, prolonged pe-
our site) also indicated the influence of the AMO on sum-              riods of positive temperature anomalies throughout the sum-
mer temperatures and drought conditions (Nagavciuc et al.,             mer months, linked to prolonged warm SSTs in the North
2019a). Thus, we suggest that, during summer, strongly me-             Atlantic Ocean (and thus a positive AMO index), could be
andering Rossby waves (Ionita et al., 2015, 2017) result in            preserved by the δ 18 Oice in FV.
blocking conditions over central Europe that lead to the per-             The FV δ 18 Oice and δ 2 Hice records span the 850–2016 CE
sistence of high-pressure systems and the occurrence of re-            period (Fig. 6). Decadal- to multidecadal-scale oscillations
gional heat waves. These, in turn, favor regional recycling of         occur over the entire record, but no discernable long-term
moisture, resulting in positive δ 18 O anomalies in precipita-         trend has been identified. Several periods of excursions

Clim. Past, 16, 2445–2458, 2020                                                           https://doi.org/10.5194/cp-16-2445-2020
C.-A. Bădăluţă et al.: Summer temperatures in east-central Europe are linked to AMO variability                            2453

                                                                     ship between the FV δ 18 Oice and AMO records (Wang et al.,
                                                                     2017) is strongest between 1125 and 1525 CE and 1750 and
                                                                     2016 CE, with decadal-scale variability in the two records be-
                                                                     ing synchronous. Peak-to-peak matching of the FV δ 18 Oice
                                                                     and AMO records shows that the two records correlate well
                                                                     within the dating uncertainty (±30 years) during the past
                                                                     1000 years. However, peak-to-peak matching indicates a dif-
                                                                     ference between the two records of up to ∼ 50 years between
                                                                     ∼ 1600 and 1750 CE (Fig. 7), which is likely the result of
                                                                     high (> 50 years) uncertainty in the ice core chronology be-
                                                                     tween 1525 and 1750 CE (Fig. 7). The combined correlations
                                                                     between (1) FV δ 18 Oice and instrumental summer tempera-
                                                                     ture reconstruction over the past 150 years, (2) the instrumen-
                                                                     tal (this study) and proxy-based (Nagavciuc et al., 2019a)
                                                                     summer air temperatures and AMO variability, and (3) the
                                                                     FV δ 18 Oice and AMO records over the past 1000 years
                                                                     suggest that changes in the North Atlantic are transferred,
                                                                     likely via atmospheric processes, towards the wider North-
                                                                     ern Hemisphere, resulting in hemisphere-wide climatic re-
Figure 5. Spatial correlation map between sea surface temperature
(SST) and average summer (JJA, June–July–August) air tempera-
                                                                     sponses to these changes.
ture at Sibiu (60 km south of Focul Viu Ice Cave, indicated by the      The FV δ 18 Oice record is in agreement with other sum-
green arrow) over the 1850–2011 CE period.                           mer temperature reconstructions (e.g., Buntgen et al., 2011)
                                                                     at both regional and hemispheric scales (Fig. 6). Further,
                                                                     regional summer temperature (e.g., Popa and Kern, 2009)
                                                                     and summer temperature-sensitive drought (Seim et al.,
towards low δ 18 O values (defined as δ 18 Oice below the            2012) reconstructions show warm peaks around 1320 CE,
long-term average), indicating low summer temperatures               1420 CE, 1560 CE and 1780 CE and cold ones at around
have been observed at 875–930 CE, 1050–1080 CE, 1260–                1260 CE, 1450 CE and 1820 CE, similar to reconstructions
1330 CE, 1430–1480 CE, 1520–1550 CE, 1710–1750 CE,                   and models at the global level (Neukom et al., 2019) and the
1820–1870 CE and 1880–1930 CE. Significant maxima in                 FV temperature reconstruction (this study). Contrary to the
the FV δ 18 Oice record occurred during 850–870 CE, 1000–            summer season temperature reconstructions, a late-autumn
1050 CE, 1080–1260 CE, 1350–1390 CE, 1480–1520 CE,                   through early-winter season temperature reconstruction from
1625–1710 CE and 1950–1970 CE (Fig. 6). Both the δ 18 Oice           the nearby Scăris, oara Ice Cave (Pers, oiu et al., 2017) shows
and δ 2 Hice records display a remarkable similarity through-        that the MWP was rather warm and also wet (Feurdean et
out the entire period; thus, we have relied solely on the δ 18 O     al., 2011), whereas the LIA was cold and likely dry, with er-
record in our discussion. We have compared the FV δ 18 Oice          ratically distributed precipitation. Together, these data sug-
with a tree ring width-based reconstruction of summer (JJA)          gest a complex picture of climate variability in the wider
temperature anomalies from the Eastern Carpathian Moun-              Carpathian region, with much of the yearly temperature vari-
tains (Popa and Kern, 2009). The highest similarities be-            ability during the past 1000 years being attributed to the in-
tween the FV ice core and summer temperature records were            fluence of winter conditions.
found for the cold periods during 1260–1330 CE, 1430–
1480 CE, 1520–1550 CE and 1820–1870 CE and the warm
periods during 1080–1260 CE, 1625–1710 CE and 1950–                  5   Conclusions
1970 CE (Fig. 6). Given the very different nature of the two
archives (trees vs. cave ice), of the proxies (tree ring width       The analysis of the oxygen and hydrogen stable isotope ra-
and δ 18 O) and of the chronologies (annual tree ring counting       tios along a ∼ 5 m long ice core extracted from the Focul Viu
vs. 14 C dating with a ±30-year error), the two records agree        Ice Cave (northwest Romania) provided an unprecedented
remarkably well, further supporting the hypothesis that δ 18 O       view on the dynamics of summer air temperature and at-
and δ 2 H values in the FV ice core register both summer air         mospheric circulation changes during the past 1000 years in
temperature variability during the past ca. 1000 years in east-      east-central Europe. The comparison of ice core δ 18 O (and
central Europe and, on a broader spatial scale, the variability      δ 2 H) with instrumental data over the past 150 years indicates
of the AMO.                                                          that the stable isotope composition of cave ice records the
   Similar to the 1850–2016 CE interval described above,             summer air temperatures on multidecadal timescales. Given
the stable isotope record closely mirrors the AMO variabil-          the apparent relationship between our stable isotope record
ity over the entire studied interval (Fig. 7). The relation-         and both instrumental and proxy-derived records of the At-

https://doi.org/10.5194/cp-16-2445-2020                                                         Clim. Past, 16, 2445–2458, 2020
2454 C.-A. Bădăluţă et al.: Summer temperatures in east-central Europe are linked to AMO variability Figure 6. Summer climatic conditions recorded by δ 18 O and δ 2 H from the FV ice core (panels e and f, bottom) and comparison with proxy indicators from the Northern Hemisphere: (a) central European summer temperature anomalies (against the 1901–2000 CE mean; Buntgen et al., 2011); (b) Northern Hemisphere air temperature anomalies (against the 1961–1990 CE mean; D’Arrigo et al., 2006), (c) tree ring width index from Albania, southeastern Europe (Seim et al., 2012); (d) summer temperature anomalies in Romania (against the 1961–1990 CE mean; Popa and Kern, 2009). Blue and yellow shaded areas indicate cold and warm periods, respectively. Figure 7. Temporal variability of the FV δ 18 O (blue), the reconstructed AMO index (Wang et al., 2017), and the 14 C measurement uncer- tainty between 850 and 2000 CE. Shading indicates the offset (in years) between the FV δ 18 O and AMO index values: green denotes less than 20 years, yellow denotes between 20 and 50 years and orange denotes above 50 years. Clim. Past, 16, 2445–2458, 2020 https://doi.org/10.5194/cp-16-2445-2020
C.-A. Bădăluţă et al.: Summer temperatures in east-central Europe are linked to AMO variability                                  2455

lantic Multidecadal Oscillation (AMO), we further suggest             Acknowledgements. We thank the administration of the Apuseni
that δ 18 Oice in the Focul Viu Ice Cave can be used to in-           National Park for granting us permission to drill in the Focul Viu Ice
fer past AMO variability. We subsequently hypothesize that            Cave, Nicodim Pas, ca for collecting precipitation samples, Chris-
changes in summer climatic conditions over the Northern At-           tian Ciubotărescu for help during the ice core drilling effort, and
lantic are transferred through atmospheric processes across           Vlad Murariu (Heavy Duties, Romania) for developing and con-
                                                                      structing the drilling equipment. We thank the editor and three
the Northern Hemisphere, influencing summer temperatures
                                                                      anonymous reviewers for comments that helped us improve the
across Europe. However, we emphasize that given the ±30-              original paper, and Simon Hutchinson (University of Salford, UK)
year uncertainty in the chronology, detailed studies using bet-       and Sara Asha Burgess for further suggestions and corrections.
ter constrained age models (e.g., tree-ring-based proxies) are
required to test this hypothesis.
   The data show little centennial-scale summer tempera-              Financial support. This      research has been supported by
ture variability since the onset of the Medieval Warm Period          the EEA Financial Mechanism 2009–2014 (project contract
and through the Little Ice Age. Nevertheless, well-expressed          no. CLIMFOR18SEE), EEA Financial Mechanism 2014–2021
minima and maxima occurred synchronously with data from               (project contract no. 3/2019; KARSTHIVES), and UEFISCDI
other records in the region and through Europe, suggesting            Romania (grants nos. PNIII-P1-1.1-TE-2016-2210 and PNII-
that the stable isotope composition from cave ice records a           RU-TE-2014-4-1993). The article processing charges for this
regional climatic signal. In contrast, winter air temperature         open-access publication were covered by the EXCALIBUR project
records from the region indicate colder conditions during the         of the Ştefan cel Mare University of Suceava, Romania.
LIA compared with the MWP, pointing towards a seasonally
distinct climatic signal during these two periods. This sug-
                                                                      Review statement. This paper was edited by Barbara Stenni and
gests that forcing factors acting seasonally had a strong im-
                                                                      reviewed by three anonymous referees.
print on temperature variability, overriding long-term, global
forcing.
   Our results offer a potential hypothesis to be further tested
by extending this and similar records back in time and also           References
incorporating other proxy-base reconstructions to investigate
                                                                      Bădăluţă C.-A: Reconstruction of air temperature during the last
the spatial extent of the influence of North Atlantic climate
                                                                         1000 years based on the stable isotope analysis of ice deposits in
further east.
                                                                         caves from the Apuseni Mountains, Romania, PhD thesis, Stefan
                                                                         cel Mare University of Suceava, Suceava, Romania, 2019.
                                                                      Bădăluţă, C.-A., Persoiu, A., Ionita, M., Nagavciuc, V., and
Data availability. The Focul Viu δ 18 O and δ 2 H data as well as        Bistricean, P. I.: Stable H and O isotope-based investi-
the 14 C data and the modeled ages will be made available on             gation of moisture sources and their role in river and
the NOAA World Data Service for Paleoclimatology web page                groundwater recharge in the NE Carpathian Mountains,
(https://www.ncdc.noaa.gov/paleo-search/, last access: 9 December        East-Central Europe, Isot. Environ. Healt. S., 55, 161–178,
2020). The meteorological data plotted in Fig. 4 were provided by        https://doi.org/10.1080/10256016.2019.1588895, 2019.
the Romanian National Meteorological Administration, except for       Bojar, A, Ottner, F., Bojar, H. P., Grigorescu, D., and Persoiu, A.:
the AMO data that were downloaded from https://climexp.knmi.             Stable isotope and mineralogical investigations on clays from the
nl/data/iamo_ersst_ts.dat (last access: 7 December 2020), which          Late Cretaceous sequences, Haţeg Basin, Romania, Appl. Clay
are created and maintained by the Royal Netherlands Meteorolog-          Sci., 45, 155–163, https://doi.org/10.1016/j.clay.2009.04.005,
ical Institute (https://www.knmi.nl, last access: 7 December 2020).      2009.
The paleoclimate data used to plot Fig. 6a were downloaded from       Brad, T., Bădăluţă, C.-A., and Persoiu, A.: Ice caves in Ro-
the NOAA World Data Service for Paleoclimatology web page                mania, in: Ice caves, edited by: Pers, oiu, A. and Lau-
(https://www.ncdc.noaa.gov/paleo-search/).                               ritzen, S.-E., Elsevier, Amsterdam, Netherlands, 511–528,
                                                                         https://doi.org/10.1016/B978-0-12-811739-2.00025-5, 2018.
                                                                      Bronk Ramsey, C.: Bayesian analysis of radiocarbon dates, Radio-
Author contributions. CAB and AP designed the project, AP and            carbon, 51, 337–360, 2009.
CAB collected the ice core, and CAB performed the stable isotope      Bronk Ramsey, C.: Deposition models for chrono-
analyses. NP performed the radiocarbon analyses and constructed          logical records, Quaternary Sci. Rev., 27, 42–60,
the age–depth model. MI analyzed the climate and large-scale cir-        https://doi.org/10.1016/j.quascirev.2007.01.019, 2008.
culation data. CAB and AP wrote the text, with input from MI and      Bronk Ramsey, C. and Lee, S.: Recent and Planned Devel-
NP.                                                                      opments of the Program OxCal, Radiocarbon, 55, 720–730,
                                                                         https://doi.org/10.1017/S0033822200057878, 2013.
                                                                      Büntgen, U., Tegel, W., Nicolussi, K., McCormick, M., Frank, D.,
Competing interests. The authors declare that they have no con-          Trouet, V., Kaplan, J. O., Herzig, F., Heussner, K.-U., Wanner,
flict of interest.                                                       H., Luterbacher, J., and Esper, J.: 2500 Years of European Cli-
                                                                         mate Variability and Human Susceptibility, Science, 331, 578–
                                                                         582, https://doi.org/10.1126/science.1197175, 2011.

https://doi.org/10.5194/cp-16-2445-2020                                                             Clim. Past, 16, 2445–2458, 2020
2456 C.-A. Bădăluţă et al.: Summer temperatures in east-central Europe are linked to AMO variability
Citterio, M., Turri, S., Pers, oiu, A., Bini, A., and Maggi, V.: Ra- Haustein, K., Allen, M. R., Forster, P. M., Otto, F. E. L.,
diocarbon ages from two ice caves in the Italian Alps and the Mitchell, D. M., Matthews, H. D., and Frame, D. J.:
Romanian Carpathians and their significance, in: Glacier Caves A real-time Global Warming Index, Sci. Rep., 7, 15417,
and Glacial Karst in High Mountains and Polar Regions, edited https://doi.org/10.1038/s41598-017-14828-5, 2017.
by: Mavlyudov, B. R., Institute of geography of the Russian Holmlund, P., Onac, B. P., Hansson, M., Holmgren, K., Morth,
Academy of Sciences, Moscow, Russia, 87–92, 2005. M., Nyman, M., and Persoiu, A.: Assessing the palaeo-
Colucci, R. R. and Guglielmin, M.: Climate change and rapid ice climate potential of cave glaciers: the example of the
melt: Suggestions from abrupt permafrost degradation and ice Scăris, oara Ice Cave (Romania), Geogr. Ann. A, 87, 193–201,
melting in an alpine ice cave, Prog. Phys. Geog., 43, 561–573, https://doi.org/10.1111/j.0435-3676.2005.00252.x, 2005.
https://doi.org/10.1177/0309133319846056, 2019. Hua, Q., Barbetti, M., and Rakowski, A. Z.: Atmospheric Radio-
Colucci, R. R., Fontana, D., Forte, E., Potleca, M., and carbon for the Period 1950–2010, Radiocarbon, 55, 2059–2072,
Guglielmin, M.: Response of ice caves to weather extremes https://doi.org/10.2458/azu_js_rc.v55i2.16177, 2013.
in the southeastern Alps, Europe, Geomorphology, 261, 1–11, Huang, B., Angel, W., Boyer, T., Cheng, L., Chepurin, G., Freeman,
https://doi.org/10.1016/j.geomorph.2016.02.017, 2016. E., Liu, C., and Zhang, H.-M.: Evaluating SST analyses with in-
Coumou, D. and Rahmstorf, S.: A decade of dependent ocean profile observations, J. Climate, 31, 5015–5030,
weather extremes, Nat. Clim. Change, 2, 491–496, https://doi.org/10.1175/JCLI-D-17-0824.1, 2018.
https://doi.org/10.1038/nclimate1452, 2012. Ionita, M., Rimbu, N., Chelcea, S., and Patrut, S.: Multidecadal vari-
Craig, H.: Isotopic variations in meteoric waters, Science, ability of summer temperature over Romania and its relation with
133, 1702–1703, https://doi.org/10.1126/science.133.3465.1702, Atlantic Multidecadal Oscillation, Theor. Appl. Climatol., 113,
1961. 305–315, https://doi.org/10.1007/s00704-012-0786-8, 2012.
Dansgaard, W.: Stable isotope in precipitation, Tellus, 16, 436–438, Ionita M., Boroneant, C., and Chelcea, S.: Seasonal modes
https://doi.org/10.1111/j.2153-3490.1964.tb00181.x, 1964. of dryness and wetness variability over Europe and their
D’Arrigo, R., Wilson, R., and Jacoby, G.: On the long-term con- connections with large scale atmospheric circulation and
text for late twentieth century warming, J. Geophys. Res., 111, global sea surface temperature. Clim. Dynam., 45, 2803,
D03103, https://doi.org/10.1029/2005JD006352, 2006. https://doi.org/10.1007/s00382-015-2508-2, 2015.
Della-Marta, P. M., Luterbacher, J., von Weissenfluh, H., Xo- Ionita, M., Tallaksen, L. M., Kingston, D. G., Stagge, J. H.,
plaki, E., Brunet, M., and Wanner, H.: Summer heat waves Laaha, G., Van Lanen, H. A. J., Scholz, P., Chelcea, S. M.,
over western Europe 1880–2003, their relationship to large and Haslinger, K.: The European 2015 drought from a clima-
scale forcings and predictability, Clim. Dynam., 29, 251–275, tological perspective, Hydrol. Earth Syst. Sci., 21, 1397–1419,
https://doi.org/10.1007/s00382-007-0233-1, 2007. https://doi.org/10.5194/hess-21-1397-2017, 2017.
Drăguşin, V., Balan, S., Blamart, D., Forray, F. L., Marin, C., Mirea, IPCC: Global warming of 1.5◦ C. An IPCC Special Report, Geneva,
I., Nagavciuc, V., Orăşeanu, I., Perşoiu, A., Tîrlă, L., Tudorache, Switzerland, https://doi.org/10.1017/CBO9781107415324,
A., and Vlaicu, M.: Transfer of environmental signals from the 2018.
surface to the underground at Ascunsă Cave, Romania, Hydrol. Jones, P. D. and Mann, M. E.: Climate over the past millennia, Rev.
Earth Syst. Sci., 21, 5357–5373, https://doi.org/10.5194/hess-21- Geophys., 42, RG2002, https://doi.org/10.1029/2003RG000143,
5357-2017, 2017. 2004.
Ersek, V., Onac, B. P., and Pers, oiu, A.: Kinetic processes Jones, P. D., Briffa, K. R., Osborn, T. J., Lough, J. M., van Om-
and stable isotopes in cave dripwaters as indicators men, T. D., Vinther, B. M., Luterbacher, J., Wahl, E. R., Zwiers,
of winter severity, Hydrol. Process., 32, 2856–2862, F. W., Mann, M. E., Schmidt, G. A., Ammann, C. M., Buck-
https://doi.org/10.1002/hyp.13231, 2018. ley, B. M., Cobb, K. M., Esper, J., Goosse, H., Graham, N.,
Feurdean, A., Persoiu, A., Pazdur, A., and Onac, B. P.: Jansen, E., Kiefer, T., Kull, C., Küttel, M., Mosley-Thompson,
Evaluating the palaeoecological potential of pollen recov- E., Overpeck, J. T., Riedwyl, N., Schulz, M., Tudhope, A. W.,
ered from ice in caves: a case study from Scarisoara Villalba, R., Wanner, H., Wolff, E., and Xoplaki, E.: High-
Ice Cave, Romania, Rev. Palaeobot. Palyno., 165, 1–10, resolution palaeoclimatology of the last millennium: A review
https://doi.org/10.1016/j.revpalbo.2011.01.007, 2011. of current status and future prospects, The Holocene, 19, 3–49,
Feurdean, A., Galka, M, Kuske, E., Tanţău, I., Lamentowicz, M., https://doi.org/10.1177/0959683608098952, 2009.
Florescu, G., Liakka, J., Hutchinson, S. M., Mulch, A., and Kaplan, A., Cane, M. A., Cushnir, Y., Clement, A. C., Blumenthal,
Hickler, T.: Last Millennium hydro-climate variability in Central M. B., and Rajagopala, B.: Analyses of global sea surface tem-
Eastern Europe (Northern Carpathians, Romania), Holocene, 25, perature 1856–1991, J. Geophys. Res., 103, 18567–18589, 1998.
1179–1192, https://doi.org/10.1177/0959683615580197, 2015. Kern, Z. and Persoiu, A.: Cave ice – the imminent
Fórizs, I., Kern, Z., Szántó, Z., Nagy, B., Palcsu, L., and Molnár, loss of untapped mid-latitude cryospheric palaeoen-
M.: Environmental isotopes study on perennial ice in the Focul vironmental archives, Quaternary Sci. Rev., 67, 1–7,
Viu Ice Cave, Bihor Mountains, Romania, Theor. App. Karst., https://doi.org/10.1016/j.quascirev.2013.01.008, 2013.
17, 61–69, 2004. Kern, Z., Fórizs, I., Nagy, B., Kázmér, M., Gál, A., Szánto,
Gómez-Hernández, M., Drumond, A., Gimeno, L., and Garcia- Z., Palcsu, L., and Molnár, M.: Late Holocene environmental
Herrera, R.: Variability of moisture sources in the Mediterranean changes recorded at Gheţarul de la Focul Viu, Bihor Mountains,
region during the period 1980–2000, Water Resour. Res., 49, Romania, Theor. App. Karst., 17, 51–60, 2004.
6781–6794, 2013. Kern, Z., Molnár, M., Svingor, É., Persoiu, A., and Nagy, B.: High-
resolution, well-preserved tritium record in the ice of Bortig Ice
Clim. Past, 16, 2445–2458, 2020 https://doi.org/10.5194/cp-16-2445-2020C.-A. Bădăluţă et al.: Summer temperatures in east-central Europe are linked to AMO variability 2457 Cave, Bihor Mountains, Romania, The Holocene, 19, 729–736, Mavlyudov, B. R.: Ice genesis and types of ice caves, in: Ice caves, https://doi.org/10.1177/0959683609105296, 2009. edited by: Pers, oiu, A. and Lauritzen, S. E., Elsevier, Amster- Kern, Z., Bočić, N., and Sipos, G.: Radiocarbon-Dated dam, the Netherlands, 34–68, https://doi.org/10.1016/B978-0- Vegetal Remains from the Cave Ice Deposits of 12-811739-2.00032-2, 2018. Velebit Mountain, Croatia, Radiocarbon, 60, 1391–1402, Mesta-Nuñez, A. M. and Enfield, D. B.: Rotated global https://doi.org/10.1017/RDC.2018.108, 2018. modes of non-ENSO sea surface temperature variability, Kern, Z., Hatvani, I. G., Czuppon, G., Fórizs, I., Erdélyi, J. Climate, 12, 2734–2746, https://doi.org/10.1175/1520- D., Kanduč, T., Palcsu, L., and Vreča, P.: Isotopic “Al- 0442(1999)0122.0.CO;2, 1999. titude” and “Continental” Effects in Modern Precipitation Moberg, A., Sonechkin, D. M., Holmgren, K., Datsenko, N. M., and across the Adriatic-Pannonian Region, Water 2020, 12, 1797 Karlén, W.: Highly variable Northern Hemisphere temperatures https://doi.org/10.3390/w12061797, 2020. reconstructed from low- and high-resolution proxy data, Nature, Kerr, R. A.: A North Atlantic Climate Pacemaker 433, 613–617, https://doi.org/10.1038/nature03265, 2005. for the Centuries, Science, 288, 1984–1985, Nagavciuc, V., Ionita, M., Persoiu, A., Popa, I., Loader, N. J., and https://doi.org/10.1126/science.288.5473.1984, 2000. McCarroll, D.: Stable oxygen isotopes in Romanian oak tree Knight, J. R., Allan, R. J., Folland, C. K., Vellinga, M., and Mann, rings record summer droughts and associated large-scale cir- M. E.: A signature of persistent natural thermohaline circula- culation patterns over Europe, Clim. Dynam., 52, 6557–6568, tion cycles in observed climate, Geophys. Res. Lett., 32, L20708, https://doi.org/10.1007/s00382-018-4530-7, 2019a. https://doi.org/10.1029/2005GL024233, 2005. Nagavciuc, V., Bădăluţă, C.-A., and Ionita, M.: Tracing the Rela- Knudsen, M. F., Seidenkrantz, M.-S., Jacobsen, B. H., and tionship between Precipitation and River Water in the Northern Kuijpers, A.: Tracking the Atlantic Multidecadal Oscilla- Carpathians Base on the Evaluation of Water Isotope Data, Geo- tion through the last 8,000 years, Nat. Commun., 2, 178, sciences, 9, 198, https://doi.org/10.3390/geosciences9050198, https://doi.org/10.1038/ncomms1186, 2011. 2019b. Knudsen, M. F., Jacobsen B. H., Seidenkrantz, M.-S., and Olsen, J.: Nemec, M., Wacker, L., and Gäggeler, H. W.: Optimization of the Evidence for external forcing of the Atlantic Multidecadal Oscil- Graphitization Process at AGE-1, Radiocarbon, 52, 1380–1393, lation since termination of the Little Ice Age, Nat. Commun., 5, 2010. 3323, https://doi.org/10.1038/ncomms4323, 2014. Neukom, R., Steiger, N., Gómez-Navarro, J. J., Wang, J., and Koci, B. R. and Kuivinen, K. C.: The PICO Werner, J. P.: No evidence for globally coherent warm and cold lightweight coring auger, J. Glaciol., 30, 244–245, periods over the preindustrial Common Era, Nature, 571, 550– https://doi.org/10.3189/S0022143000006018, 1984. 554, https://doi.org/10.1038/s41586-019-1401-2, 2019. Latif, M., Botset, E. R. M., Esch, M., Haak, H., Hage- O’Reilly, C. H., Woollings, T., and Zanna, L.: The Dynamical Influ- mann, S., Jungclaus, J., Legutke, S., Marsland, S., and ence of the Atlantic Multidecadal Oscillation on Continental Cli- Mikolajewicz, U.: Reconstructing, monitoring and pre- mate, J. Climate, 30, 7213–7230, https://doi.org/10.1175/JCLI- dicting multidecadal-scale changes in the North Atlantic D-16-0345.1, 2017. thermohaline circulation with sea surface temperature, Orghidan, T., Negrea, Ş., Racoviţă, G., and Lascu, C.: Pes, teri J. Climate, 17, 1605–1614, https://doi.org/10.1175/1520- din România: ghid turistic, Sport-Turism, Bucharest, Romania, 0442(2004)0172.0.CO;2, 2004. 1984. Leunda, M., González-Sampériz, P., Gil-Romera, G., Bartolomé, PAGES 2K Consortium: Consistent multidecadal variabil- M., Belmonte-Ribas, Á., Gómez-García, D., Kaltenrieder, P., ity in global temperature reconstructions and simula- Rubiales, J. M., Schwörer, C., Tinner, W., Morales-Molino, tions over the Common Era, Nat. Geosci., 12, 643–649, C., and Sancho, C.: Ice cave reveals environmental forcing of https://doi.org/10.1038/s41561-019-0400-0, 2019. long-term Pyrenean tree line dynamics, J. Ecol., 107, 814–828, Persoiu, A.: Climate evolution during the Late Glacial and https://doi.org/10.1111/1365-2745.13077, 2019. the Holocene, in: Landform dynamics and evolution in Ro- Ljungqvist, F. C., Seim, A., Krusic, P. J., González-Rouco, J. F., mania, edited by: Rădoane, M. and Vespremeanu-Stroe, Werner, J. P., Cook, E. R., Zorita, E., Luterbacher, J., Xoplaki, A., Springer, Berlin and Heidelberg, Germany, 57–66, E., Destouni, G., García-Bustamante, E., Aguilar, C. A. M., Sefti- https://doi.org/10.1007/978-3-319-32589-7_3, 2017. gen, K., Wang, J., Gagen, M. H., Esper, J., Solomina, O., Fleit- Persoiu, A. and Onac, B. P.: Ice caves in Romania, in: Cave and mann, D., and Büntgen, U.: European warm-season temperature Karst Systems of Romania, edited by: Ponta, G. M. L. and and hydroclimate since 850 CE, Environ. Res. Lett., 14, 084015, Onac, B. P., Springer, Berlin and Heidelberg, Germany, 455–465, https://doi.org/10.1088/1748-9326/ab2c7e, 2019. https://doi.org/10.1007/978-3-319-90747-5_52, 2019. Maggi, V., Turri, S., Bini, A., and Udisti, R.: 2500 Years of his- Perşoiu, A. and Pazdur, A.: Ice genesis and its long-term tory in Focul Viu Ice Cave, Romania, in: Proceedings of the 3rd mass balance and dynamics in Scărişoara Ice Cave, Romania, International Workshop on Ice Caves, 12–17 May 2008, Perm, The Cryosphere, 5, 45–53, https://doi.org/10.5194/tc-5-45-2011, Russia, 11–15, 2008. 2011. Mann, M. E., Zhang, Z., Rutherford, S., Bradley, R., Hughes, Pers, oiu, A., Feier, I., Citterio, M., Turri, S., and Maggi, V.: Prelim- M. K., Shindell, D., Ammann, C., Faluvegi, G., and Ni, F.: inary data on air temperature in Focul Viu Ice Cave (Bihor Mts., Global signatures and dynamical origins of the Little Ice Age Romania), in: Proceedings of the 2nd International Workshop on and Medieval Climate Anomaly, Science, 326, 1256–1260, Ice Cave, 8–12 May 2006, Demänovská Dolina, Slovak Repub- https://doi.org/10.1126/science.1177303, 2009. lic, 62–64, 2007. https://doi.org/10.5194/cp-16-2445-2020 Clim. Past, 16, 2445–2458, 2020
You can also read


