WRF v.3.9 sensitivity to land surface model and horizontal resolution changes over North America
←
→
Page content transcription
If your browser does not render page correctly, please read the page content below
Geosci. Model Dev., 15, 413–428, 2022
https://doi.org/10.5194/gmd-15-413-2022
© Author(s) 2022. This work is distributed under
the Creative Commons Attribution 4.0 License.

WRF v.3.9 sensitivity to land surface model and horizontal
resolution changes over North America
Almudena García-García1,2 , Francisco José Cuesta-Valero1,2 , Hugo Beltrami1 , J. Fidel González-Rouco3 , and
Elena García-Bustamante4
1 Climate & Atmospheric Sciences Institute, St. Francis Xavier University, Antigonish, Nova Scotia, Canada
2 Department   of Remote Sensing, Helmholtz Centre for Environmental Research – UFZ, Leipzig, Germany
3 Physics of the Earth and Astrophysics Department, IGEO (UCM-CSIC), Universidad Complutense de Madrid,

Madrid, Spain
4 Department of Energy, Research Center for Energy, Environment and Technology (CIEMAT), Madrid, Spain

Correspondence: Hugo Beltrami (hugo@stfx.ca)

Received: 19 July 2021 – Discussion started: 26 August 2021
Revised: 26 November 2021 – Accepted: 1 December 2021 – Published: 18 January 2022

Abstract. Understanding the differences between regional           itation indicates that the CLM4 LSM yields the lowest bi-
simulations of land–atmosphere interactions and near-              ases in maximum and minimum mean temperatures but the
surface conditions is crucial for a more reliable representa-      highest biases in extreme temperatures. Increasing horizon-
tion of past and future climate. Here, we explore the effect of    tal resolution leads to larger biases in accumulated precipi-
changes in the model’s horizontal resolution on the simulated      tation over all regions particularly in summer. The reasons
energy balance at the surface and near-surface conditions us-      behind this are related to the partition between convective
ing the Weather Research and Forecasting (WRF) model. To           and non-convective precipitation, specially noticeable over
this aim, an ensemble of 12 simulations using three different      western USA.
horizontal resolutions (25, 50 and 100 km) and four different
land surface model (LSM) configurations over North Amer-
ica from 1980 to 2013 is developed. Our results show that
finer resolutions lead to higher surface net shortwave radia-      1   Introduction
tion and maximum temperatures at mid and high latitudes.
At low latitudes over coastal areas, an increase in resolution     Most assessments of climate change impacts on ecosys-
leads to lower values of sensible heat flux and higher values      tems and societies are based on projections performed by
of latent heat flux, as well as lower values of surface temper-    regional climate models (RCMs) and/or earth system mod-
atures and higher values of precipitation, and soil moisture in    els (ESMs; IPCC, 2013, 2019). Exploring inter-model dif-
summer. The use of finer resolutions leads then to an increase     ferences in present climate simulations is necessary to un-
in summer values of latent heat flux and convective and non-       derstand their contribution to the spread in future climate
convective precipitation and soil moisture at low latitudes.       projections and ultimately to better characterize or even re-
The effect of the LSM choice is larger than the effect of hori-    duce the uncertainty in the simulation of the response to a
zontal resolution on the near-surface temperature conditions.      given scenario (Cubasch et al., 2013). Understanding inter-
By contrast, the effect of the LSM choice on the simulation        model differences is also important for paleoclimatic stud-
of precipitation is weaker than the effect of horizontal resolu-   ies relying on regional climate model simulations to bridge
tion, showing larger differences among LSM simulations in          the gap between the local character of proxy reconstructions
summer and over regions with high latent heat flux. Compar-        and ESM global simulations (e.g., PALEOLINK; Gómez-
ison between observations and the simulation of daily max-         Navarro et al., 2018).
imum and minimum temperatures and accumulated precip-                 The representation of land–atmosphere interactions within
                                                                   climate models has received considerable attention during

Published by Copernicus Publications on behalf of the European Geosciences Union.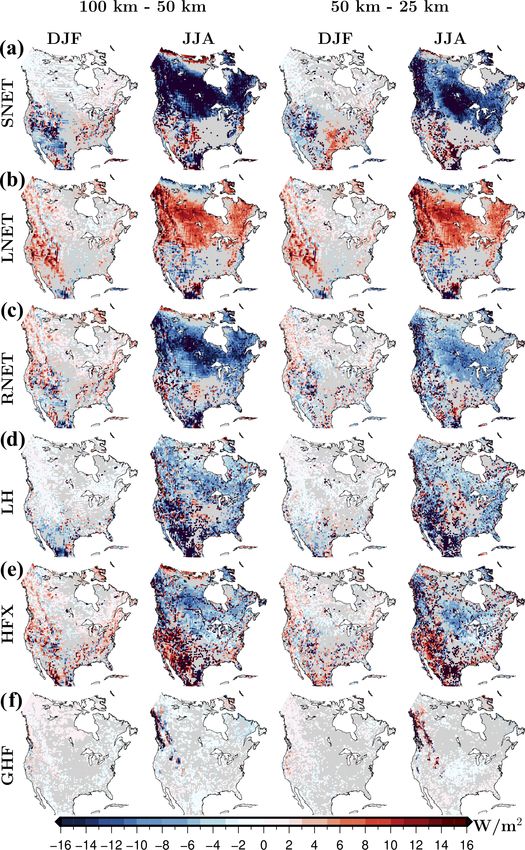
414                                    A. García-García et al.: WRF sensitivity to horizontal resolution and LSM changes

the last decades due to their influence on surface climate,        regional scales with possible implications for the simula-
vegetation and soil hydrology, and therefore, on climate vari-     tion of climate dynamics (Ban et al., 2014; Gómez-Navarro
ability (e.g., Lorenz et al., 2016; Vogel et al., 2017). For ex-   et al., 2015; Messmer et al., 2017; Hahmann et al., 2020;
ample, energy and water exchanges between the lower atmo-          Vegas-Cañas et al., 2020). Small-scale weather phenomena
sphere and the ground surface have been shown to alter sur-        such as sea breezes, snowstorms induced by the presence
face conditions, particularly during extreme weather events        of lakes, local winds, tropical cyclones and mesoscale con-
in summer (Seneviratne et al., 2006; Hirschi et al., 2011; Mi-     vective systems can be better represented with increased res-
ralles et al., 2012; Hauser et al., 2016). Land–atmosphere         olution (Wehner et al., 2010). Some studies have also sug-
interactions have also been studied in the evaluation of cli-      gested a resolution-induced improvement in the representa-
mate model simulations, applying several metrics to char-          tion of interactions between small- and large-scale dynami-
acterize surface energy fluxes and near-surface conditions         cal processes, ultimately leading to better large-scale atmo-
(Koven et al., 2013; Dirmeyer et al., 2013; Sippel et al., 2017;   spheric flow (Lucas-Picher et al., 2017). Thus, the difference
García-García et al., 2019).                                       in the resolution employed in RCMs and ESMs is expected to
   The representation of near-surface conditions (e.g., air and    improve the representation of land–atmosphere interactions
soil temperatures, soil moisture, etc.) and energy and water       in RCMs through a more adequate discretization of equa-
exchanges at the land surface in a climate model depends on        tions, as well as through a more realistic representation of
the processes simulated by the atmospheric and soil model          small-scale processes and topographical features (Xue et al.,
components, as well as on the degree of coupling imple-            2014; Rummukainen, 2016; Vegas-Cañas et al., 2020). The
mented between both model components (Koster et al., 2006;         improved representation of land–atmosphere interactions as-
Melo-Aguilar et al., 2018). Different land surface models          sociated with finer resolutions is also expected to induce an
(LSMs) include varying levels of realism in the represen-          improvement in the simulation of near-surface conditions,
tation of soil physics, land cover type, soil water content,       especially in the simulation of extreme events (Prein et al.,
snow cover, drip, runoff or infiltration. Thus, each LSM sim-      2013; Di Luca et al., 2015; Rummukainen, 2016; Demory
ulates somewhat different surface water and energy fluxes          et al., 2014).
(e.g., Lawrence et al., 2019). For example, the representa-           Although the literature on the impact of the LSM choice
tion of surface albedo, evaporative resistance and aerody-         and changes in resolution on climate simulations is extensive,
namic roughness by each LSM alters the simulation of the           most studies are focused on small domains and meteorolog-
surface energy balance and consequently affects the evolu-         ical events, providing little information about the impact of
tion of surface temperatures (Laguë et al., 2019; MacDougall       the LSM choice and horizontal resolution changes on long-
and Beltrami, 2017). The dependence of the simulated land–         term climatological variability. Here, we evaluate and com-
atmosphere interactions on the LSM has been shown in pre-          pare the influence of both factors, the LSM choice and hori-
vious studies using global (García-García et al., 2019) and        zontal resolution, on the representation of energy and water
regional climate model simulations over North America (Pei         fluxes at the surface and consequently on the simulation of
et al., 2014; García-García et al., 2020). There are examples      near-surface conditions over North America for a climato-
of these studies at local scales (Mooney et al., 2013; Whar-       logical period spanning the time interval 1980–2013. We use
ton et al., 2013; Chen et al., 2014; Van Den Broeke et al.,        the Weather Research and Forecasting (WRF) model (ver-
2018; Liu et al., 2019; Zhuo et al., 2019) and at continen-        sion 3.9; Skamarock et al., 2008) that allows for testing a
tal scales for Europe (Davin and Seneviratne, 2012; Mooney         number of LSM schemes, each varying in physical parame-
et al., 2013).                                                     terization complexities. An ensemble of 12 simulations was
   Horizontal resolution is another factor to take into ac-        generated using three different horizontal resolutions (25, 50
count in the study of land–atmosphere interactions in cli-         and 100 km), four different LSM configurations and two veg-
mate model simulations. ESMs are limited by computational          etation options, i.e., prescribed or dynamical vegetation.
resources, using horizontal resolutions from approximately            The WRF representation of climate at different resolutions
250 to 100 km (e.g., CMIP5 models; Taylor et al., 2012),           is expected to affect the simulation of atmospheric and sur-
while RCMs allow for using much finer resolutions. Anal-           face phenomena in several ways, through a different rep-
ogously, the range of horizontal resolutions employed in           resentation of cloud formation or through a different level
RCMs for climate studies is usually limited to approximately       of details in the description of orography and land cover.
50–25 km (e.g., CORDEX models; Giorgi and Gutowski,                Simulations with different LSMs provide information about
2015). In spite of this enhanced resolution, an RCM’s abil-        the advantages of using a comprehensive LSM, such as the
ity to reproduce temporal variability like that of precipitation   CLM4 LSM (Oleson et al., 2010), or a simpler LSM com-
at daily timescales is still limited, being greatly improved       ponent, such as the NOAH LSM (Tewari et al., 2004). Ad-
by using resolutions of ∼ 4 km and convection-resolving            ditionally, the comparison of two identical model configura-
RCMs (Sun et al., 2016). Previous studies have shown some          tions except for the prescribed or dynamical vegetation mode
resolution-induced improvements in the simulation of pre-          provides information about the effect of a realistic evolution
cipitation, wind and high-altitude temperatures at local and       of vegetation cover on the energy and water balance at the

Geosci. Model Dev., 15, 413–428, 2022                                               https://doi.org/10.5194/gmd-15-413-2022
A. García-García et al.: WRF sensitivity to horizontal resolution and LSM changes                                             415

surface. Thus, soil and near-surface variables from these 12      the microphysics (Hong and Lim, 2006), the Grell–Freitas
simulations are compared and also evaluated against temper-       ensemble scheme (Grell and Freitas, 2014), the Yonsei Uni-
ature and precipitation observations to explore two questions.    versity scheme for the description of the planetary bound-
(1) How do changes in horizontal resolution within WRF af-        ary layer scheme (YSU; Hong et al., 2006), the revised
fect the simulation of land–atmosphere interactions and near-     MM5 Monin–Obukhov scheme (Jiménez et al., 2012) and
surface conditions? (2) How do LSM differences in the simu-       the Community Atmosphere Model (CAM) scheme (Collins
lation of land–atmosphere interactions translate into different   et al., 2004). The use of different horizontal resolutions re-
near-surface conditions?                                          quires the use of different time steps for performing our
   The descriptions of the WRF experiments and the method-        WRF simulations, as well as different time intervals for com-
ology applied for the analysis are included in Sects. 2 and 3,    puting radiation physics (radt option in WRF namelist). Ta-
respectively. Section 4 presents the results of the analysis,     ble 1 summarizes the differences between all simulations em-
which are discussed using the available literature in Sect. 5.    ployed in this analysis.
The conclusions and importance of this work are summarized           The LSM schemes used in this study differ in parameteri-
in Sect. 6.                                                       zation complexity, the NOAH being the most basic amongst
                                                                  the three selected LSMs. The NOAH LSM describes soil and
                                                                  vegetation processes for the closure of the water and energy
2   Description of the modelling experiment                       budgets, discretizing the soil into four soil layers that reach a
                                                                  total of 2 m of depth (Tewari et al., 2004). Some limitations
We performed three sets of regional simulations (12 simula-       have been associated in this soil model with the represented
tions in total) over North America from 1980 to 2013 using        bulk layer of canopy, snow and soil, its system to drain water
the Advanced Research WRF model (WRF v3.9; Skamarock              at the bottom of the soil column, and its simple snowmelt dy-
et al., 2008) with initial and boundary conditions from           namics (Wharton et al., 2013). The NOAH-MP version of the
the North American Regional Reanalysis product (NARR;             NOAH LSM improves soil hydrology and the representation
Mesinger et al., 2006). The NARR product was generated by         of terrestrial biophysical processes (Niu et al., 2011). This
the National Centers for Environmental Prediction (NCEP)          scheme includes a separate vegetation canopy with a compre-
Eta atmospheric model (Janjic, 1997), the NOAH LSM com-           hensive description of vegetation properties. The NOAH-MP
ponent (Mitchell, 2005) and the Regional Data Assimilation        also includes a multi-layer snow pack description with liquid
System (RDAS; Mesinger et al., 2006). The NARR data were          water storage and melting and refreezing capabilities. It in-
obtained from the National Center for Environmental Infor-        cludes the same soil structure as the NOAH LSM (four soil
mation (NOAA) archive and provides data over a 32 km grid         layers, down to 2 m). The CLM4 LSM incorporates a com-
with a 3-hourly temporal resolution. No nudging techniques        prehensive representation of biogeophysics and hydrology,
were applied within the domain of the simulation. The use         including a single-layer vegetation canopy, a five-layer snow-
of nudging techniques imposes large-scale variability within      pack and a 10-layer soil column down to a depth of 3.802 m.
the inner scales of the domain of simulation, thus partially      This scheme also characterizes each grid cell into five pri-
muting the generation of local- and regional-scale dynami-        mary sub-grid land cover types (glacier, lake, wetland, urban
cal responses in favour of representing the large scale flow      and vegetated), using up to four plant functional types (PFTs)
of the driving conditions. Avoiding nudging, therefore, al-       to describe vegetation physiology and structure.
lows for more clearly expressing the influences of increased
resolution and of changing the LSM component (von Storch
et al., 2000).                                                    3   Methodology
   The three sets of simulations were performed using a
Lambert-type projection with resolutions of 25×25 km, 50×         We study the impact of changing horizontal resolution on
50 km and 100 × 100 km. Each set includes four simulations        surface energy fluxes and near-surface conditions as simu-
using three different LSM components: the NOAH LSM                lated by the WRF model with different LSM components.
(NOAH; Tewari et al., 2004), the NOAH LSM with multi-             For this purpose, we estimated the temporal averages of sur-
parameterizations options (NOAH-MP; Niu et al., 2011) and         face energy fluxes for the analysis period (1980–2013) fo-
the Community Land Model version 4 LSM (CLM4; Oleson              cusing on the following energy components: net shortwave
et al., 2010). The fourth simulation included in each set was     radiation (SNET, W m−2 ), net longwave radiation (LNET,
performed using the NOAH-MP LSM with dynamic vegeta-              W m−2 ), net radiation absorbed by the soil (RNET, W m−2 ),
tion (NOAH-MP-DV), while vegetation was prescribed for            latent heat flux (LH, W m−2 ), sensible heat flux (HFX,
the other simulations. The rest of the WRF options remained       W m−2 ) and ground heat flux (GHF, W m−2 ). The temporal
the same for all simulations, employing 27 atmospheric lev-       averages of near-surface conditions are estimated using out-
els, land cover categories from the Moderate Resolution           puts of 2 m air temperatures (SAT, ◦ C), daily maximum SAT
Imaging Spectroradiometer (MODIS; Barlage et al., 2005),          (TASMAX, ◦ C), daily minimum SAT (TASMIN, ◦ C), soil
the WRF single moment (WSM) 6-class graupel scheme for            temperature at 1 m depth (GST 1 m, ◦ C), accumulated con-

https://doi.org/10.5194/gmd-15-413-2022                                                Geosci. Model Dev., 15, 413–428, 2022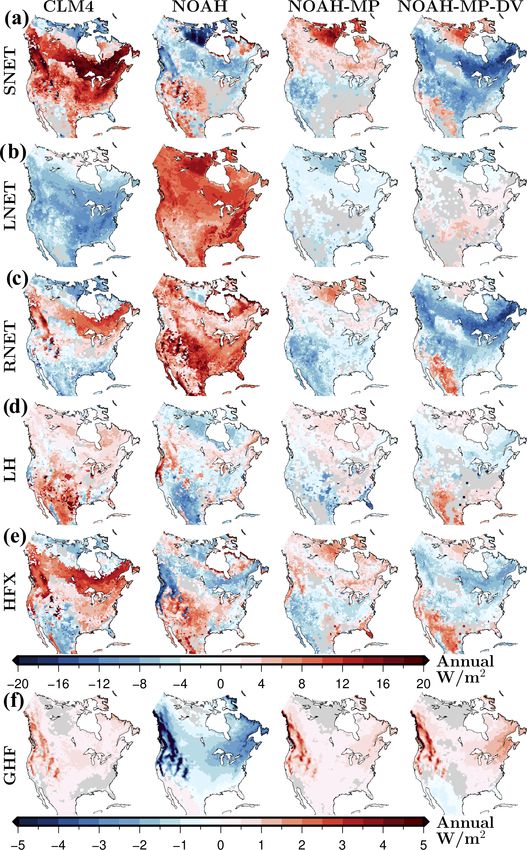
416                                      A. García-García et al.: WRF sensitivity to horizontal resolution and LSM changes

Table 1. Summary of the regional simulations performed in this analysis.

         Name                       LSM            Resolution    Vegetation mode    Simulation time step   Radiation time step
         NOAH 25 km                                25 km         Prescribed         2.5 min                6 min
         NOAH 50 km                 NOAH           50 km         Prescribed         5 min                  20 min
         NOAH 100 km                               100 km        Prescribed         10 min                 20 min
         NOAH-MP 25 km                             25 km         Prescribed         2.5 min                6 min
         NOAH-MP 50 km              NOAH-MP        50 km         Prescribed         5 min                  20 min
         NOAH-MP 100 km                            100 km        Prescribed         10 min                 20 min
         NOAH-MP-DV 25 km                          25 km         Dynamic            2.5 min                6 min
         NOAH-MP-DV 50 km           NOAH-MP        50 km         Dynamic            5 min                  20 min
         NOAH-MP-DV 100 km                         100 km        Dynamic            10 min                 20 min
         CLM4 25 km                                25 km         Prescribed         2.5 min                6 min
         CLM4 50 km                 CLM4           50 km         Prescribed         5 min                  20 min
         CLM4 100 km                               100 km        Prescribed         10 min                 20 min

vective and non-convective precipitation at the surface (PRE-
CIP C and PRECIP NC, mm d−1 ), soil moisture contained in
the first soil metre (SM 1 m, m3 m−3 ), and total cloud fraction
(TCLDFR, %). All values are computed using the annual and
seasonal (boreal winter, DJF; summer, JJA) averages over the
34-year period (1980–2013) after discarding the first year of
the simulation (1979) as spin-up, which is enough to avoid
the effect of initial conditions (García-García et al., 2020).
Thus, we estimated the anomalies of all outputs for each
LSM simulation relative to the multi-model mean (the mean
of CLM4, NOAH, NOAH-MP and NOAH-MP-DV outputs)
for each set of simulations with different resolution (25, 50
and 100 km). Similarly, we estimated the change in the sim-            Figure 1. Subregions employed for the bias analysis, adapted from
                                                                       Giorgi and Francisco (2000): Central America, CAM; western
ulation of all variables between the 100 and 50 km simula-
                                                                       North America, WNA; central North America, CNA; eastern North
tions and between the 50 and 25 km simulations for all LSM             America, ENA; Alaska, ALA; and Greenland, GRL.
configurations. When required, outputs of all WRF experi-
ments were mapped to the grid of the observational refer-
ence employed in this study by selecting the nearest model             the observational product and the uncertainties arising from
grid point. A Student’s t test considering autocorrelation was         the model configuration. We calculated annual and seasonal
used to identify significant differences between simulations           WRF and DAYMET biases in these variables relative to the
with different LSMs and horizontal resolutions at the 95 %             CRU data for the analysis period averaged over six subre-
confidence level.                                                      gions due to the large climate differences over North Amer-
   Additionally, we evaluate the WRF performance in the                ica. These six subregions cover Central and North Amer-
simulation of maximum and minimum air temperature and                  ica (NA) and are adapted from Giorgi and Francisco (2000):
accumulated precipitation against the Climatic Research                Central America, CAM; western North America, WNA; cen-
Unit Time-Series product version 4.03 (CRU; Harris et al.,             tral North America, CNA; eastern North America, ENA;
2014). The CRU database provides monthly data at a res-                Alaska, ALA; and Greenland, GRL (Fig. 1). The impact of
olution of approximately 50 km. Previous studies have re-              horizontal resolution is expected to be larger on the simula-
ported inconsistencies between different observational prod-           tion of extreme events than on surface climatologies (Prein
ucts, particularly important for the evaluation of model sim-          et al., 2013; Di Luca et al., 2015; Rummukainen, 2016). We
ulations with different resolutions (e.g., Iles et al., 2020). To      examined this by calculating the bias in the 95th percentile of
avoid this issue, we included another observational database           maximum and minimum temperatures and accumulated pre-
in the analysis; the Daily Surface Weather Data version 3              cipitation within all experiments using the DAYMET product
(DAYMET; Thornton et al., 2016), with daily data at approx-            as reference.
imately 1 km resolution over North America. This allows for
the comparison of uncertainties associated with the choice of

Geosci. Model Dev., 15, 413–428, 2022                                                    https://doi.org/10.5194/gmd-15-413-2022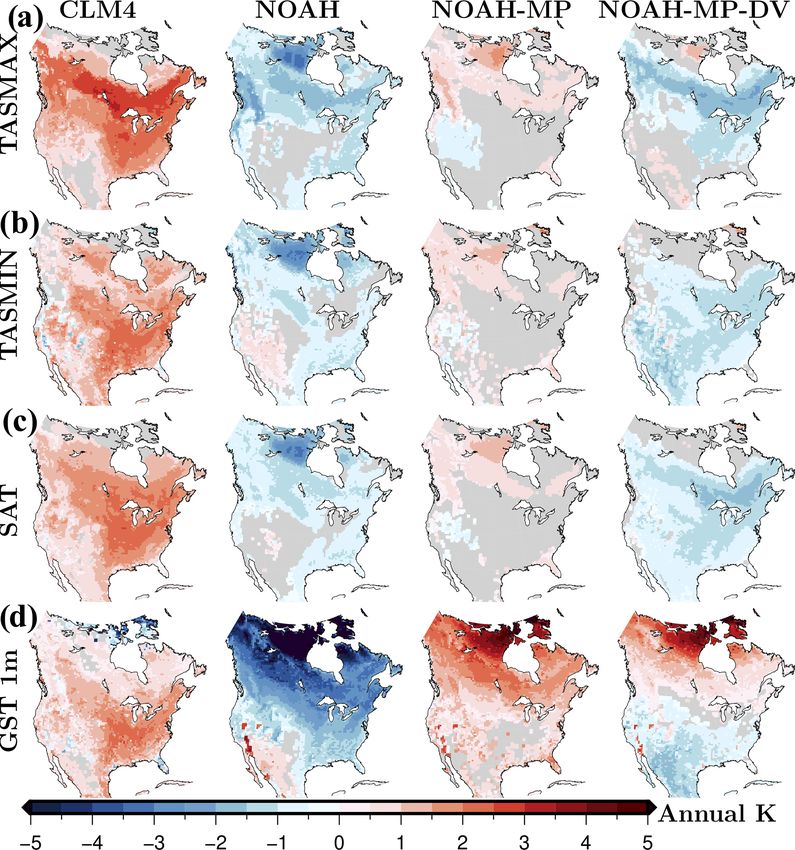
A. García-García et al.: WRF sensitivity to horizontal resolution and LSM changes                                                 417

4     Results

4.1    LSM influences on surface energy fluxes and
       near-surface conditions

The net radiation absorbed by the ground surface enhances
turbulent (latent and sensible) fluxes at the surface and/or
warms the soil surface, which leads to an increase in the
emitted longwave radiation (Bonan, 2002). The relationship
between these variables is shown by their corresponding en-
semble mean of LSM simulations, indicating similar lati-
tudinal patterns in net radiation, turbulent fluxes and near-
surface temperatures with higher fluxes and temperatures at
lower latitudes (see for example Fig. 2 for the LSM ensem-
ble mean of the 50 km experiments). The net radiation results
from adding net shortwave and longwave radiations, whose
mean values have similar spatial distributions but with op-
posite sign (Fig. 2a). This indicates that more shortwave ra-
diation reaches the land surface than is reflected due to sur-
face albedo, while the radiation emitted from the soil due to
its surface temperature, is higher than the longwave radia-
tion reaching the soil surface (Fig. 2a). The energy propor-
tion of net radiation that is propagated through the soil is
much smaller than the rest of surface energy fluxes (Fig. 2b).
Areas with high latent heat flux coincide with areas with
high convective precipitation rates at low and middle lati-
tudes (Fig. 2b and d). The soil moisture map shows high val-
ues southward in the Great Lakes region and low values in
dry areas such as Florida and the southwest USA, in agree-
ment with both convective and non-convective precipitation
(Fig. 2d and e).
   The use of a different LSM component in WRF affects
the representation of soil and vegetation properties and pro-
cesses in the simulation, resulting in noticeable differences
in the simulated energy fluxes across the domain (Fig. 3).
                                                                 Figure 2. Ensemble mean of the LSM simulations for the sur-
For instance, the spatial pattern of the LSM anomalies rel-
                                                                 face energy fluxes and near-surface conditions: net shortwave radia-
ative to the multi-model mean in longwave net radiation is       tion (SNET), net longwave radiation (LNET), surface net radiation
similar to the minimum temperature anomalies (Figs. 3b and       (RNET) (a); latent heat flux (LH), sensible heat flux (HFX), ground
4b), and the anomalies in latent heat flux show similar LSM      heat flux (GHF) (b); maximum temperature (TASMAX), minimum
differences to the convective precipitation maps at low lati-    temperature (TASMIN), surface air temperature (SAT), soil tem-
tudes (Figs. 3d and 5a). The spatial patter of the LSM anoma-    perature at 1 m depth (GST 1 m) (c); accumulated convective and
lies in sensible and latent heat fluxes shows opposite val-      non-convective precipitation at the surface (PRECIP C and PRECIP
ues around the mean. For example over the boreal forest,         NC) (d); soil moisture contained in the first soil metre (SM 1 m) (e);
the LSMs reaching the highest values of latent heat flux also    and total cloud cover fraction (TCLDFR) (f) for the WRF ensem-
reach the lowest values of sensible heat flux at the same lo-    ble mean. GHF results are also represented using its own colour
                                                                 scale (g). Mean values are estimated as the temporal average for the
cations (Fig. 3d and f).
                                                                 period 1980–2013 using simulations performed with 50 km resolu-
   LSM differences in the simulation of surface fluxes and
                                                                 tion.
near-surface conditions are similar among the experiments
with different resolutions (Figs. 3–5 and S2, S4 and S6 in the
Supplement). For example, based on the differences between
each LSM simulation with 50 km resolution and the 50 km          while, the NOAH-MP-DV simulation reaches the lowest net
multi-model mean (Fig. 2), we can identify the CLM4 as the       shortwave radiation over the same areas (Fig. 3a). The WRF
LSM component simulating the highest net shortwave radia-        simulation of net longwave radiation reaches negative values
tion over most of North America for the annual, DJF and JJA      (Fig. 2a) with the maximum values simulated by the NOAH
means (SNET in Figs. 3a and S1 in the Supplement). Mean-         LSM and the minimum values simulated by the CLM4 LSM

https://doi.org/10.5194/gmd-15-413-2022                                                 Geosci. Model Dev., 15, 413–428, 2022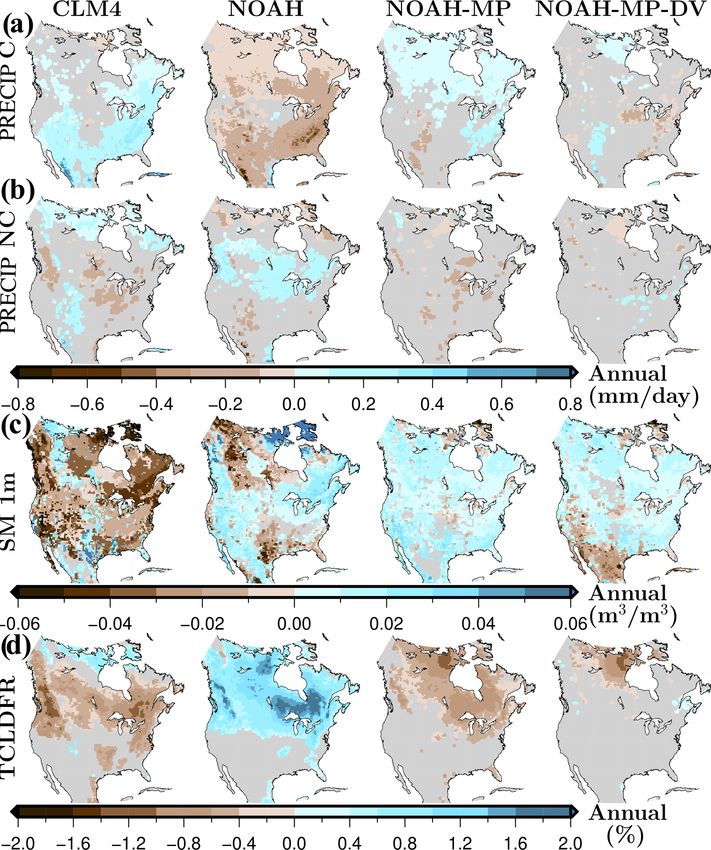
418                                         A. García-García et al.: WRF sensitivity to horizontal resolution and LSM changes

                                                                          Figure 4. Anomalies of near-surface temperature conditions: (a)
                                                                          daily maximum temperature (TASMAX), (b) daily minimum tem-
                                                                          perature (TASMIN), (c) surface air temperature (SAT) and (d) soil
                                                                          temperature at 1 m depth (GST 1 m) for each LSM simulation rel-
                                                                          ative to the LSM ensemble mean. Mean values are estimated as
                                                                          the temporal average for the period 1980–2013 using simulations
                                                                          performed with 50 km resolution. Grid cells with a non-significant
                                                                          change at the 5 % significance level are masked in grey.

                                                                          lies is also supported by high spatial correlation coefficients
Figure 3. Anomalies of energy fluxes at the surface: (a) net short-       (Table S1 in the Supplement). These correlation coefficients
wave radiation (SNET), (b) net longwave radiation (LNET), (c) soil
                                                                          show the link of maximum temperatures to both shortwave
net radiation (RNET), (d) latent heat flux (LH), (f) sensible heat flux
                                                                          and longwave net radiation, particularly in summer, while
(HFX) and (g) ground heat flux (GHF) for each LSM simulation
relative to the LSM ensemble mean. Mean values are estimated as           minimum temperatures show higher correlation with long-
the temporal average for the period 1980–2013 using simulations           wave net radiation than with shortwave net radiations in most
performed with 50 km resolution. Grid cells with a non-significant        of the LSM simulations (Table S1).
change at the 5 % significance level are masked in grey.                     The simulation of sensible heat flux reaches the highest
                                                                          values using the CLM4 configuration over the boreal for-
                                                                          est and the lowest values in western USA. Meanwhile, the
(Fig. 3b). The upward (negative) component of the net long-               NOAH simulation reaches the lowest sensible heat fluxes
wave radiation results from the Stefan–Boltzmann equation,                over the boreal forest and the highest values in western USA
from which the outgoing longwave radiation LW ↑ is propor-                (Fig. 3e). The spatial patterns of LSM anomalies in sensi-
tional to σ Ts4 , where Ts is surface temperature and σ is the            ble heat flux are similar to the LSM anomalies in net short-
Stefan–Boltzmann constant. Thus, the CLM4 simulation pro-                 wave radiation and daily maximum temperatures (Figs. 3a
duces the largest outgoing longwave radiation (see Fig. S7                and 4a), which is also shown by high spatial correlation coef-
in the Supplement), shown in Fig. 3b by the largest nega-                 ficients, particularly in summer (Table S1). LSM differences
tive anomalies and therefore the highest air and soil temper-             in ground heat flux are smaller than for the rest of the en-
atures (Fig. 4). The opposite behaviour is performed by the               ergy fluxes due to the small magnitude of the GHF in com-
NOAH LSM, yielding the lowest upward longwave radia-                      parison with the rest of energy components (Fig. 2g). The
tion (Figs. 3b and S7), and one of the coldest temperature                NOAH LSM reaches the lowest ground heat flux values for
climatologies relative to the multi-model mean (Fig. 4). The              the annual mean in most of the domain, showing nonethe-
relationship between the radiation and temperature anoma-                 less the highest ground heat flux values in summer at high

Geosci. Model Dev., 15, 413–428, 2022                                                       https://doi.org/10.5194/gmd-15-413-2022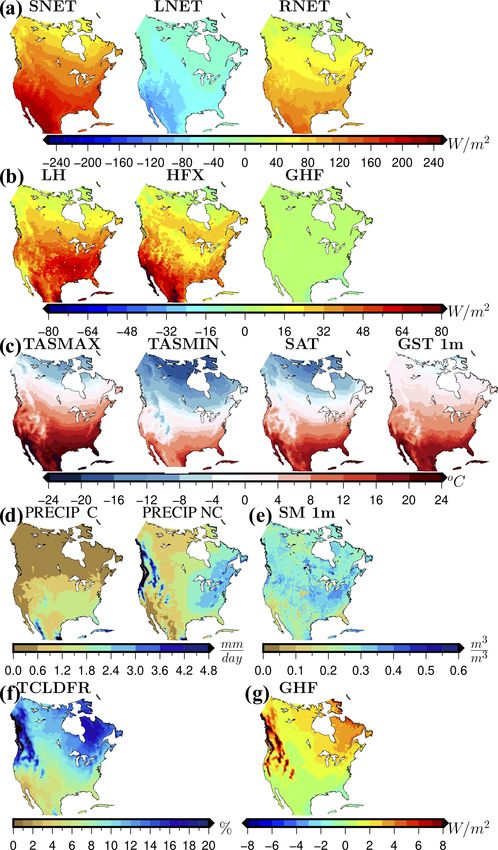
A. García-García et al.: WRF sensitivity to horizontal resolution and LSM changes                                                 419

                                                                       domain and low latent heat flux over the eastern NA rela-
                                                                       tive to the multi-model mean (Figs. S1 and S5). These differ-
                                                                       ences between the east and west in the CLM4 simulation of
                                                                       latent heat flux are not reflected in the values of convective
                                                                       precipitation rates, hence the low spatial correlation coeffi-
                                                                       cients between both variables (Table S2 in the Supplement).
                                                                       There are also LSM differences in the non-convective term
                                                                       of precipitation, with larger anomalies in summer than in
                                                                       winter (Figs. 5b and S5). Thus, the NOAH LSM produces
                                                                       the highest precipitation anomaly at mid-latitudes, where the
                                                                       same LSM produces high values of total cloud fraction rela-
                                                                       tive to the multi-model mean (Fig. 5b and d). This relation-
                                                                       ship between non-convective precipitation and cloud cover
                                                                       is also shown by high spatial correlation coefficients (Ta-
                                                                       ble S2). There are large LSM differences in the simulation
                                                                       of soil moisture, with the CLM4 LSM generating the driest
                                                                       conditions and the NOAH-MP experiments the wettest soils
                                                                       (Figs. 5c and S5). Although the LSM differences are large in
                                                                       the representation of humid conditions, the relationship be-
                                                                       tween precipitation, latent heat flux, soil moisture and cloud
                                                                       fraction is weaker than the relationship between radiation and
                                                                       temperatures in the WRF experiments.
                                                                          Larger LSM differences in the simulation of shortwave
                                                                       and longwave radiations and temperatures are found over
                                                                       very vegetated areas such as the boreal forest and eastern
Figure 5. Anomalies of near-surface humid conditions: (a) accumu-
lated convective and (b) non-convective precipitation at the surface
                                                                       USA (Figs. 3 and 4). The comparison of the NOAH-MP
(PRECIP C and PRECIP NC), (c) soil moisture contained in the           experiments with prescribed and dynamic vegetation also
first soil metre (SM 1 m), and (d) total cloud fraction (TCLDFR)       shows larger differences in air temperatures over these areas.
for each LSM simulation relative to the LSM ensemble mean. Mean        This suggests that the different representation of vegetation
values are estimated as the temporal average for the period 1980–      in each LSM yields to different estimates of soil properties,
2013 using simulations performed with 50 km resolution. Grid cells     such as surface albedo, evaporative resistance and aerody-
with a non-significant change at the 5 % significance level are        namic roughness, affecting the simulation of radiation and
masked in grey.                                                        temperatures. The LSM differences in latent heat flux and
                                                                       convective precipitation are larger at low latitudes, with the
                                                                       NOAH LSM yielding the most different values relative to the
latitudes (Figs. 3f and S1). The spatial pattern of LSM dif-           rest of LSMs. This can be associated with the issues identi-
ferences in ground heat flux differ from the soil temperature          fied in the NOAH LSM to simulate soil hydrology (Wharton
results, whose spatial correlation coefficients are higher with        et al., 2013).
the longwave net radiation mainly in summer. LSM differ-
ences are larger for the simulation of soil temperatures than          4.2   Resolution impact on surface energy fluxes and
for the simulation of air temperatures particularly at high lati-            near-surface conditions
tudes in summer where LSM differs largely in the simulation
of shortwave net radiation probably due to different estimates         The response of surface energy fluxes and near-surface con-
of surface albedo under different land cover and soil moisture         ditions to changes in spatial resolution varies considerably
values (Figs. 2a, 4c and d, 5c, and S3 in the Supplement).             with the season, while they behave similarly using different
   The CLM4 simulation produces the highest latent heat                LSM components (Figs. 6 and S8–S13 in the Supplement).
flux values and convective precipitation rates, particularly           We consider the results of the NOAH-MP-DV experiments
over southwestern NA, while the NOAH simulation provides               as an example to minimize the number of figures in the pa-
the lowest latent heat flux and convective precipitation val-          per. Changes in resolution alter the surface energy fluxes in
ues over the same areas (Figs. 3d and 5a). LSM differences             DJF mainly over regions of complex topography and coastal
in latent heat flux, convective and non-convective precipita-          areas, while in JJA the simulation of energy fluxes is affected
tion are larger in summer (Figs. S1 and S5 in the Supple-              by resolution over the whole domain except over a region in
ment). LSM differences in JJA convective precipitation rates           the central USA and northern areas of Hudson Bay (Fig. 6).
are particularly large at low latitudes, where the CLM4 LSM            In JJA, the use of coarser horizontal resolutions induces a
produces high latent heat flux over the western part of the            decrease in the net radiation absorbed by soil at high lati-

https://doi.org/10.5194/gmd-15-413-2022                                                    Geosci. Model Dev., 15, 413–428, 2022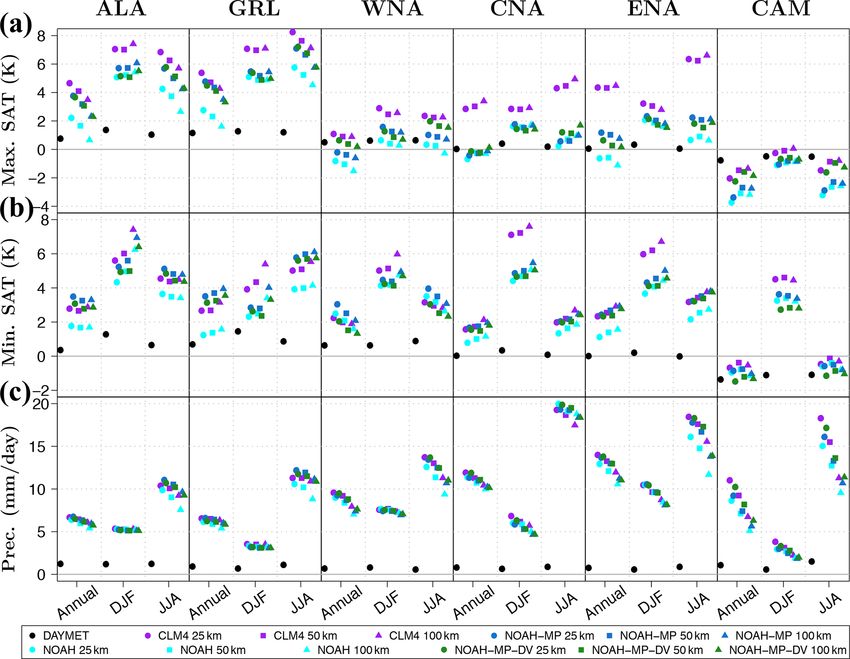
420 A. García-García et al.: WRF sensitivity to horizontal resolution and LSM changes
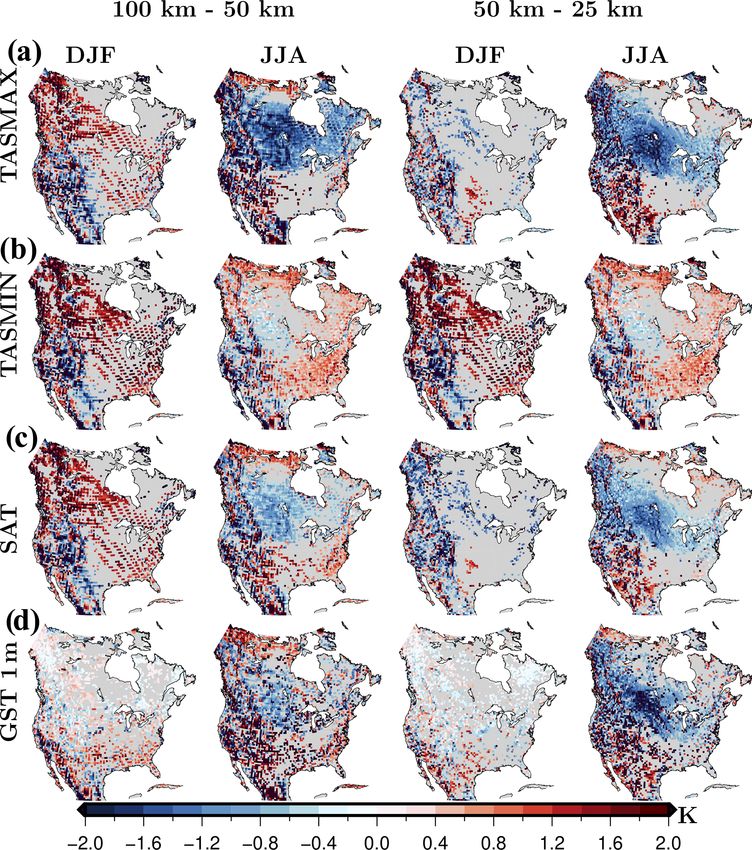
Figure 7. Seasonal mean difference in near-surface temperature
conditions between the 100 and 50 km simulations (left) and be-
tween the 50 and 25 km simulations (right). All outputs are from
the NOAH-MP-DV simulations for the period 1980–2013. Grid
cells with a non-significant change at the 5 % significance level are
masked in grey. All outputs from the 25, 50 and 100 km simulations
were mapped to a common grid (CRU grid) using the nearest model
grid point.
Figure 6. Seasonal mean difference in surface energy fluxes be- changes in the upward component of shortwave radiation,
tween the 100 and 50 km simulations (left) and between the 50 thus affecting SNET. The resolution differences in estimat-
and 25 km simulations (right). All outputs are from the NOAH-MP- ing albedo and land cover in our results are smaller than those
DV simulations for the period 1980–2013. Grid cells with a non-
associated with the cloud cover and the microphysics of the
significant change at the 5 % significance level are masked in grey.
model, particularly in JJA. Thus, the effect of resolution on
All outputs from the 25, 50 and 100 km simulations were mapped
to a common grid (CRU grid) using the nearest model grid point. the downward component of shortwave radiation, which is
dependent on cloud formation and atmospheric composition,
is larger than the resolution effect on the upward component
of shortwave radiation, which is dependent on albedo val-
tudes, mainly caused by a decrease in net shortwave radia- ues (Fig. S14 in the Supplement). The resolution changes in
tion (Fig. 6a and c). The decrease in net radiation induced by winter SNET at southern latitudes of the Rocky Mountains
coarser resolutions limits the energy available for turbulent that are not related to cloud cover seem to be associated with
energy fluxes at high latitudes. Thus, values of latent and sen- the upward component of shortwave radiation and therefore
sible heat fluxes also decrease at coarser resolutions at high with the resolution effect on surface albedo values (Figs. 6a,
latitudes (Fig. 6d and e). The use of coarser resolutions also 8d and S14).
induces higher sensible heat fluxes at low latitudes, which is Consistent with the effect of LSM differences on near-
balanced by lower latent heat flux (Fig. 6d and e). surface conditions (Sect. 4.1), the spatial pattern of the res-
Changes in downward shortwave radiation at the surface olution impact on net shortwave radiation is similar to the
are mainly driven by changes in cloud cover, but changes in resolution-induced changes in daily maximum temperatures
atmospheric water vapour and aerosols may also affect the (Figs. 6a and 7a). The response of minimum temperature to
shortwave radiation reaching the ground surface (Hatzianas- changing resolution is, however, smaller than for maximum
tassiou et al., 2005). Changes in surface albedo also lead to temperatures at middle–high latitudes (Fig. 7b). Over eastern
Geosci. Model Dev., 15, 413–428, 2022 https://doi.org/10.5194/gmd-15-413-2022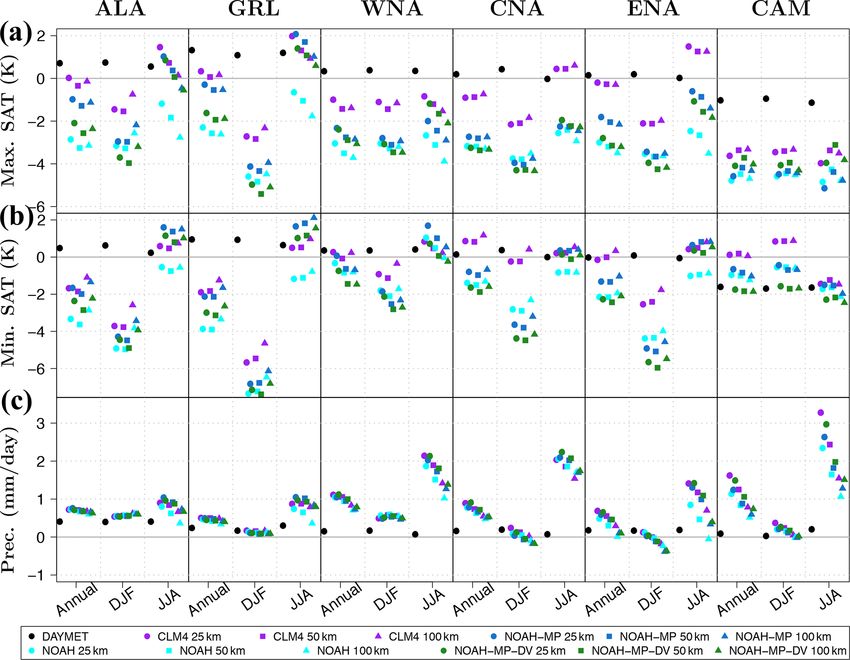
A. García-García et al.: WRF sensitivity to horizontal resolution and LSM changes 421
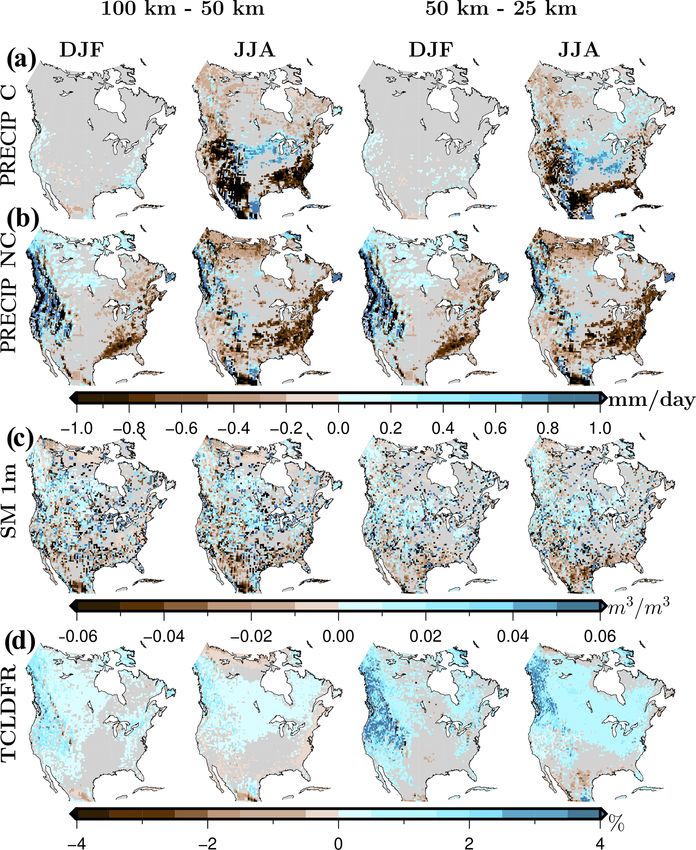
coarser resolutions leads to lower non-convective precipita-
tion rates (Fig. 8b). This behaviour is also present in JJA
over the arctic areas of our domain (Fig. 8b). Although the
response of convective precipitation to resolution in winter
is not significant, in JJA the use of coarser horizontal res-
olutions yields a decrease in convective precipitation over
coastal areas and the Rocky Mountains, where the simulation
also reaches lower latent heat flux values (Figs. 6d and 8a).
Although the spatial pattern of soil moisture is very patchy in
DJF and JJA, soil moisture tends to decrease at low latitudes
in JJA with the use of coarser resolutions (Fig. 8c). At mid-
latitudes, however, the use of coarser resolutions leads to an
increase in soil moisture during the year at most locations
(Fig. 8c).
In summary, at low NA latitudes the JJA values of the
three variables associated with the surface water balance
(LH, PRECIP and SM 1 m) decrease with the use of coarser
horizontal resolutions, although showing large spatial vari-
ability (Figs. 6d and 8a and c). At middle and high NA lati-
tudes, there are differences in the response of the water bal-
ance variables to the use of coarser resolutions. For exam-
ple, soil moisture increases with coarser resolutions over a
large area at mid-latitudes, while convective precipitation in-
creases just over a few grid cells in central NA, decreasing
over most coastal areas (Fig. 8a and c). Latent heat flux de-
Figure 8. Seasonal mean difference in near-surface humid condi- creases with the use of coarser resolutions over most regions
tions between the 100 and 50 km simulations (left) and between the at high and middle latitudes, particularly over coastal areas
50 and 25 km simulations (right). All outputs are from the NOAH- (Fig. 6d).
MP-DV simulations for the period 1980–2013. Grid cells with a
non-significant change at the 5 % significance level are masked in 4.3 Comparison of temperature and precipitation
grey. All outputs from the 25, 50 and 100 km simulations were
against observations
mapped to a common grid (CRU grid) using the nearest model grid
point.
For the comparison of the effect of LSM and horizontal reso-
lution changes on climate simulations, we estimate the bias in
all WRF simulations relative to the CRU observational prod-
North America, JJA minimum temperature increases with the uct (Harris et al., 2014). As a measure of the possible uncer-
use of coarser resolutions, while it decreases over western tainties in observational databases, we also estimate the bias
North America (Fig. 7b). The response of mean temperature in the DAYMET product relative to the CRU data. The in-
to resolution is mainly driven by the resolution impact on consistencies between both observational data are noticeably
maximum temperatures since both show similar spatial pat- smaller than the biases in the WRF experiments for all vari-
terns (Fig. 7c). Although the impact of resolution on air and ables in all regions, except for minimum temperatures in the
soil temperatures shows similar spatial patterns, in winter air CAM region and for precipitation in the ALA region (Fig. 9,
temperatures are more affected by changes in resolution than see a representation of the regions in Fig. 1).
soil temperatures, particularly at high latitudes and elevation The WRF model underestimates annual and seasonal
where snow may be present (Fig. 7c and d). Thus, soil tem- means of daily maximum temperatures over most of North
peratures are more sensible to JJA changes in the energy bud- America at all resolutions, compared grid cell by grid cell
get induced by reducing resolution, while in DJF soil temper- (Fig. S15 in the Supplement) and on average over subdo-
ature remains insulated from resolution-induced changes in mains (Fig. 9a). These biases are generally less pronounced
surface conditions probably because of the insulating effect for the experiments using the CLM4 LSM at most loca-
of snow cover (García-García et al., 2019). tions and in all seasons. The impact of horizontal resolution
Non-convective precipitation increases with the use of on these values is weaker than the LSM dependence over
coarser horizontal resolutions over the Rocky Mountains, each domain, showing a greater effect of resolution on max-
particularly in winter, where the model also represents a imum temperatures in summer than in winter over western
higher percentage of cloud cover with coarser resolutions North America and at high latitudes (WNA, ALA and GRL
(Fig. 8b and d). Over the east coast of the USA, the use of in Fig. 9a). Over these areas, finer horizontal resolutions are
https://doi.org/10.5194/gmd-15-413-2022 Geosci. Model Dev., 15, 413–428, 2022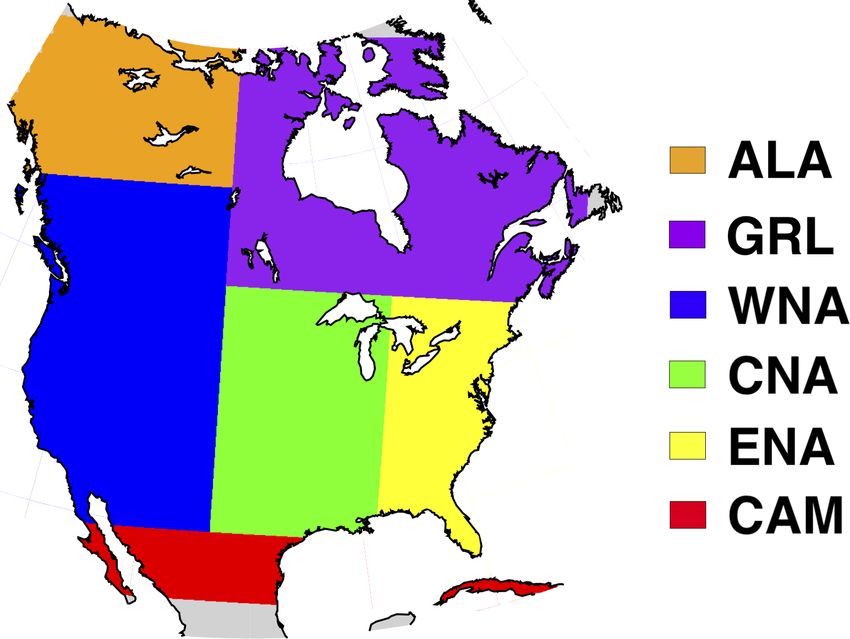
422                                    A. García-García et al.: WRF sensitivity to horizontal resolution and LSM changes

Figure 9. Regional mean annual and seasonal biases in maximum and minimum temperatures (◦ C) and in accumulated precipitation
(mm d−1 ) for all experiments and the DAYMET data product relative to the CRU database from 1980 to 2013. Biases are estimated av-
eraging over six subregions (Fig. 1) adapted from Giorgi and Francisco (2000): Central America, CAM; western North America, WNA;
central North America, CNA; eastern North America, ENA; Alaska, ALA; and Greenland, GRL.

associated with warmer JJA maximum temperatures, reduc-            yield a warmer climatology over most areas and for all sea-
ing the bias relative to the CRU dataset at middle latitudes       sons than the experiments with the other LSM components,
(Figs. 7a and 9a). In the ALA and GRL regions, the WRF             implying smaller biases in the CLM4 simulations for most of
model with the CLM4 and the NOAH-MP LSM compo-                     the regions (Fig. 9b). The WRF bias in minimum temperature
nents overestimates JJA maximum temperatures, increasing           is large in winter over the central and eastern areas of North
the bias in these simulations with the use of finer resolutions    America and at middle and high latitudes (subdomains ALA,
(Fig. 9a). The WRF bias in maximum temperatures in win-            GRL, CNA and ENA in Fig. 9b). The resolution impact on
ter is greatly improved over the boreal forest and the Rocky       these results is again weaker than the effect of the LSM com-
Mountains areas by using the CLM4 as LSM (Fig. S15).               ponent. In summer, the WRF-NOAH experiments show a
Over the same areas the CLM4 simulated very high values            large negative bias in minimum temperatures over the NA
of shortwave net radiation and sensible heat flux in compar-       southeastern coast (Fig. S16 in the Supplement), areas where
ison with the rest of the land surface models (Fig. 3a and         the same experiments also shown high values of longwave
e), which may be related to the CLM4 albedo estimate. De-          net radiation and low values of sensible heat flux (Fig. 3b and
spite the WRF underestimation of mean maximum temper-              e). The simulation of extreme minimum temperatures is also
ature, extreme maximum temperatures are overestimated by           overestimated for all experiments and regions except for the
the WRF model, particularly at high latitudes and using the        CAM region in summer, showing particularly large biases in
CLM4 LSM (Fig. 10a). As expected based on the litera-              winter (Fig. 10b). Thus, although the WRF model underes-
ture, the resolution effect on the bias in extreme maximum         timates mean maximum and minimum temperatures, it over-
temperatures is larger than on the bias in mean maximum            estimates the intensity of hot extremes associated with min-
temperatures; however LSM differences are still larger than        imum and maximum temperatures. The effect of dynamic
resolution-induced changes.                                        vegetation (NOAH-MP vs. NOAH-MP-DV) on the biases in
   The performance of the WRF model in reproducing                 extreme and mean maximum and minimum temperatures re-
daily minimum temperatures from the CRU observations is            mains constant using different resolutions, reaching larger bi-
slightly better than reproducing maximum temperatures at           ases and colder maximum and minimum temperatures with
middle and low latitudes, but it is worse at high latitudes par-   dynamic vegetation than with prescribed vegetation for most
ticularly in DJF (Fig. 9b). Experiments using the CLM4 LSM         of the regions (Fig. 9a and b).

Geosci. Model Dev., 15, 413–428, 2022                                                https://doi.org/10.5194/gmd-15-413-2022
A. García-García et al.: WRF sensitivity to horizontal resolution and LSM changes                                                       423

Figure 10. Regional mean annual and seasonal biases in extreme maximum and minimum temperatures (◦ C) and in extreme precipitation
(mm d−1 ) for all experiments and the DAYMET data product relative to the CRU database from 1980 to 2013. Extremes are calculated as
the 95th percentile of the annual and seasonal temporal series at each grid cell. Biases are estimated averaging over six subregions (Fig. 1)
adapted from Giorgi and Francisco (2000): Central America, CAM; western North America, WNA; central North America, CNA; eastern
North America, ENA; Alaska, ALA; and Greenland, GRL.

   The WRF model simulates large positive biases in daily                   In summary, the LSM impact on temperatures is larger
accumulated precipitation at the surface over most of North              than the resolution effect, while the opposite is true for pre-
America during all seasons, with larger biases in summer                 cipitation climatologies; i.e., differences in precipitation aris-
(Figs. 9c and S17 in the Supplement). A negative bias is                 ing from changes in resolution are larger than LSM differ-
also present in all experiments over the southeastern USA                ences (Fig. 9). The influence of both the LSM choice and
and the eastern coast of North America in summer and win-                resolution intensifies in summer compared with the rest of
ter (Fig. S17). Dry biases are reduced when using finer hor-             seasons probably because of the larger energy exchanges and
izontal resolutions, while wet biases are larger when using              the consequent intensification of land–atmosphere coupling
smaller scales (Fig. 9c). This is due to the intensification of          in summer (Zhang et al., 2008; Mei and Wang, 2012). The
the water cycle with the use of finer horizontal resolutions             CLM4 LSM generates the smallest biases relative to the CRU
discussed in Sect. 4.2 and presented in Figs. 6d and 8. For ex-          database in the WRF simulation of mean maximum and min-
ample in winter, the dry bias shown in all experiments over              imum temperatures; however it also yields the larger biases
the southeastern NA is associated with an increase in non-               in extreme maximum and minimum temperatures. The use
convective precipitation using finer resolutions (Figs. S17              of finer resolutions leads to slightly larger or smaller biases
and 8b). In summer, the bias in precipitation is larger us-              in the simulation of maximum and minimum temperatures
ing finer resolutions over most of coastal areas where an in-            depending on the LSM component and the region, while the
crease in convective precipitation and latent heat flux was              use of finer resolutions implies larger biases in mean and ex-
shown with the use of finer resolutions (Figs. 6d, 8a and                treme precipitation at low and middle latitudes for all LSM
S17). The impact of resolution on the accumulated precip-                components, particularly in summer.
itation is stronger than the effect of the LSM component,
which affects precipitation mainly in summer (Fig. 9). The
results show a larger bias in extreme precipitation than for             5   Discussion
the mean accumulated precipitation but yielding similar con-
                                                                         The dependence of climate simulations on the LSM com-
clusions (Fig. 10).
                                                                         ponent shown in this study agrees with conclusions drawn
                                                                         from previous analyses at different temporal and spatial

https://doi.org/10.5194/gmd-15-413-2022                                                        Geosci. Model Dev., 15, 413–428, 2022
424 A. García-García et al.: WRF sensitivity to horizontal resolution and LSM changes scales (Chen et al., 2014; Van Den Broeke et al., 2018; Liu and minimum temperatures (Figs. 9 and 10). The simulation et al., 2019; Zhuo et al., 2019; Davin and Seneviratne, 2012; of precipitation in summer is, however, slightly better repre- Mooney et al., 2013; Laguë et al., 2019; García-García et al., sented by the NOAH LSM than by the other LSM compo- 2020). For example, using the Consortium for Small-scale nents (Fig. 9). Nonetheless, the comparison of all WRF ex- Modeling (COSMO) and WRF RCMs, Davin and Senevi- periments with observations shows overestimated values of ratne (2012) and Mooney et al. (2013) identified an LSM precipitation over most of North America, which is in agree- sensitivity of temperature and precipitation conditions over ment with other studies using WRF over the western USA Europe which intensifies in summer. Additionally, our anal- (Jin et al., 2010; Chen et al., 2014) and over Europe (Pieri ysis has shown that the impact of the LSM choice on the et al., 2015). Atmospheric parameterizations were not tested WRF simulation of precipitation is weaker than its impact in our study; however, other WRF sensitivity experiments us- on temperature, in agreement with studies over a small re- ing several microphysics schemes over Europe found a posi- gion in Italy (Zhuo et al., 2019), over Europe (Mooney et al., tive bias in precipitation for all simulations, which was con- 2013), and over the western and central USA at seasonal siderably reduced in summer within a convective-permitting scales (Jin et al., 2010; Chen et al., 2014; Van Den Broeke simulation (Pieri et al., 2015); that is, the positive bias in pre- et al., 2018). The implementation and calculation of surface cipitation has been reported in WRF simulations over dif- properties (albedo, surface roughness and evaporative resis- ferent domains using several LSM components, horizontal tances) by each LSM can be the cause of the LSM differences resolutions, microphysics parameterizations and reanalysis in the simulation of energy fluxes (Laguë et al., 2019). Thus, products as initial and boundary conditions (Figs. 9 in this LSM differences in SNET are probably related to albedo val- paper, Pieri et al., 2015; Chen et al., 2014; Jin et al., 2010). ues within each LSM. The large LSM differences in sensible Therefore, the results included here, together with the results heat flux over the boreal forest are likely related to the LSM reported in the literature, suggest that the use of finer res- estimates of surface roughness, while the large latent heat olutions may raise precipitation biases in WRF simulations flux differences at low latitudes are probably associated with over North America, but the implementation of convective- different estimates of evaporative resistances and the treat- permitting processes and other atmospheric parameteriza- ment of soil water in each LSM. tions could reduce this bias. The great WRF sensibility to precipitation rates to resolu- tion is also supported by the literature (e.g., Pieri et al., 2015). Our results also show large seasonal differences, mainly 6 Conclusions caused by the different contribution of convective precipi- tation in summer and winter. In summer at middle and low This study has shown the effect of changes in horizontal res- latitudes, the use of finer grid cells leads to a change in the en- olution and LSM choice on the simulation of energy fluxes ergy partition into sensible and latent heat flux, increasing la- at the surface and temperature and water conditions near the tent heat, and decreasing sensible heat (Fig. 6). This increase surface. The effect of both model choices intensifies in sum- in latent heat flux over these areas is probably the cause of mer due to the increase in energy and water exchanges be- the higher values of convective precipitation (Fig. 8a). This tween the lower atmosphere and the land surface. Enhancing resolution-induced increase in precipitation through changes horizontal resolution leads to higher precipitation climatolo- in convective processes has also been suggested in the litera- gies for all LSMs over coastal areas at low latitudes mainly ture (Prein et al., 2016). At high latitudes both turbulent heat due to an increase in convective precipitation also associated fluxes increase in summer with the use of finer resolutions with an increase in latent heat flux. Our results highlight the mainly due to the increase in shortwave net radiation proba- important role of the LSM choice in the WRF representa- bly related to the decrease in cloud cover shown in Fig. 8d. tion of the energy partition at the surface, which mainly af- These changes in cloud cover with resolution may be caused fects the simulation of near-surface temperatures over North by the performance of the microphysical parameterizations America. Additionally, these results demonstrate the impact at different resolutions and the improvement in the represen- of the LSM choice on simulated atmospheric conditions, tation of orography (Pieri et al., 2015; Prein et al., 2016). showing LSM-dependent differences in the simulated cloud Previous evaluations of RCMs using several soil models fraction and non-convective precipitation rates. This is prob- over different domains reached the conclusion that the most ably associated with the land–atmospheric coupled character complex LSM components – that is, the LSM components of our simulations and the interactions between small- and representing more physical phenomena – outperform others large-scale dynamical processes. (Chen et al., 2014; Van Den Broeke et al., 2018; Liu et al., The evaluation of the WRF simulations against observa- 2019). Over North America, our results indicate that the tions supports the use of the CLM4 LSM as the best choice WRF simulation of temperature conditions using the CLM4 within the evaluated options for WRF simulations over North LSM outperforms the simulation of mean maximum and America, although it may overestimate temperature extreme minimum temperatures generated by the NOAH and NOAH- events. The use of finer resolutions yields a small improve- MP LSMs, but it yields larger biases in extreme maximum ment in the representation of minimum temperatures within Geosci. Model Dev., 15, 413–428, 2022 https://doi.org/10.5194/gmd-15-413-2022
A. García-García et al.: WRF sensitivity to horizontal resolution and LSM changes                                                       425

WRF at middle and high latitudes. Nonetheless, the use of              Disclaimer. Publisher’s note: Copernicus Publications remains
finer resolutions should be implemented with caution since             neutral with regard to jurisdictional claims in published maps and
it may increase the WRF bias in mean and extreme pre-                  institutional affiliations.
cipitation. Further sensitivity experiments using other atmo-
spheric parameterizations and other resolutions fine enough
for convective-permitting processes (< 5 km) or for altering           Acknowledgements. We thank the Mesoscale and Microscale Me-
the hydrostatic balance of the model (≈ 10 km) are necessary           teorology (MMM), the National Center for Atmospheric Re-
                                                                       search (NCAR), the National Oceanic and Atmospheric Admin-
to determine the best WRF configuration for downscaling cli-
                                                                       istration (NOAA), the Climatic Research Unit (CRU) at the
mate simulations over North America for paleoclimate and
                                                                       University of East Anglia and the Oak Ridge National Lab-
climate change studies. However, the large computational re-           oratory Distributed Active Archive Center (ORNL DAAC) for
sources required to perform a sensitivity analysis including           making the WRF code and the NARR, CRU and DAYMET
convective-permitting processes would require a reduction in           datasets available. This analysis contributes to the PALEOLINK
the area of interest or in the length of the simulation.               project (http://www.pastglobalchanges.org/science/wg/2k-network/
   Information provided by downscaling studies is used for             projects/paleolink/intro, last access: 4 May 2021), part of the
building climate change policies through the information col-          PAGES 2k network. All WRF simulations were performed in the
lected in assessment reports (IPCC, 2013; Mbow et al., 2017;           computational facilities provided by the Atlantic Computational Ex-
USGCRP, 2018). Thus, sensitivity studies like the one pre-             cellence Network (ACENET-Compute Canada). During the elabo-
sented here are crucial to understand and ultimately restrict          ration of this analysis, Almudena García-García and Francisco José
                                                                       Cuesta-Valero were partially funded by Hugo Beltrami’s Canada
uncertainties in climate simulations with direct benefits to
                                                                       Research Chair program, the School of Graduate Students at Memo-
society and environment. Particularly, these results should            rial University of Newfoundland and the Research Office at St.
be considered for downscaling studies over North America               Francis Xavier University. Francisco José Cuesta-Valero is also
aimed at projecting future or past conditions and informing            funded by the Alexander von Humboldt Foundation.
policymakers.

                                                                       Financial support. This research has been supported by the Cana-
Code and data availability. As described in Sect. 2, here we           dian Network for Research and Innovation in Machining Technol-
used the Research and Forecasting model (WRF, version 3.9,             ogy, Natural Sciences and Engineering Research Council of Canada
http://www.wrf-model.org, last access: 12 January 2022, Ska-           (grant no. DG 140576948), the Canada Excellence Research Chairs,
marock et al., 2008). The outputs of all simulations to-               Government of Canada (grant no. 230687), and the Canada Foun-
gether with the code used to estimate the presented re-                dation for Innovation (CFI).
sults are available at https://doi.org/10.5281/zenodo.5106087
(García-García et al., 2021). The NARR product (Mesinger
et al., 2006) was obtained from https://www.ncei.noaa.gov/data/        Review statement. This paper was edited by David Lawrence and
north-american-regional-reanalysis/access/3-hourly/ (last access:      reviewed by two anonymous referees.
12 January 2022). The CRU TS4.03 database can be downloaded
from the University of East Anglia web page (https://doi.org/
10.5285/10d3e3640f004c578403419aac167d82, University of East
Anglia Climatic Research Unit et al., 2020). The DAYMET V3             References
database (Thornton et al., 2016) is available at https://doi.org/10.
3334/ORNLDAAC/1328.                                                    Ban, N., Schmidli, J., and Schär, C.: Evaluation of the convection-
                                                                         resolving regional climate modeling approach in decade-
                                                                         long simulations, J. Geophys. Res.-Atmos., 119, 7889–7907,
                                                                         https://doi.org/10.1002/2014JD021478, 2014.
Supplement. The supplement related to this article is available on-
                                                                       Barlage, M., Zeng, X., Wei, H., and Mitchell, K. E.: A global
line at: https://doi.org/10.5194/gmd-15-413-2022-supplement.
                                                                         0.05◦ maximum albedo dataset of snow-covered land based
                                                                         on MODIS observations, Geophys. Res. Lett., 32, L17405,
                                                                         https://doi.org/10.1029/2005GL022881, 2005.
Author contributions. AGG designed the modelling experiment,           Bonan, G. B.: Ecological climatology: concepts and applications,
performed the simulations and analyzed model outputs. All authors        Cambridge University Press, Cambridge, UK, ISBN 521 80476
(AGG, FJCV, HB, JFGR and EGB) contributed to the interpretation          0, 2002.
and discussion of results. AGG wrote the manuscript with continu-      Chen, F., Liu, C., Dudhia, J., and Chen, M.: A sensitivity study of
ous feedback from FJCV, HB, JFGR and EGB.                                high-resolution regional climate simulations to three land surface
                                                                         models over the western United States, J. Geophys. Res.-Atmos.,
                                                                         119, 7271–7291, https://doi.org/10.1002/2014JD021827, 2014.
Competing interests. The contact author has declared that neither      Collins, W. D., Rasch, P. J., Boville, B. A., Hack, J. J., Mc-
they nor their co-authors have any competing interests.                  Caa, J. R., Williamson, D. L., Kiehl, J. T., Briegleb, B., Bitz, C.,
                                                                         and Lin, S.-J.: Description of the NCAR community atmo-
                                                                         sphere model (CAM 3.0), NCAR Tech. Note NCAR/TN-464+

https://doi.org/10.5194/gmd-15-413-2022                                                       Geosci. Model Dev., 15, 413–428, 2022
You can also read


