Microbial activity responses to water stress in agricultural soils from simple and complex crop rotations
←
→
Page content transcription
If your browser does not render page correctly, please read the page content below
SOIL, 7, 547–561, 2021

                                                                                                          SOIL
https://doi.org/10.5194/soil-7-547-2021
© Author(s) 2021. This work is distributed under
the Creative Commons Attribution 4.0 License.

            Microbial activity responses to water stress in
       agricultural soils from simple and complex crop rotations
          Jörg Schnecker1 , D. Boone Meeden2 , Francisco Calderon3 , Michel Cavigelli4 , R. Michael Lehman5 ,
                                      Lisa K. Tiemann6 , and A. Stuart Grandy2
              1 Department  of Microbiology and Ecosystem Science, University of Vienna, Vienna 1090, Austria
                                   2 Department of Natural Resources and the Environment,

                                   University of New Hampshire, Durham, NH 03824, USA
                    3 College of Agricultural Sciences, Oregon State University, Corvallis, OR 97333, USA
                   4 Sustainable Agricultural Systems Laboratory, USDA-ARS, Beltsville, MD 20705, USA
                 5 North Central Agricultural Research Laboratory, USDA-ARS, Brookings, SD 57006, USA
         6 Department of Plant, Soil and Microbial Science, Michigan State University, East Lansing, MI 48824, USA

                               Correspondence: Jörg Schnecker (joerg.schnecker@univie.ac.at)

                                       Received: 2 April 2021 – Discussion started: 3 May 2021
                              Revised: 9 July 2021 – Accepted: 26 July 2021 – Published: 26 August 2021

       Abstract. Increasing climatic pressures such as drought and flooding challenge agricultural systems and their
       management globally. How agricultural soils respond to soil water extremes will influence biogeochemical cycles
       of carbon and nitrogen in these systems. We investigated the response of soils from long-term agricultural field
       sites under varying crop rotational complexity to either drought or flooding stress. Focusing on these contrasting
       stressors separately, we investigated soil heterotrophic respiration during single and repeated stress cycles in soils
       from four different sites along a precipitation gradient (Colorado, MAP 421 mm; South Dakota, MAP 580 mm;
       Michigan, MAP 893 mm; Maryland, MAP 1192 mm); each site had two crop rotational complexity treatments.
       At the driest (Colorado) and wettest (Maryland) of these sites, we also analyzed microbial biomass, six potential
       enzyme activities, and N2 O production during and after individual and repeated stress cycles. In general, we
       found site specific responses to soil water extremes, irrespective of crop rotational complexity and precipitation
       history. Drought usually caused more severe changes in respiration rates and potential enzyme activities than
       flooding. All soils returned to control levels for most measured parameters as soon as soils returned to control
       water levels following drought or flood stress, suggesting that the investigated soils were highly resilient to the
       applied stresses. The lack of sustained responses following the removal of the stressors may be because they are
       well in the range of natural in situ soil water fluctuations at the investigated sites. Without the inclusion of plants
       in our experiment, we found that irrespective of crop rotation complexity, soil and microbial properties in the
       investigated agricultural soils were more resistant to flooding but highly resilient to drought and flooding during
       single or repeated stress pulses.

1   Introduction                                                     trient cycling, both of which are likely to alter with climate
                                                                     change (Bowles et al., 2018).
                                                                        Soil microorganisms, which drive nutrient and carbon cy-
Future climate scenarios predict increasingly frequent and           cling, will regulate how soils respond to these shifts in pre-
extreme weather events, with both more severe droughts and           cipitation patterns. Both drought and flooding influence mi-
flooding (Stocker et al., 2013). How these shifts in precipita-      crobial processes and functions (Schimel, 2018), which in
tion patterns affect agricultural systems is of special interest     turn may feedback to plant–soil interactions (Canarini and
due to their roles in food security and global carbon and nu-

Published by Copernicus Publications on behalf of the European Geosciences Union.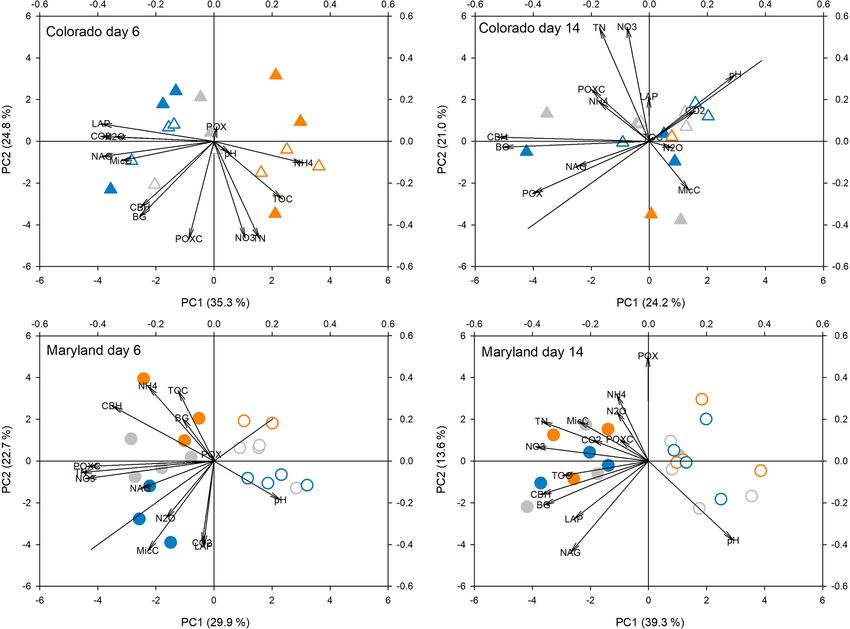
548                                      J. Schnecker et al.: Microbial activity responses to water stress in agricultural soils

Dijkstra, 2015; Kaisermann et al., 2017). For example, re-        that improve their stress responses (Griffiths and Philippot,
duced water content in soils can cause microbial death or         2013). Land management history can affect soil microbial
sporulation and thereby strongly reduce overall microbial ac-     diversity, which in turn can affect how soil responds and re-
tivity (Herron et al., 2009). Even under less severe reductions   covers from disturbances (Jackson et al., 2003). Microbial di-
in soil water content, microbial activity decreases since dif-    versity in agricultural soils has been shown to increase with
fusion, microorganisms’ main means of substrate transport         crop rotation complexity (Tiemann et al., 2015; Venter et al.,
(Bailey et al., 2017; Schimel, 2018; Tecon and Or, 2017), is      2016) and especially the introduction of cover crops (Vukice-
reduced in concert with reduced connectivity of microorgan-       vich et al., 2016). These management practices also result in
isms and soil organic matter and nutrients (Linn and Doran,       increased soil microbial biomass (McDaniel et al., 2014) and
1984; Schnecker et al., 2019). Lower soil water may also lead     organic matter (Ding et al., 2006; McDaniel et al., 2014),
to higher soil solute concentrations, enhancing osmotic stress    while reducing agroecosystem nitrogen loss and improving
for microorganisms (Killham and Firestone, 1984; Wood,            crop yields under climate stress (Bowles et al., 2020). While
2015).                                                            there is evidence to support a link between crop rotation
   As soils recover from drought and are rewetted, numer-         complexity and resilience of crop yields under climate stress
ous studies have observed an increase of respiration rates        such as drought or flooding, it remains unclear if microbial
that often exceed control levels for days after rewetting         communities in these complex cropping systems are also re-
(Birch, 1958; Fierer and Schimel, 2002; Li et al., 2010). This    silient.
“Birch effect” (Birch, 1958) is associated with an increase of       Drought and flooding are contrasting forms of stress for
available dissolved organic carbon (DOC) through microbial        microorganisms and challenge them in very different ways;
death during drought (Schimel, 2018) or caused by the lower       however, drought and flooding are usually studied simul-
drought sensitivity of extracellular enzymes compared to mi-      taneously. Flooding in particular is usually studied only as
croorganisms, which results in enzymes solubilizing soil or-      rewetting events after drought (Birch, 1958; Schimel, 2018).
ganic matter (SOM) that is not taken up by the inactive mi-       Therefore, classic drought–rewetting experiments provide
crobes until rewetting (Schimel, 2018; Steinweg et al., 2013).    only limited insight into microbial response to the individ-
   Under water-saturated conditions, soils run the risk of oxy-   ual stressors: drought and flooding.
gen (O2 ) deficiency leading to less efficient microbial en-         The aim of this study was to test microbial responses to
ergy generation and production of potent greenhouse gases         one-time and recurring episodes of drought or flooding and
(Berglund and Berglund, 2011; Linn and Doran, 1984;               whether and how these responses are moderated by a history
Randle-Boggis et al., 2018; Smith et al., 2003). Rewetting        of crop diversification. In a laboratory incubation we manip-
can displace CO2 from soil pores, causing a degassing that        ulated water regimes in soils from four long-term crop rota-
can in turn affect microbial metabolism (Calderón and Jack-       tion experiments across the USA. At each site we selected a
son, 2002). In agricultural systems, anaerobic conditions         low (two crops, “simple rotation”) versus high (three or more
or repeated changes from wet to dry conditions can lead           crops, “complex rotation”) diversity rotation for comparison.
to nitrous oxide (N2 O) production and alter the cycling of       The sites range from low (Colorado) to intermediate (Michi-
bioavailable nitrogen (Bowles et al., 2018; Davidson, 1992;       gan and South Dakota) and high (Maryland) precipitation.
Muhr et al., 2008).                                               Soils from different regions were chosen to examine whether
   How microorganisms respond to stress determines if spe-        potential adaptations to drought and/or flooding depend on
cific microbial processes and functions can withstand or be       historical climate. Replicate sets of soil samples were either
buffered against stress. Resistance to stress is the ability of   alternately dried and rewetted to optimum moisture content
microbial communities to withstand prevailing stressors (Al-      (“drought”), alternately flooded and dried to optimum mois-
lison and Martiny, 2008) and reduce the amplitude of the          ture (“flooding”), or maintained at a constant water content
stress response. Along with resistance, stress response can       (control). We monitored heterotrophic soil respiration (CO2
be defined by resilience, which characterizes the duration of     production) during five moisture stress cycles. Additionally,
the stress response. A resilient microbial community quickly      we determined microbial biomass, enzyme activities, and ni-
returns to pre-stress levels (Allison and Martiny, 2008). In      trogen pools and fluxes during the first and last stress cycle
addition to these initial or one-time microbial reactions to      in soils from sites with the precipitation extremes.
abiotic stress, microbial communities may also adapt to re-
occurring stressors (DeAngelis et al., 2010; Evans and Wal-
                                                                  2     Material and methods
lenstein, 2012) by progressively reducing the initial ampli-
tude and/or duration of the stress response with each recur-      2.1    Sampling sites
ring stress event.
   Adaptation to recurring stress is more likely to occur with    Soils were collected in October 2015 from long-term crop ro-
greater microbial diversity, which often correlates with func-    tation experiments at USDA-ARS sites in Akron, Colorado
tional redundancy (Girvan et al., 2005) and the probability       (CO); Beltsville, Maryland (MD); and Brookings, South
that members of the community have physiological traits           Dakota (SD) and at the W.K. Kellogg Biological Station

SOIL, 7, 547–561, 2021                                                                https://doi.org/10.5194/soil-7-547-2021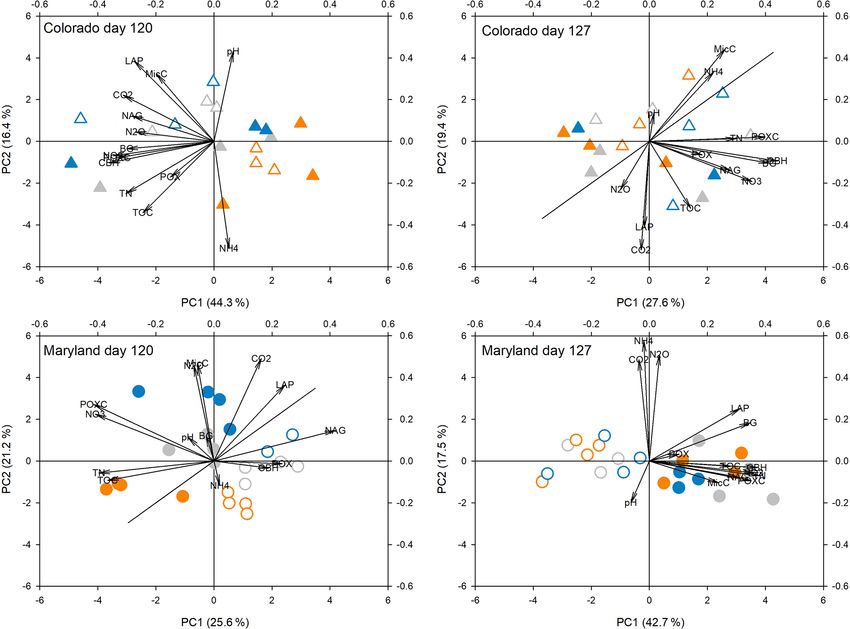
J. Schnecker et al.: Microbial activity responses to water stress in agricultural soils                                     549

(KBS) Long-Term Ecological Research Site (LTER), Michi-           2.3   Soil carbon, water content, water holding capacity,
gan (MI). All sites maintain field experiments that include             and pH
treatments with different rotation lengths. Composite topsoil
samples from within the first 10 cm were collected from three     Samples for total carbon and nitrogen analysis were dried at
(Colorado) to four (Maryland, South Dakota, Michigan) field       60◦ for 24 h and finely ground in a ball mill before subsam-
plot replicates in simple (two crops in rotation) and com-        ples were packed in tin capsules and total carbon measured
plex rotational treatments (three or more) each. Soils from       on an elemental analyzer (Costech Instruments ECS 4010)
Maryland, South Dakota, and Michigan were sampled under           (Paul et al., 2001). Total carbon content as well as water
corn and those from Colorado were sampled under wheat.            holding capacity were determined for all soils prior to the in-
Site descriptions can be found in Table 1 and in Cavigelli et     cubation experiment. Water holding capacity was measured
al. (2008), Lehman et al. (2017), Tiemann et al. (2015), and      by determining soil water content after saturating the soils
White et al. (2019).                                              with water in a funnel with filter and letting the excess water
                                                                  leach gravimetrically for 2 d while preventing evaporation by
                                                                  covering the funnels with Parafilm (Paul et al., 2001). Water
2.2   Experimental setup
                                                                  content and pH were determined for all soils before the start
After sampling, soils were sieved and shipped on ice to the       of the incubation and during the 10 destructive samplings for
University of New Hampshire and refrigerated at 5◦ for less       Colorado and Maryland soils. Water content was determined
than 1 week. Approximately 30 g soil from each replicate          gravimetrically in sample aliquots that were dried in a forced
plot (three from Colorado and four from each of the other         draft oven at 60◦ for 24 h. Soil pH was determined in a 1 : 5
sites) were weighed into 100 mL plastic cups resulting in         soil to water mixture using a Mettler Toledo SevenEasy pH
a total of 27 cups per replicate from Colorado and Mary-          Meter 20.
land and six for South Dakota and Michigan. Soils in the
microcosms were adjusted to 50 % water holding capacity
                                                                  2.4   CO2 and N2 O production
(WHC). One set of cups was covered with Parafilm and kept
at constant water content by replacing evaporated water once      CO2 production was measured daily for the first week, twice
a week and after every CO2 measurement over the course of         a week after that, and just before the destructive harvests.
165 d. One set of cups was subjected to drought and another       For respiration measurements, cups were temporarily closed
to flooding (Fig. 1). All soil microcosms were kept at a con-     airtight with lids fitted with rubber septa that served as a
stant temperature of 25◦ . Microcosms for the drought treat-      sampling ports. We took 3 mL of the headspace using a sy-
ment were allowed to gradually dry out over the course of 3 d,    ringe immediately after closing the sample and after 30 min
kept at peak drought for 4 d, and slowly brought back to 50 %     to 2 h, depending on the incubation duration within the ex-
WHC by adding one third of the evaporated water every day         periment and the carbon content of the samples; longer in-
for 3 d to avoid even short time flooding effects. Microcosms     cubation times were used at the end of the experiment and
for the flooding treatment were gradually brought to 100 %        for soils with lower total carbon contents. The gas samples
WHC but not higher to avoid submerging the soils in water         were immediately injected into an infrared gas analyzer (LI-
over the course of 3 d, then kept at 100 % WHC for 4 d, and       COR LI 820) to measure CO2 concentration. Rates of CO2
then kept open to dry back to 50 % WHC again within 3 d.          production were calculated from the increase of CO2 con-
Drought and wetting were repeated after 2 weeks of the soils      centration in the headspace of the jar over time, accounting
being held at constant WHC. Soils were subjected to a total       for the jar and syringe volume and temperature and assuming
of five stress cycles during the first 125 d of the total 165 d   a linear increase between the two sampling time points. Cu-
incubation period. Soils from all sites, rotations, and water     mulative respiration was calculated by using respiration rates
treatments were set up twice. To determine long-term recov-       measured at a certain time point and multiplying that flux by
ery, one set was subjected to only one stress cycle and was       the number of days to the next respiration measurement and
kept at 50 % WHC for 6 weeks after the stress. The second set     summing all resulting CO2 emissions (Grandy and Robert-
was subjected to a total of five stress cycles. For each com-     son, 2007). To compare cumulative respiration among sites,
bination of rotation complexity, water treatment, and harvest     values are expressed as µg CO2 -C per gram soil carbon.
we had three replicates from Colorado and four from Mary-            For the determination of N2 O production, which was mea-
land, South Dakota and Michigan.                                  sured at every destructive harvest, cups were inserted in pint-
   To determine soil carbon and nitrogen pools and microbial      sized mason jars and sealed airtight with a lid fitted with
enzyme activities in soils from Colorado and Maryland with        a rubber septum. Right after closing the jars, a headspace
the lowest and highest MAP, respectively, we set up 10 sets       sample of 30 mL was taken with a syringe and needle and
of each of the control, drought, and flooding treatments for      transferred into pre-evacuated Exetainers. The jars then re-
each of the sites. One set from each site was destructively       mained closed for 24 h before a second sample was taken
harvested before, at the peak of, right after, 2 weeks after,     and transferred to Exetainers. N2 O concentration in the Exe-
and 6 weeks after the first and last stress cycle (Fig. 1).       tainers was determined using a Shimadzu GC-2014 equipped

https://doi.org/10.5194/soil-7-547-2021                                                               SOIL, 7, 547–561, 2021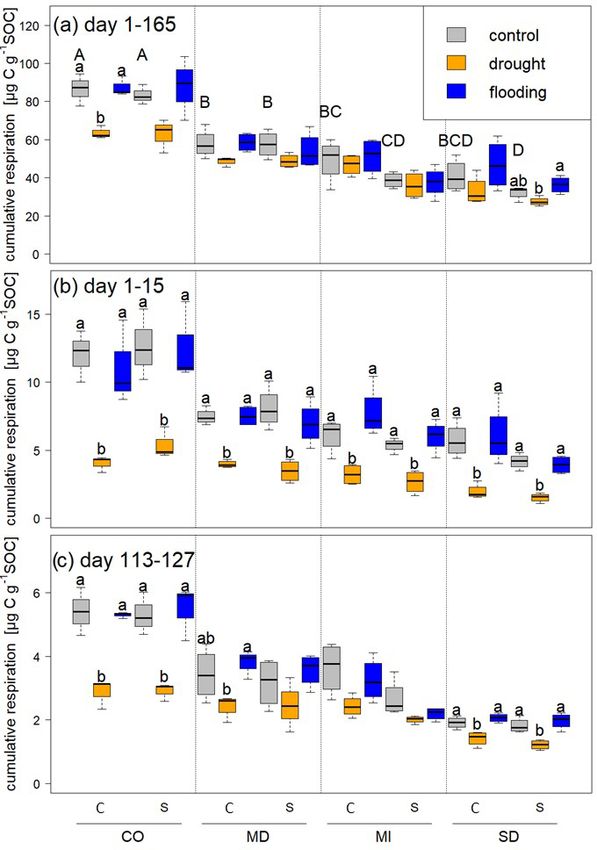
550                                          J. Schnecker et al.: Microbial activity responses to water stress in agricultural soils

Table 1. Information on the sites used in the laboratory incubation experiment. MAT is mean annual temperature, MAP is mean annual
precipitation, and SOC is soil organic carbon content. Asterisks indicate a significant difference between simple and complex rotations.

   Site                  Coordinates       Experiment MAT      MAP     Soil                 Plants in rotation             SOC %
                                           established (◦ )    (mm)    texture
                                                                                     Complex            Simple       Complex      Simple
                                                                                     rotation           rotation      rotation   rotation
   USDA-ARS Akon,        40◦ 070 4000 N    1995          9.8    421    Weld silt     Wheat–corn–        Wheat–             0.7       0.8
   Colorado (CO)         103◦ 070 5800 W                               loam          millet–pea         millet
   USDA-ARS              44◦ 200 2700 N    2000          6.2    580    Sandy         Corn–              Corn–              2.2       2.1
   Brookings,            96◦ 470 1800 W                                clay loam     soybean–           soybean
   South Dakota (SD)                                                                 wheat–
                                                                                     sunflower
   W.K. Kellogg          42◦ 240 2300 N    2000          8.9    893    Loam          Corn–              Corn–              0.8       0.8
   Biological Station,   85◦ 220 3200 W                                and           soybean–           soybean
   Michigan (MI)                                                       sandy         wheat
                                                                       loam
   USDA-ARS              39◦ 010 2700 N    1996        13.6    1192    Silt loam     Corn–              Corn–             1.3∗       1.0
   Beltsville,           76◦ 550 2900 W                                              soybean–           soybean
   Maryland (MD)                                                                     wheat–alfalfa–
                                                                                     alfalfa–alfalfa

Figure 1. Mean water holding capacity of all four sites and rotation lengths during the course of the experiment. Symbols and lines in blue
represent the flooding treatment; orange, the drought treatment; and gray, the control. Dashed vertical lines represent destructive harvests
(1–4 and 6–10) of subsets on days 6, 14, 27, 113, 120, 127, 141, and 165. To study long-term recovery, an additional set of samples (not
shown) underwent only the first stress cycle and was subsequently kept at 50 % WHC until harvest on day 55 (harvest 5).

with an ECD detector. N2 O flux was calculated as the differ-            tion (Brookes et al., 1985; Vance et al., 1987). Two grams
ence in N2 O concentration between samples collected right               of fresh soil were fumigated in a desiccator under chloro-
after sealing and after 24 h divided by the time of incubation           form atmosphere for 24 h in the dark and then extracted with
and the amount of dry soil in the cup and accounting for jar             1 M KCl. Extracts of fumigated samples were measured on
and syringe volume and temperature.                                      the TOC-L CPH/CPN analyzer and microbial carbon was
                                                                         calculated as the difference in EOC between the fumigated
                                                                         and the fresh soil extracts. Microbial carbon is presented
2.5   Extractable organic carbon (EOC), total extractable                without the use of a correction factor for extraction effi-
      nitrogen (TEN), ammonium, nitrate, and microbial                   ciency. EOC, TEN, NH4 , NO3 , and MBC were determined
      biomass carbon (MBC)                                               at every destructive harvest.
Extractable organic carbon and total extractable nitrogen
were measured in 1 M KCl extracts (15 mL) from approxi-                  2.6     Enzyme activities
mately 2 g of soil using a TOC-L CPH/CPN analyzer (Shi-
madzu). Ammonium and nitrate concentrations were mea-                    Potential extracellular enzyme activities were measured,
sured in the same extracts by colorimetric assays as de-                 with adaptations, as described in Schnecker et al. (2015).
scribed by Hood-Nowotny et al. (2010). Microbial biomass                 In short, 2 g of soil were suspended and homogenized in
carbon was determined using chloroform-fumigation extrac-                100 mL of 100 mM sodium acetate buffer at pH 5.5. For

SOIL, 7, 547–561, 2021                                                                           https://doi.org/10.5194/soil-7-547-2021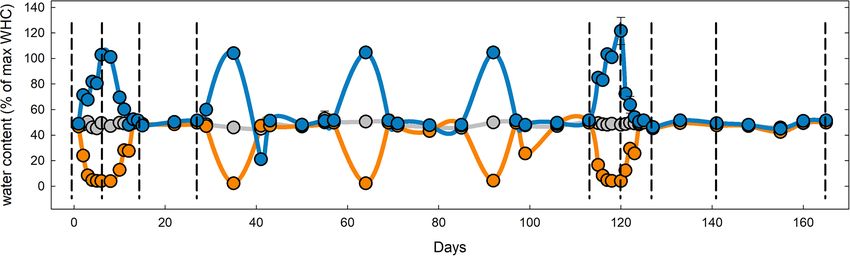
J. Schnecker et al.: Microbial activity responses to water stress in agricultural soils                                          551

each sample and each enzyme, five wells of a black mi-             appropriate for each variable’s normality and homogeneity
crotiter plate were filled with 200 µL of the soil slurry.         of variance). We further used all data measured at destruc-
The respective wells were amended substrates labeled               tive harvests, with the exception of water content, individu-
with MUF (4-methylumbelliferyl): β-D-glucopyranoside               ally for each harvest date and including all water treatments
for β-glucosidase (BG), β-D-cellobioside for cellobio-             at peak stress and right after the stress during the first and last
hydrolase (CBH), and N-acetyl-β-D-glucosaminide for                stress cycles (days 6, 14, 120, and 127) in principal compo-
N-acetyl-glucosaminidase (NAG). L-Leucine-7-amido-4-               nents analysis (PCA). We used one-way ANOVA and Tukey
methyl coumarin was used as substrate for leucine-amino-           HSD as a post hoc test on the first two axes of the PCAs to
peptidase (LAP). Plates for the assays of BG, CBH,                 evaluate differences among water treatments, crop rotation
NAG, and LAP were incubated for 140 min. Afterwards,               complexity treatments, and their interaction. Before analy-
activity was measured fluorimetrically (excitation 365 nm          sis, data were log-transformed or rank-normalized to meet
and emission 450 nm). Phenoloxidase (POX) and per-                 the assumptions for ANOVA. Differences and correlations
oxidase (PEX) activities were measured using L-3,4-                were assumed to be significant at p < 0.05. Statistics were
dihydroxyphenylalanine (DOPA) as a substrate in a photo-           performed in R 3.3.2 (R Development Core Team, 2013).
metric assay. Three 1 mL samples of the original soil slurry
was mixed with 1 mL of a 20 mM DOPA solution. After
                                                                   3     Results
shaking and centrifuging, two wells of each transparent mi-
crotiter plate were filled with 250 µL of the supernatant. One     3.1    Differences among sites and rotations
of these wells additionally received 10 µL H2 O2 (0.3 %) for
determination of peroxidase activity. Plates for oxidative en-     The sites used in this study represent a gradient in MAP from
zyme activities were measured photometrically (absorbance          an arid system in Colorado (MAP 421 mm) to a site with
450 nm) at the beginning and after incubation for 20 h. PEX        relatively high MAP in Maryland (1192 mm), with South
activity was calculated as the difference in the increase in       Dakota (580 mm) and Michigan (892 mm) providing inter-
color during the incubation time between the wells with and        mediate MAP. Soil organic carbon (SOC) content varied
without H2 O2 addition. All other enzyme activities were cal-      greatly between sites, being highest in South Dakota, fol-
culated as the increase in color or fluorescence during the in-    lowed by Maryland, Colorado, and Michigan (Table 1). Sig-
cubation time. Potential enzyme activities were determined         nificant differences in SOC content between rotation lengths
at every destructive harvest.                                      could only be found in Maryland where soils from the com-
                                                                   plex rotation had an average of 1.3 % OC and soils from the
2.7   Labile carbon
                                                                   simple rotation length had 1.0 % OC; notably, this was also
                                                                   the only site that included a perennial crop in the complex
To quantify labile soil carbon we used the permanganate ox-        rotation.
idizable carbon (POXC) method (Weil et al., 2003) as de-
scribed in Culman et al. (2012). In short, 2.5 g of air-dried      3.2    Heterotrophic respiration response to drought and
soil were mixed with 18 mL of deionized water and 2 mL of                 flooding
0.2 M KMnO4 stock solution and shaken for 2 min at 240 os-
cillations per minute on an oscillating shaker. Tubes were re-     Respiration decreased significantly in response to drought in
moved from the shaker and allowed to settle for 10 min. After      soils from all sites and crop rotation complexities and re-
10 min, 0.5 mL of the supernatant was mixed with 49.5 mL           turned to control levels as soon as microcosms were returned
of deionized water. An aliquot (200 µL) of each sample was         to 50 % WHC after the first (day 1–15) and fifth (day 113–
loaded into a 96-well plate containing a set of internal stan-     127) stress cycle (Fig. 2). In some cases (Maryland first
dards, a soil standard, and a solution standard (laboratory ref-   and fifth stress, South Dakota fifth stress, and Michigan fifth
erence samples). Sample absorbance was read with a spec-           stress) respiration in rewetted microcosms exceeded respira-
trometer at 550 nm. POXC was determined at every destruc-          tion in control microcosms. Soils from simple and complex
tive harvest for Colorado and Maryland soils.                      rotations did not differ in the response to drought, but in some
                                                                   cases differed in their recovery from the stress, most notably
2.8   Statistics
                                                                   in soils from Maryland and South Dakota where soils from
                                                                   simple rotations showed lower respiration rates. In general,
To evaluate the effect of the specific stress treatments, we       soils experienced slight but mostly not significant increases
calculated response ratios of all variables measured during        in respiration in response to flooding. In the Colorado simple
destructive harvests as the values for the treated samples di-     rotation, the Maryland simple rotation, the Michigan com-
vided by the values for the control samples under constant         plex rotation, and both South Dakota rotations, flooding sig-
water conditions. To evaluate differences between the control      nificantly increased respiration only on day 4 and thereafter
and treatment samples, we performed two-sample compari-            was indistinguishable from the control until the end of the
son tests (t-test, Welch’s t-test or Mann–Whitney U test as        first stress. Soils from the complex rotation in South Dakota

https://doi.org/10.5194/soil-7-547-2021                                                                   SOIL, 7, 547–561, 2021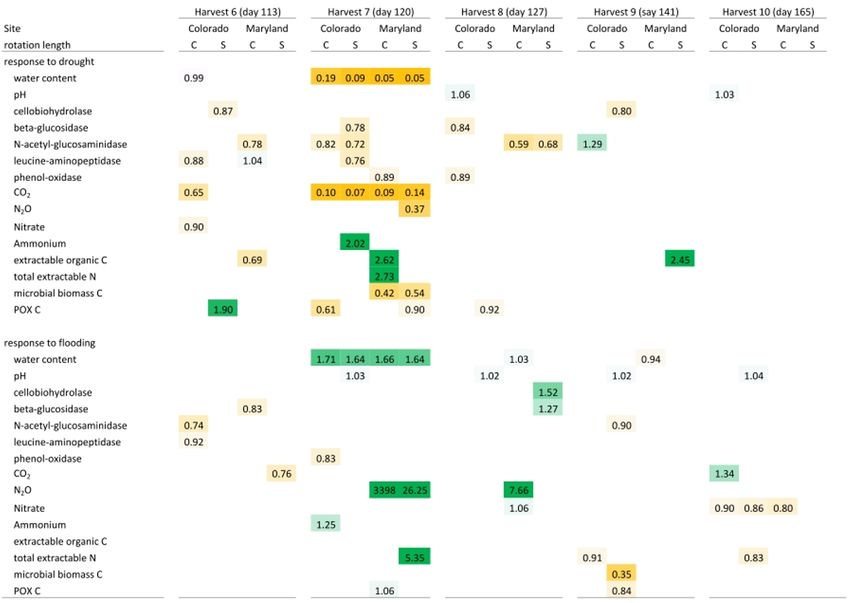
552 J. Schnecker et al.: Microbial activity responses to water stress in agricultural soils
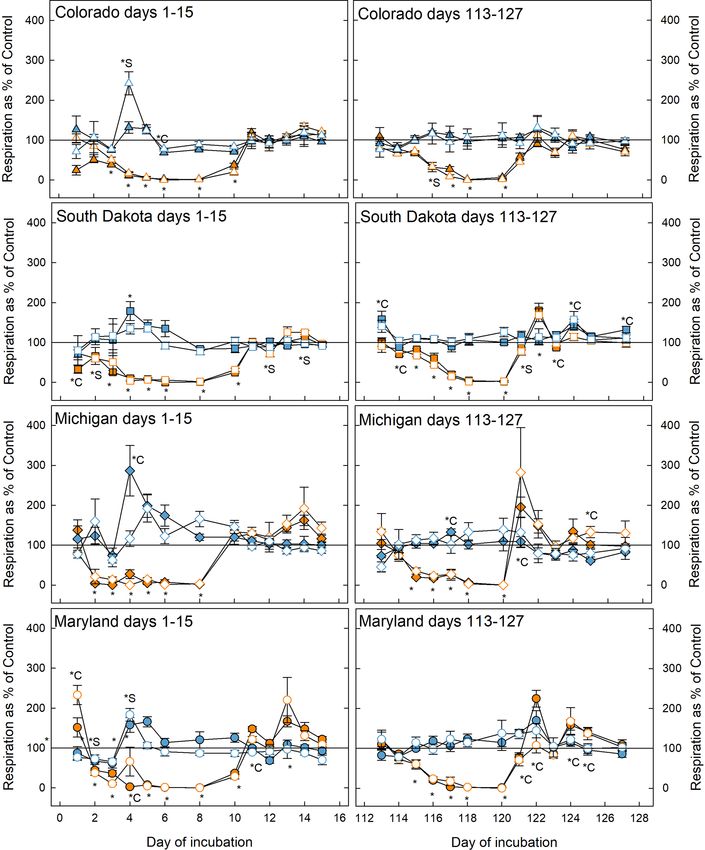
Figure 2. Soil respiration rates during the first (left panels) and fifth (right panels) stress cycles relative to the control at 50 % WHC. Blue
symbols represent microcosms exposed to flooding and orange symbols represent drought treatment. Open symbols are simple rotations and
filled symbols are the complex rotations at the respective sites. The ∗ symbol indicates that the treatment significantly changed respiration
with respect to the control; ∗ C and ∗ S mean that only soil samples from complex or simple rotations, respectively, had significantly different
respiration rates than the respective control. If indicators for significance are above the graphs, they refer to the flooding treatment; below,
they refer to the drought treatment. Significant difference was assumed at p < 0.05.
further showed an increase in respiration during the recovery ment. During the fifth stress cycle, CO2 losses were signifi-
from flooding after the fifth stress. cantly lower with drought compared to control and flooding
in soils from Colorado and South Dakota under both rotation
regimes, and drought-stressed soils from the Maryland com-
3.3 Cumulative respiration plex rotation lost significantly less CO2 than flooded micro-
We measured cumulative respiration to estimate soil carbon cosms. Total loss of carbon as CO2 (calculated per gram of
loss. Respiration was highest in soils from Colorado, fol- SOC) over the entire incubation period tended to be lower in
lowed by those from Maryland, Michigan, and South Dakota microcosms experiencing repeated drought compared to the
(Fig. 3). During the first stress cycle, soils from all sites lost control and flooded microcosms (Fig. 3a). However, drought-
significantly less CO2 under drought compared to control and stressed soils under complex rotation in Colorado lost signif-
flooding treatments (Fig. 3b), but CO2 did not differ between icantly less carbon as CO2 than the control and flooded soils,
flooded and control soils at any site for a given rotation treat- and soils from simple rotations in South Dakota lost more
SOIL, 7, 547–561, 2021 https://doi.org/10.5194/soil-7-547-2021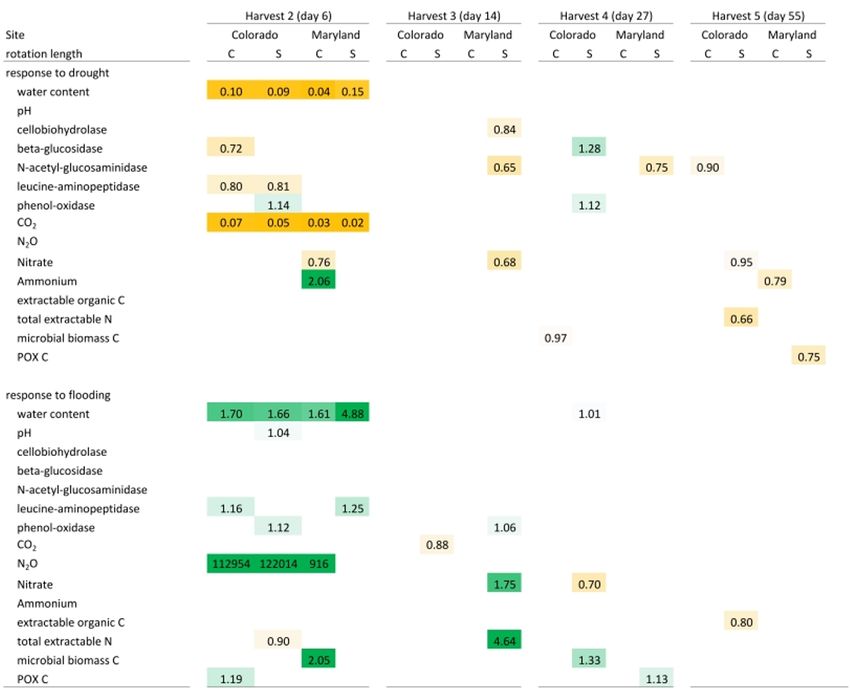
J. Schnecker et al.: Microbial activity responses to water stress in agricultural soils                                                  553

                                                                           creased during the fifth drought cycle in all Maryland soils.
                                                                           Microbial biomass in soils from Colorado was not affected
                                                                           by the treatments. In Colorado, all enzyme activities de-
                                                                           creased with drought while NAG alone increased with flood-
                                                                           ing. This was not the case in Maryland soils, where en-
                                                                           zyme activities remained constant through water stress or
                                                                           changed only after the stress was over. Only a few parame-
                                                                           ters changed similarly during the first and fifth stress periods.
                                                                           LAP decreased during the first and fifth drought stresses in
                                                                           the simple Colorado rotation treatment. Production of N2 O
                                                                           increased in response to the first and fifth flooding in the
                                                                           Maryland complex rotation soil; in this rotation treatment
                                                                           NAG decreased after both the first and fifth drought. All other
                                                                           parameters affected by the stress treatment changed only dur-
                                                                           ing either the first or fifth stress in single site-rotation combi-
                                                                           nations at peak stress or following the stress.

                                                                           3.5    Recovery from stress

                                                                           Principal component analyses caused samples from flood-
                                                                           ing and drought treatment to cluster in to separate groups
                                                                           (PCAs; Fig. 4). Samples clustered similarly and treatment
                                                                           differences on individual PCA axes were significant (Ta-
                                                                           ble 2) during the first (Fig. 4) and fifth stress (Fig. 5). In
                                                                           both cases these differences were no longer significant af-
                                                                           ter the end of drought and flooding, when microcosms re-
                                                                           turned to 50 % WHC (Figs. 4 and 5; Table 2). In the case of
                                                                           the Maryland samples, significant differences could be found
                                                                           between simple and complex rotations during and after the
Figure 3. Cumulative respiration calculated per gram of SOC over           first and fifth stress periods. Differences between rotations in
(a) the whole experimental period, (b) during the first stress pe-
                                                                           Colorado were only found after the fifth stress period.
riod, and (c) during the fifth stress period. Statistically significant
differences among control, drought, and flooding treatments for a
given site and rotation complexity (C is a complex rotation and S
                                                                           4     Discussion
is a simple rotation) are indicated by letters. Capital letters indicate
differences among control treatments of all sites and rotations.
                                                                           Drought and flooding represent severe stressors for soil mi-
                                                                           crobial communities. In our study of soils under low- and
                                                                           high-diversity crop rotation regimes from agricultural sites
carbon when flooded compared to drought; control soils were
                                                                           across the U.S., we found that short-term drought – and to a
not significantly different with either stress treatment.
                                                                           lesser degree, flooding – led to overall significant and stress-
                                                                           specific changes in microbial processes and functions. Res-
3.4   Effect of drought and flooding on soil carbon and                    piration was strongly reduced in all sites and rotation treat-
      nitrogen pools and microbial functions in the driest                 ments during drought stress. Flooding caused N2 O produc-
      (CO) and wettest (MD) locations                                      tion in soils from three of four sites during the first flood-
                                                                           ing event, though this effect remained after the fifth flood-
Flooding and drought caused significant changes in soil ni-                ing only in soils from Maryland. We found potential site-
trogen and carbon pools, microbial biomass, microbial en-                  dependent legacy effects for CO2 release at the drier Col-
zyme activities, and nitrous oxide production. Except for ex-              orado site where we found the highest specific cumulative
perimentally manipulated water content and a decrease in                   respiration rates of all sites (Fig. 3) and a consistent lack
respiration during drought, no variables changed consistently              of the Birch effect (Birch, 1958). Interestingly, soils man-
and significantly among soils from Colorado and Maryland                   aged under rotations of only two crops versus three or four
(Tables 3 and 4). In general, drought tended to decrease mea-              did not significantly differ in their response to stress. In gen-
sured parameters, while flooding increased them. Microbial                 eral, all soils – irrespective of site and rotational complexity
biomass carbon increased during the first flooding event in                – responded strongly to drought and flooding but recovered
soils from complex rotations in Maryland and strongly de-                  quickly to control levels when water content returned to 50 %

https://doi.org/10.5194/soil-7-547-2021                                                                           SOIL, 7, 547–561, 2021
554 J. Schnecker et al.: Microbial activity responses to water stress in agricultural soils
Figure 4. Principal components analysis of all response parameters at first peak stress (day 6) and following the first stress (day 14) in soils
from Colorado and Maryland. Blue symbols are the flooding treatment and orange symbols are the drought treatment. Gray symbols are the
control. Open symbols represent simple and filled symbols represent complex rotations. Significant differences between treatments along the
axes are shown in Table 2. Included parameters are pH, extractable organic carbon (EOC), total extractable nitrogen (TEN), microbial biomass
carbon (MBC), NH4 , NO3 , activities of β-glucosidase (BG), cellobiohydrolase (CBH), N-acetyl-glucosaminidase (NAG), leucine-amino-
peptidase (LAP), phenoloxidase (POX) and peroxidase (PEX), respiration (CO2 ), N2 O production (N2 O), and permanganate oxidizable
carbon (POXC).
Table 2. Results from analysis of variance of treatments on axis from PCAs as seen in Figs. 4 and 5. Bold values represent significant
differences between treatments (drought, flooding, and control).
PC1 PC2
Treatment Rotation Interaction Treatment Rotation Interaction
F p F p F p F p F p F p
Colorado day 6 peak stress 35.37 < 0.001 0.001 0.973 0.370 0.700 0.262 0.775 1.560 0.240 0.303 0.745
Colorado day 14 recovery 0.047 0.954 2.054 0.190 0.055 0.947 1.296 0.325 4.627 0.064 0.461 0.646
Colorado day 120 peak stress 3.214 0.076 0.431 0.524 0.109 0.898 4.124 0.043 5.291 0.040 0.813 0.466
Colorado day 127 recovery 0.795 0.476 2.107 0.175 0.017 0.983 0.496 0.622 4.416 0.060 0.553 0.591
Maryland day 6 peak stress 0.476 0.631 98.36 < 0.001 1.152 0.344 21.980 < 0.001 0.939 0.349 1.765 0.207
Maryland day 14 recovery 0.024 0.977 46.56 < 0.001 0.192 0.827 2.068 0.159 0.400 0.536 0.814 0.461
Maryland day 120 peak stress 6.872 0.007 47.63 < 0.001 0.979 0.397 80.916 < 0.001 22.038 < 0.001 1.945 0.175
Maryland day 121 recovery 0.622 0.548 89.13 < 0.001 2.043 0.159 0.583 0.568 0.025 0.876 0.470 0.632
of WHC, suggesting that the investigated agricultural soils piration. In general, flooding slightly increased respiration
microbial communities are highly resilient to water stress. rates, but this was only significant during the first stress cy-
cle for 1 to 2 d and was not consistent across rotation treat-
ments. Flooding may increase respiration rates in part due
4.1 Response to water stress to increased connectivity and availability of previously un-
tapped DOC sources to microorganisms (Schimel, 2018 and
All soils had significantly decreased respiration rates in re- therein). Cumulative carbon losses were significantly dif-
sponse to drought during the first stress cycle with the ferent among sites. Surprisingly, despite having the high-
strongest relative decreases at the Colorado site. Compared est SOC contents, soils from South Dakota lost the least
to drought, flooding had a smaller effect on microbial res-
SOIL, 7, 547–561, 2021 https://doi.org/10.5194/soil-7-547-2021J. Schnecker et al.: Microbial activity responses to water stress in agricultural soils 555 Figure 5. Principal components analysis of all response parameters at the fifth peak stress (day 120) and following the fifth stress (day 127) in soils from Colorado and Maryland. Blue symbols are the flooding treatment and orange symbols are the drought treatment. Gray symbols are the control. Open symbols represent simple and filled symbols represent complex rotations. Significant differences between treatments along the axes are shown in Table 2. Included parameters are pH, extractable organic carbon (EOC), total extractable nitrogen (TEN), microbial biomass carbon (MBC), NH4 , NO3 , activities of β-glucosidase (BG), cellobiohydrolase (CBH), N-acetyl-glucosaminidase (NAG), leucine-amino-peptidase (LAP), phenoloxidase (POX) and peroxidase (PEX), respiration (CO2 ), N2 O production (N2 O), and permanganate oxidizable carbon (POXC). carbon as CO2 over the whole incubation period. Differ- fected by the applied stresses. A reason for this might be the ences in cumulative respiration between sites could be re- stabilization of enzymes on soil minerals, which might pro- lated to differences in mineralogy and soil texture (Saidy et tect them against drought and flooding (Allison and Jastrow, al., 2015; Schmidt et al., 2011), microbial community com- 2006; Kramer et al., 2013). This stabilization might also ex- position (Babin et al., 2013), or the chemistry of plant and plain why our findings are in contrast to results from temper- fertilizer inputs (McDaniel and Grandy, 2016). Our data hint ature stress experiments in plant litter (Mooshammer et al., at physical soil properties as potentially relevant factors for 2017). SOC stabilization and susceptibility to water stress as our However, when soil samples were ordinated in response four sites not only represent a precipitation gradient but also a parameter space in a PCA, a clear stress treatment effect gradient in texture, which is reflected to some extent in SOC emerged in Colorado and Maryland soils irrespective of the contents but less so in the observed cumulative carbon loss. rotation treatment (Tables 2, 3, and 4). Maryland but not Aside from CO2 production during drought, no factor in- Colorado soils showed an additional rotation effect: samples vestigated in the two soils from climate extremes (Colorado from simple and complex rotations at this site separated in and Maryland) changed consistently in response to drought the PCA, both during and after drought and flooding events. and flooding (Table 3). Microbial biomass was affected dur- This was most likely related to higher SOC content and co- ing the first flooding cycle and fifth drought cycle in Mary- varying soil properties in the complex crop rotation soils, land soils but not in soils from Colorado. In Colorado, for which we found only in Maryland. The experimental field soils of both rotation lengths, LAP decreased with drought, in Maryland had the most complex crop rotation (four crops) which was not the case in soils from Maryland. All flooded and was the only site where the complex rotation included a Colorado soils produced N2 O, while this was only the case in perennial crop and fertilization with poultry litter, both effec- the complex rotation in Maryland. Beside these site-specific tive methods for increasing soil carbon stocks and soil health effects, we could not find drought or flooding effects that oc- (Ashworth et al., 2018; King and Blesh, 2018). The introduc- curred in either rotation treatment at both sites. Extracellu- tion of cover crops might be more effective than increasing lar enzyme activities in particular remained relatively unaf- cropping diversity alone (McDaniel et al., 2014). https://doi.org/10.5194/soil-7-547-2021 SOIL, 7, 547–561, 2021
556                                          J. Schnecker et al.: Microbial activity responses to water stress in agricultural soils

Table 3. Mean response ratios of soil carbon and nitrogen pools, microbial enzyme activities, and CO2 and N2 O production in response to
drought and flooding during (day 6), immediately after (day 14), 2 weeks (day 27) after, and 6 weeks (day 55) after the first stress cycle.
Orange colors indicate a reduction relative to the control and green colors represent an increase. Only significant differences (p < 0.05) are
shown. Response ratios are calculated as the value for a given treatment divided by the value of the respective control at 50 % WHC. C is a
complex rotation, S is a simple rotation, and POXC is permanganate oxidizable carbon.

   One reason for the apparently mild reaction to drought and            also be the case that the duration of desiccation was too short
flooding in this experiment might be the duration of the stress          to lead to a pronounced CO2 pulse at rewetting (Unger et al.,
we applied. Stress slowly applied over several days and last-            2010).
ing less than 2 weeks in total might be similar to conditions               Like respiration rates, most other measured parameters re-
that microorganisms in the investigated soils experience fre-            turned to control levels following stress; this was also appar-
quently in the field. Stress effects have indeed been found to           ent in the PCA where dried and flooded soils were indistin-
strongly vary with the duration of stress as well as its inten-          guishable from control soils at a constant water content of
sity (Tiemann and Billings, 2011, 2012).                                 50 % WHC. This indicates that while all soils were signif-
                                                                         icantly affected by the stress treatment, they are highly re-
                                                                         silient and recovered quickly from stress. This is in accor-
4.2   Recovery from stress                                               dance with Kaurin et al. (2018) who found that microbial
                                                                         communities in agricultural soils recovered after rewetting
In our experiment, only soils from Maryland showed a stress-
                                                                         even after severe and prolonged drought periods and Barnard
induced increase in respiration during recovery compared to
                                                                         et al. (2013) who found similarly quick recovery of the soil
unstressed control soils; specifically, respiration increased in
                                                                         microbial community after rewetting of dry grassland soils.
soils from the complex Maryland rotation in the first day fol-
lowing stress and in the simple rotation after 3 d. The lack of
a Birch effect in all other soils might be because we rewet-             4.3    Adaptation to stress
ted the soil in small increments over the course of 3 d rather
than a flush rewetting, which often results in a large increase          As during the first stress period, respiration rates declined in
in respiration (Birch, 1958; Göransson et al., 2013). It might           soils from all sites and rotations during the fifth drought cy-

SOIL, 7, 547–561, 2021                                                                         https://doi.org/10.5194/soil-7-547-2021
J. Schnecker et al.: Microbial activity responses to water stress in agricultural soils 557 Table 4. Mean response ratios of soil carbon and nitrogen pools, microbial enzyme activities, and CO2 and N2 O production in response to drought and flooding before (day 113), during (day 120), immediately after (day 127), 2 weeks (day 141) after, and 6 weeks (day 165) after the fifth stress cycle. Orange colors indicate a reduction relative to the control and green colors represent an increase. Only significant differences (p < 0.05) are shown. Response ratios are calculated as the value for a given treatment divided by the value of the respective control at 50 % WHC. C is a complex rotation, S is a simple rotation, and POXC is permanganate oxidizable carbon. cle. In contrast, respiration was unaffected by flooding, with We also found site-specific differences between the first the exception of a slight increase in the Michigan complex and the fifth stress cycles. In soils from Colorado from rotation 5 d after flooding. After the end of the fifth drought both rotation regimes, NAG was significantly reduced in cycle, in contrast to the first cycle, we found clear increases the drought treatment compared to the control. In contrast, in respiration when soils from Maryland, South Dakota, and drought reduced total extractable nitrogen in Maryland soils Michigan returned to 50 % WHC. Both observations might while flooding released N2 O in both Maryland rotations. In be related to the absence of plant inputs in our incubation Colorado soils no N2 O production could be detected by the experiment. Plants have been shown to strongly respond to fifth stress cycle. This might have been caused by a deple- drought (Fuchslueger et al., 2014; Kaisermann et al., 2017), tion of the dissolved substrate for N2 O production or could but will provide some amount of carbon even if rhizodeposi- be related to plant-induced differences in microbial commu- tion is reduced under drought (Canarini and Dijkstra, 2015). nity composition (Hammerl et al., 2019) that had faded after During the vegetation period, such a continuous supply of 160 d of incubation. root exudates might prevent an increase in respiration at the The lack of microbial adaptation to the re-occurring stress end of a stress event when connectivity between microbes in all except the Colorado soils might be interpreted as an and substrate is re-established, such as our observation af- already existing adaptation to conditions mimicked in our ter the fifth but not the first stress. Management practices experiment or could again be ascribed to the modest stress that extend the vegetation period and minimize fallow pe- events of our lab experiment compared to the larger environ- riods might help maintain a constant supply of DOC to soil mental fluctuations these soils experienced in situ. microorganisms and thereby buffer their response to drought and flooding. https://doi.org/10.5194/soil-7-547-2021 SOIL, 7, 547–561, 2021
558                                         J. Schnecker et al.: Microbial activity responses to water stress in agricultural soils

4.4    Summary                                                         This research was funded by the National Institute of Food and
                                                                       Agriculture, U.S. Department of Agriculture, under award number
In this study we found that drought – and, to a lesser ex-             2014-67019-21716.
tent, short-term flooding – significantly affected respiration
rates at all sites and at some sites had additional effects on
some microbial enzyme activities, soil carbon and nitrogen             Financial support. This research has been supported by the Na-
pools, and nitrous oxide emissions. Furthermore, an increase           tional Institute of Food and Agriculture (grant no. 2014-67019-
in crop rotational diversity did not lead to generally differ-         21716).
ent responses of soils to short-term drought and flooding,
even at the one site where increased crop rotation complex-
ity also caused an increase in SOC. While soil function re-            Review statement. This paper was edited by Ember Morrissey
                                                                       and reviewed by Elizabeth Bach and Theresa McHugh.
acted significantly during stress events, all soils recovered
quickly and returned to control levels once the stress ended.
This indicates that soil microbial processes in these agricul-
tural soils collected from variable climate regions within the         References
United States are highly resilient to short-term drought and
flooding. Future experiments should also include plants as             Allison, S. D. and Jastrow, J. D.: Activities of extracellu-
                                                                         lar enzymes in physically isolated fractions of restored
they are an important component of agroecosystems in the
                                                                         grassland soils, Soil Biol. Biochem., 38, 3245–3256,
field and could strongly influence DOC and DON availabil-
                                                                         https://doi.org/10.1016/j.soilbio.2006.04.011, 2006.
ity. Our laboratory study focused on the soil–microbe system           Allison, S. D. and Martiny, J. B. H.: Resistance, resilience, and re-
and showed that, at least in the absence of plants, microbial            dundancy in microbial communities, P. Natl. Acad. Sci. USA,
functions and activities are highly resilient to drought and             105, 11512–11519, https://doi.org/10.1073/pnas.0801925105,
flooding and recover quickly from stress.                                2008.
                                                                       Ashworth, A. J., Allen, F. L., DeBruyn, J. M., Owens, P. R., and
                                                                         Sams, C.: Crop Rotations and Poultry Litter Affect Dynamic
Data availability. The data produced in this study are avail-            Soil Chemical Properties and Soil Biota Long Term, J. Environ.
able     through    Phaidra    (https://doi.org/11353/10.1220845,        Qual., 47, 1327–1338, https://doi.org/10.2134/jeq2017.12.0465,
https://doi.org/11353/10.1220844, Schnecker, 2021a, b). The              2018.
data may also be requested by email from the corresponding author.     Babin, D., Ding, G.-C., Pronk, G. J., Heister, K., Kögel-Knabner,
                                                                         I., and Smalla, K.: Metal oxides, clay minerals and charcoal de-
                                                                         termine the composition of microbial communities in matured
Supplement. The supplement related to this article is available          artificial soils and their response to phenanthrene, FEMS Micro-
online at: https://doi.org/10.5194/soil-7-547-2021-supplement.           biol. Ecol., 86, 3–14, https://doi.org/10.1111/1574-6941.12058,
                                                                         2013.
                                                                       Bailey, V. L., Smith, A. P., Tfaily, M., Fansler, S. J.,
                                                                         and Bond-Lamberty, B.: Differences in soluble organic
Author contributions. JS and ASG conceived the experiment.
                                                                         carbon chemistry in pore waters sampled from different
FC, MC, RML, LKT provided soil samples. JS and DBM processed
                                                                         pore size domains, Soil Biol. Biochem., 107, 133–143,
and analyzed the soil samples. JS analyzed and interpreted the data
                                                                         https://doi.org/10.1016/j.soilbio.2016.11.025, 2017.
and wrote the manuscript. All authors contributed to the data inter-
                                                                       Barnard, R. L., Osborne, C. A., and Firestone, M. K.: Re-
pretation and provided essential comments to the manuscript.
                                                                         sponses of soil bacterial and fungal communities to ex-
                                                                         treme desiccation and rewetting, ISME J., 7, 2229–2241,
                                                                         https://doi.org/10.1038/ismej.2013.104, 2013.
Competing interests. The authors declare that they have no con-        Berglund, Ö. and Berglund, K.: Influence of water table
flict of interest.                                                       level and soil properties on emissions of greenhouse gases
                                                                         from cultivated peat soil, Soil Biol. Biochem., 43, 923–931,
                                                                         https://doi.org/10.1016/j.soilbio.2011.01.002, 2011.
Disclaimer. Publisher’s note: Copernicus Publications remains          Birch, H. F.: The effect of soil drying on humus decom-
neutral with regard to jurisdictional claims in published maps and       position and nitrogen availability, Plant Soil, 10, 9–31,
institutional affiliations.                                              https://doi.org/10.1007/BF01343734, 1958.
                                                                       Bowles, T. M., Atallah, S. S., Campbell, E. E., Gaudin, A. C. M.,
                                                                         Wieder, W. R., and Grandy, A. S.: Addressing agricultural ni-
Acknowledgements. This research used samples and data from               trogen losses in a changing climate, Nat. Sustain., 1, 399–408,
the Long-Term Agroecosystem Research (LTAR) network, which               https://doi.org/10.1038/s41893-018-0106-0, 2018.
is supported by the United States Department of Agriculture. The       Bowles, T. M., Mooshammer, M., Socolar, Y., Calderón, F., Cav-
Michigan and Maryland soils used in the study are from LTAR              igelli, M. A., Culman, S. W., Deen, W., Drury, C. F., Garcia
sites. Long-term crop rotation treatments at the South Dakota site       y Garcia, A., Gaudin, A. C. M., Harkcom, W. S., Lehman, R.
are managed and maintained by Shannon Osborne, USDA-ARS.                 M., Osborne, S. L., Robertson, G. P., Salerno, J., Schmer, M. R.,

SOIL, 7, 547–561, 2021                                                                       https://doi.org/10.5194/soil-7-547-2021
J. Schnecker et al.: Microbial activity responses to water stress in agricultural soils 559 Strock, J., and Grandy, A. S.: Long-Term Evidence Shows that soils: Impact of drought-legacy, Soil Biol. Biochem., 57, 477– Crop-Rotation Diversification Increases Agricultural Resilience 486, https://doi.org/10.1016/j.soilbio.2012.08.031, 2013. to Adverse Growing Conditions in North America, One Earth, 2, Grandy, A. S. and Robertson, G. P.: Land-use intensity ef- 284–293, https://doi.org/10.1016/j.oneear.2020.02.007, 2020. fects on soil organic carbon accumulation rates and mecha- Brookes, P. C., Landman, A., Pruden, G., and Jenkinson, D. nisms, Ecosystems, 10, 58–73, https://doi.org/10.1007/s10021- S.: Chloroform fumigation and the release of soil nitro- 006-9010-y, 2007. gen: A rapid direct extraction method to measure microbial Griffiths, B. S. and Philippot, L.: Insights into the resistance and re- biomass nitrogen in soil, Soil Biol. Biochem., 17, 837–842, silience of the soil microbial community, FEMS Microbiol. Rev., https://doi.org/10.1016/0038-0717(85)90144-0, 1985. 37, 112–129, https://doi.org/10.1111/j.1574-6976.2012.00343.x, Calderón, F. J. and Jackson, L. E.: Rototillage, Disking, 2013. and Subsequent Irrigation, J. Environ. Qual., 31, 752–758, Hammerl, V., Kastl, E. M., Schloter, M., Kublik, S., Schmidt, https://doi.org/10.2134/jeq2002.7520, 2002. H., Welzl, G., Jentsch, A., Beierkuhnlein, C., and Gschwendt- Canarini, A. and Dijkstra, F. A.: Dry-rewetting cycles reg- ner, S.: Influence of rewetting on microbial communities in- ulate wheat carbon rhizodeposition, stabilization and volved in nitrification and denitrification in a grassland soil nitrogen cycling, Soil Biol. Biochem., 81, 195–203, after a prolonged drought period, Sci. Rep.-UK, 9, 1–10, https://doi.org/10.1016/j.soilbio.2014.11.014, 2015. https://doi.org/10.1038/s41598-018-38147-5, 2019. Cavigelli, M. A., Teasdale, J. R., and Conklin, A. E.: Long-Term Herron, P. M., Stark, J. M., Holt, C., Hooker, T., and Car- Agronomic Performance of Organic and Conventional Field don, Z. G.: Microbial growth efficiencies across a soil Crops in the Mid-Atlantic Region, Agron. J., 100, 785–794, moisture gradient assessed using 13 C-acetic acid vapor and https://doi.org/10.2134/agronj2006.0373, 2008. 15N-ammonia gas, Soil Biol. Biochem., 41, 1262–1269, Culman, S. W., Snapp, S. S., Freeman, M. A., Schipanski, M. https://doi.org/10.1016/j.soilbio.2009.03.010, 2009. E., Beniston, J., Lal, R., Drinkwater, L. E., Franzluebbers, A. Hood-Nowotny, R., Umana, N. H.-N., Inselbacher, E., Oswald- J., Glover, J. D., Grandy, A. S., Lee, J., Six, J., Maul, J. E., Lachouani, P., and Wanek, W.: Alternative Methods for Mirksy, S. B., Spargo, J. T., and Wander, M. M.: Permanganate Measuring Inorganic, Organic, and Total Dissolved Ni- Oxidizable Carbon Reflects a Processed Soil Fraction that is trogen in Soil, Soil Sci. Soc. Am. J., 74, 1018–1027, Sensitive to Management, Soil Sci. Soc. Am. J., 76, 494–504, https://doi.org/10.2136/sssaj2009.0389, 2010. https://doi.org/10.2136/sssaj2011.0286, 2012. Jackson, L. E., Calderon, F. J., Steenwerth, K. L., Scow, K. M., and Davidson, E. A.: Sources of Nitric Oxide and Nitrous Oxide Rolston, D. E.: Responses of soil microbial processes and com- following Wetting of Dry Soil, Soil Sci. Soc. Am. J., 56, 95–102, munity structure to tillage events and implications for soil qual- https://doi.org/10.2136/sssaj1992.03615995005600010015x, ity, Geoderma, 114, 305–317, https://doi.org/10.1016/S0016- 1992. 7061(03)00046-6, 2003. DeAngelis, K. M., Silver, W. L., Thompson, A. W., and Firestone, Kaisermann, A., de Vries, F. T., Griffiths, R. I., and Bard- M. K.: Microbial communities acclimate to recurring changes in gett, R. D.: Legacy effects of drought on plant-soil feedbacks soil redox potential status, Environ. Microbiol., 12, 3137–3149, and plant-plant interactions, New Phytol., 215, 1413–1424, https://doi.org/10.1111/j.1462-2920.2010.02286.x, 2010. https://doi.org/10.1111/nph.14661, 2017. Ding, G., Liu, X., Herbert, S., Novak, J., Amarasiriwar- Kaurin, A., Mihelič, R., Kastelec, D., Grčman, H., Bru, D., Philip- dena, D., and Xing, B.: Effect of cover crop manage- pot, L., and Suhadolc, M.: Resilience of bacteria, archaea, fungi ment on soil organic matter, Geoderma, 130, 229–239, and N-cycling microbial guilds under plough and conservation https://doi.org/10.1016/j.geoderma.2005.01.019, 2006. tillage, to agricultural drought, Soil Biol. Biochem., 120, 233– Evans, S. E. and Wallenstein, M. D.: Soil microbial commu- 245, https://doi.org/10.1016/j.soilbio.2018.02.007, 2018. nity response to drying and rewetting stress: Does historical Killham, K. and Firestone, M. K.: Salt Stress Control precipitation regime matter?, Biogeochemistry, 109, 101–116, of Intracellular Solutes in Streptomycetes Indigenous https://doi.org/10.1007/s10533-011-9638-3, 2012. to Saline Soils, Appl. Environ. Microb., 47, 301–306, Fierer, N. and Schimel, J. P.: Effects of drying-rewetting frequency https://doi.org/10.1128/aem.47.2.301-306.1984, 1984. on soil carbon and nitrogen transformations, Soil Biol. Biochem., King, A. E. and Blesh, J.: Crop rotations for increased soil carbon: 34, 777–787, https://doi.org/10.1016/S0038-0717(02)00007-X, perenniality as a guiding principle, Ecol. Appl., 28, 249–261, 2002. https://doi.org/10.1002/eap.1648, 2018. Fuchslueger, L., Bahn, M., Fritz, K., Hasibeder, R., and Richter, Kramer, S., Marhan, S., Haslwimmer, H., Ruess, L., and A.: Experimental drought reduces the transfer of recently fixed Kandeler, E.: Temporal variation in surface and subsoil plant carbon to soil microbes and alters the bacterial community abundance and function of the soil microbial commu- composition in a mountain meadow, New Phytol., 201, 916–927, nity in an arable soil, Soil Biol. Biochem., 61, 76–85, https://doi.org/10.1111/nph.12569, 2014. https://doi.org/10.1016/j.soilbio.2013.02.006, 2013. Girvan, M. S., Campbell, C. D., Killham, K., Prosser, J. I., and Lehman, R. M., Osborne, S. L., and Duke, S. E.: Diversified No-Till Glover, L. A.: Bacterial diversity promotes community stability Crop Rotation Reduces Nitrous Oxide Emissions, Increases Soy- and functional resilience after perturbation, Environ. Microbiol., bean Yields, and Promotes Soil Carbon Accrual, Soil Sci. Soc. 7, 301–313, https://doi.org/10.1111/j.1462-2920.2005.00695.x, Am. J., 81, 76–83, https://doi.org/10.2136/sssaj2016.01.0021, 2005. 2017. Göransson, H., Godbold, D. L., Jones, D. L., and Rousk, J.: Bacte- Li, X., Miller, A. E., Meixner, T., Schimel, J. P., Melack, rial growth and respiration responses upon rewetting dry forest J. M., and Sickman, J. O.: Adding an empirical fac- https://doi.org/10.5194/soil-7-547-2021 SOIL, 7, 547–561, 2021
You can also read


