A decadal perspective on north water microbial eukaryotes as Arctic Ocean sentinels
←
→
Page content transcription
If your browser does not render page correctly, please read the page content below
www.nature.com/scientificreports
OPEN A decadal perspective on north
water microbial eukaryotes
as Arctic Ocean sentinels
Nastasia J. Freyria1,2*, Nathalie Joli1,3 & Connie Lovejoy1,2*
The North Water region, between Greenland and Ellesmere Island, with high populations of marine
birds and mammals, is an Arctic icon. Due to climate related changes, seasonal patterns in water
column primary production are changing but the implications for the planktonic microbial eukaryote
communities that support the ecosystem are unknown. Here we report microbial community
phenology in samples collected over 12 years (2005–2018) from July to October and analysed using
high throughput 18S rRNA V4 amplicon sequencing. Community composition was tied to seasonality
with summer communities more variable than distinct October communities. In summer, sentinel pan-
Arctic species, including a diatom in the Chaetoceros socialis-gelidus complex and the picochlorophyte
Micromonas polaris dominated phytoplankton and were summer specialists. In autumn, uncultured
undescribed open water dinoflagellates were favored, and their ubiquity suggests they are
sentinels of arctic autumn conditions. Despite the input of nutrients into surface waters, autumn
chlorophyll concentrations remained low, refuting projected scenarios that longer ice-free seasons
are synonymous with high autumn production and a diatom dominated bloom. Overall, the summer
sentinel microbial taxa are persisting, and a subset oceanic dinoflagellate should be monitored for
possible ecosystem shifts as later autumn ice formation becomes prevalent elsewhere.
Single-celled microbial eukaryotes include a number of pan-Arctic species that are confined to the Arctic, and
whose cultured representatives do not tolerate temperatures typical of warmer o ceans1,2. These sentinel species,
which include diatoms, and small flagellates would be predicted to be sensitive to changing Arctic conditions.
The diverse Arctic marine microbial communities support higher trophic level across the A rctic3, including
the North Water region (Pikialasorsuaq) in Northern Baffin Bay between Ellesmere Island and Greenland. The
region is exceptionally productive with an initial precocious phytoplankton bloom followed by ongoing produc-
tion due to local geography. At the top of the North Water, a narrow strait favors the formation of an ice bridge
and high winds that prevent ice accumulation to the south, creating a recurring polynya. The presence of only
thin ice means that light is available for photosynthesis sooner than elsewhere in the Arctic. Once the ice bridge
breaches, productivity is sustained over the summer because of the north flowing current along the Greenland
coast that brings nutrient rich Atlantic Water onto the shelf. The nitrate rich Atlantic Water is deflected anti-
clockwise and eventually moves southward following the Baffin C urrent4,5. These nitrate rich waters merge with
silica rich Pacific origin water from Nares Strait and Canadian Arctic Archipelago, and the supply of nutrients to
the euphotic zone maintains the prolonged phytoplankton productivity in the North W ater6. The resulting high
nutrient, high mixing r egime7 can favor diatoms that are a valuable food resource for the Calanus8 zooplankton,
which supports the large marine mammal and bird populations. In years when the ice bridge fails to form or
breaks out early, thicker ice accumulates along the coasts of Ellesmere and Baffin islands, with effects on local
regional productivity, highlighting the East–West differences in the North W ater9,10.
Surface waters in the North Water are generally ice-free from late April to late October, although this may
vary10. From the 1990s when the satellite record began, surface chlorophyll tended to be detected first on the
Eastern side of the North Water, but in recent years both early open water and early chlorophyll have been
detected further north and even into the Kane B asin10. However, the picture is incomplete since remote sensing
fails to detect chlorophyll below the surface and maximum biomass is frequently found in a subsurface chloro-
phyll maximum (SCM). SCMs in the Arctic Ocean typically form in stratified water columns where nutrients are
ycnocline11. SCMs are reported to occur
depleted in the surface but light is available at or below a nutrient rich p
1
Institut de Biologie Intégrative et des Systèmes, Université Laval, Quebec, QC, Canada. 2Département de
Biologie, Institut de Biologie Intégrative et des Systèmes, Université Laval, Quebec, QC G1R1V6, Canada. 3Institut
de Biologie de L’École Normale Supérieure (IBENS), 75005 Paris, France. *email: nastasia.freyria.1@ulaval.ca;
Connie.Lovejoy@bio.ulaval.ca
Scientific Reports | (2021) 11:8413 | https://doi.org/10.1038/s41598-021-87906-4 1
Vol.:(0123456789)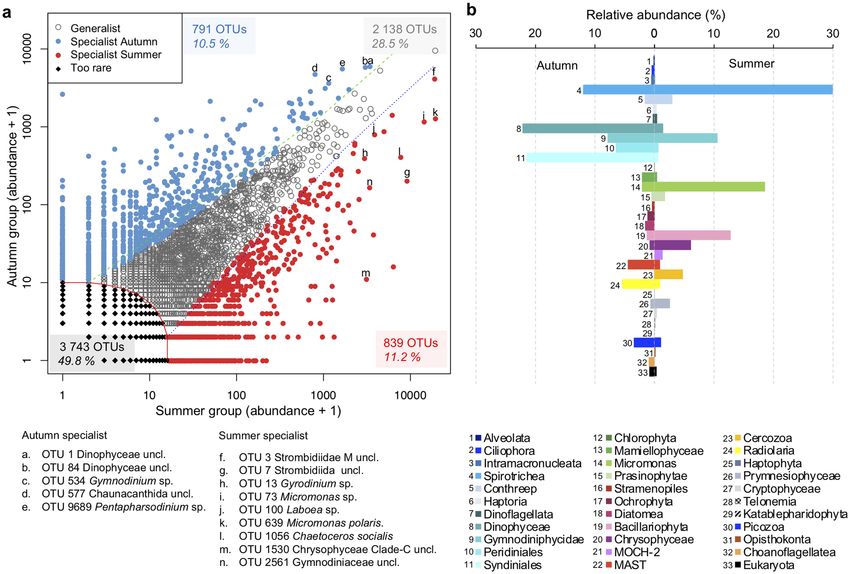
www.nature.com/scientificreports/
on both sides of the North W ater11,12. The SCM on the western side forms below fresher Arctic upper waters atop
Pacific influenced water that persists in the Canadian Archipelago and Nares S trait13. The SCM on the eastern
side sits above Atlantic Water flowing north carried by the West Greenland Current.
The impact of climate driven oceanographic processes on primary production patterns and species com-
position is not well understood5 but surmised to be important14. At least one model based on remote sensing
data suggest longer open water could lead to wind driven mixing, nutrient entrainment and a second autumn
phytoplankton bloom15,16. Such a scenario would replace current models based on a single bloom followed by
surface nutrient drawdown and low chlorophyll production by resident summer Arctic sentinel species for the
rest of the ice-free season. However, the species composition and magnitude of any autumnal bloom is poorly
understood due to limited sampling later in the season.
The seasonal and spatial variability in light and nutrients has an impact on marine microbial eukaryotes,
including phytoplankton species a ssemblages17. The recent increases in multiyear sea-ice melt and glacial melt
also affects the stratification, and potentially the micronutrient budget within the North Water region, with
consequences for species selection. Joli et al.12 suggested micronutrients such as iron from glaciers and the
Greenland Ice Sheet, would have favored Pseudo-nitzschia, which dominated the phytoplankton community at
20 m depth in 2013. Any such phytoplankton species change could have ecological implications for the entire
food web18,19. Despite the importance of the North Water, in common with most Arctic Seas, there have been
few studies focusing on species variability over time and space. In an effort to disentangle season versus inter-
annual and spatial differences, we investigated the variability of marine microbial eukaryotes from two sides of
the North Water region. Samples and oceanographic data were collected from the surface and the SCM over the
time period of 2005–2018 from July to October. Communities of microbial eukaryotes were identified by way
of amplicons targeting the V4 region of 18S rRNA (rRNA) and the 18S rRNA gene (rDNA). We then applied
multivariate and comparative statistics to link differences among communities with environmental drivers, to
provide a high-level overview on how microbial eukaryotic communities respond to seasonal changes in the
context of multi-annual variability. We explored and monitored biodiversity of Arctic phytoplankton community
in a decadal perspective to determine specialist taxa and potential for loss of sentinel taxa in a changing Arctic.
Results
Environmental conditions in the North Water. All samples were collected from open waters and after
the ice bridge breached as defined by Dumont et al.20 (Fig. 1). The date between the opening of the polynya, ice
bridge collapse and sample collection varied, providing a range of environmental conditions over time (Fig. 2;
Supplementary Table S1). The average depths of the SCM and depths of greatest change in chlorophyll fluores-
cence (Chl a) were similar for both sides of the North Water (Supplementary Table S2). The SCM ranged from 25
to 50 m on the Canadian side (West) and 24 to 80 m on the Greenland side (East), with maximum SCM depths in
autumn. The depth of the surface mixed layer from the Brunt-Väisälä frequency, ranged from 12 to 25 m (West)
and 7 to 30 m (East), with actual values > 1.0 × 10⁻³; except on the Greenland side in August 2016 and all October
dates (2009, 2010, 2011 and 2015). A nitracline occurred above 100 m for all sampling dates.
Temperature and day-length differed by month of collection and the communities separated by season (Fig. 3).
Other environmental variables: salinity, Chl a and nutrient concentrations (Supplementary Tables S3 and S4)
differed between July–August, September and October. Additional differences were evident depending on depth
category and by side defined as East (Greenland) or West (Canadian). The Welch two-sample t-test (Supplemen-
tary Table S5) indicated significantly lower surface salinity (p < 0.01), as well as nitrate (p < 0.05) and phosphate
(p < 0.01) concentrations compared to the SCM within the two sides. Silicate concentrations were greater at
the SCM compared to the surface on both sides but was significant (p < 0.01) only on the Canadian side. Water
temperature was significantly greater (p < 0.05) between depths on the Greenland side (Supplementary Table S5).
Taking the two depths combined, we found no significant difference between sides for temperature, Chl a, nitrate,
silicate or dissolved oxygen. However, salinity was significantly lower on the Canadian versus Greenland side
(p < 0.001) and phosphate concentrations were significantly greater (p < 0.05) on the Canadian side.
Seasonal differences in the physical conditions. The greatest differences in the physical environ-
ment occurred between summer (July–August) and later autumn (October) at the onset of ice formation. A
Spearman’s rank correlation (ρ) matrix indicated statistically significant co-correlations associated with season
(Supplementary Fig. S1). Day-length was positively correlated with temperature but negatively correlated with
regional sea-ice and nutrient concentrations. The highest temperature was in 2016 in the summer surface waters
on the Greenland side (Supplementary Table S3). The highest values for Chl a in surface waters were in July 2014
(2.03 µg Chl a L−1) and in October 2015 (1.01 µg Chl a L−1) on the Greenland side. The lowest value was in Octo-
ber 2010 (0.07 µg Chl a L−1) on both sides. SCM Chl a values were greatest in August 2013 (4.14 µg Chl a L−1) and
the minimum value was the October 2010 (0.07 µg Chl a L−1), both on the Greenland side. Chl a was generally
higher on the Greenland side during summer at the SCM, especially in 2013 and 2014.
Strong seasonality of microbial eukaryotes. After the removal of metazoa, bacteria and fungi reads,
a total of 500,456 rDNA and 432,213 rRNA reads were retained and clustered into a total of 8,753 OTUs (at
98% similarity) with 7,033 OTUs from rDNA and 7,330 OTUs from rRNA. We failed to detect any trend in
communities associated with year of collection (Supplementary Fig. S2). On a community level, distance-based
redundancy analysis (db-RDA) placed the majority of October samples together, these were separated from
July–August and September samples along the first axis associated with day-length and nutrients. The communi-
ties were tested against environmental parameters, and the primary axis (Fig. 3; Supplementary Fig. S3) showed
that October communities were associated with the seasonally higher nitrate concentrations (ANOVA: R2 = 0.01,
Scientific Reports | (2021) 11:8413 | https://doi.org/10.1038/s41598-021-87906-4 2
Vol:.(1234567890)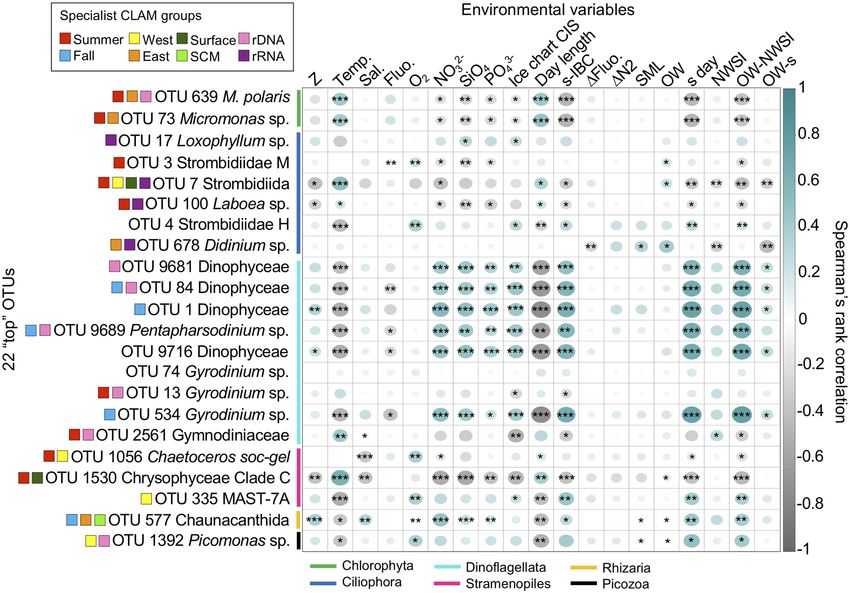
www.nature.com/scientificreports/
Figure 1. Map of the sampling region. Circulation within the North Water region from Melling et al.62. Light
blue arrows show colder and less salty surface water and red arrows display warmer and saltier surface water.
Samples are from the Greenland side (Stn115) and the Canadian side (Stn101 and Stn105). West Greenland
current (WG). The map was generated using Ocean Data View (v.4.7.8, http://odv.awi.de).
F = 1.84, p < 0.05). Summer communities were associated with warmer temperatures (ANOVA: R2 = 0.05, F = 5.7,
p < 0.001) and longer day-length (ANOVA: R2 = 0.03, F = 3.16, p < 0.01). The summer samples were more dis-
persed along the second axis, associated with temperature and salinity. The second axis of both the db-RDA and
constrained correspondence analysis (CCA) plots highlighted oxygen and salinity as further potential environ-
mental filters, with some clustering suggesting separation of West–East communities along with depth category.
The Canadian and Greenland sides were examined separately, using PerMANOVA to test for the significance
of environmental variables correlated with the combined communities (Supplementary Table S6). The test indi-
cated that on the Canadian side, temperature and salinity were the main drivers of community differences.
Temperature was also significant for the Greenland communities but not salinity. However, differences in silicate
concentrations between depths were significant on the Greenland side (Supplementary Table S7).
The Non-Metric multiDimensional Scaling (NMDS) plot based only on communities, separated the samples
by season but added more weight to three 2018 samples (Supplementary Fig. S4). The generally greater disper-
sion of the summer samples was evident in seasonal Venn diagrams of OTUs from the two sides (Fig. 4b). There
were more side specific OTUs in July–August (West: ca. 25%; East: 20%) compared to the October samples with
less than 15% for either side. Examining all samples combined, we found ca. 16% of OTUs were unique to one
side or the other, with ca. 68% shared.
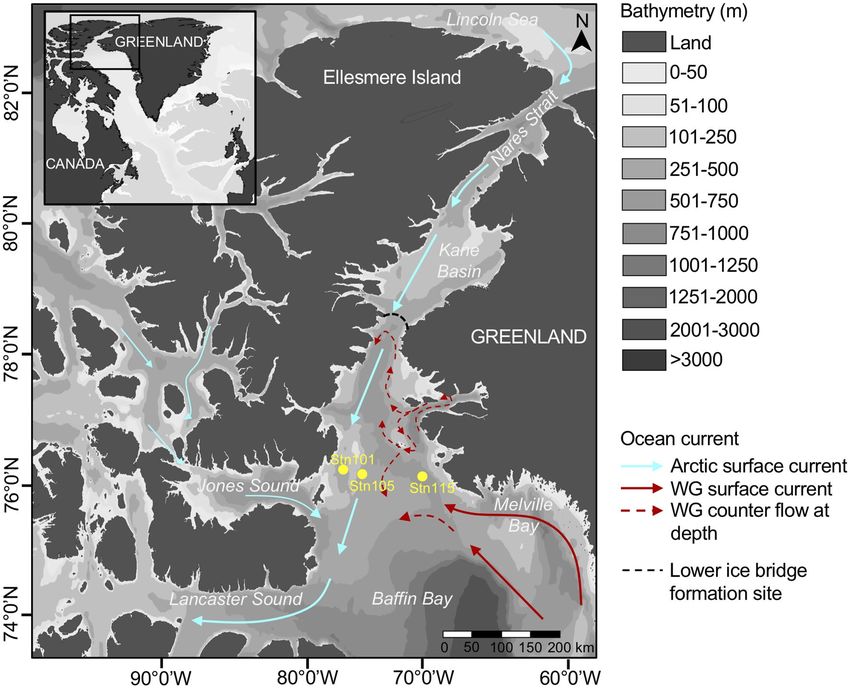
Since season was the major factor separating samples, we carried out a pairwise CLAM (see methods) test
of July–August (summer OTUs) and October (autumn OTUs) to identify seasonal specialists (Fig. 5a). The test
indicated that 11.2% of the OTUs could be considered summer specialists and 10.5% as autumn specialists.
Ciliates, mostly in the Spirotrichea and half of one category of dinoflagellate (Gymnodiniales) OTUs were sum-
mer specialists. Other summer specialists were Micromonas spp. and diatoms (Bacillariophyceae), with each
accounting for > 10% of all summer specialists. In autumn, the highest proportions of specialist OTUs were
predominantly dinoflagellates with ca. one quarter of the Gymnodiniales and higher proportions of unclassified
Dinophyceae, Peridiniales and Syndinales (Fig. 5b).
We further compared all OTUs to determine if there were specialists associated with either side of the North
Water (Supplementary Fig. S5). In this analysis, 41% were generalists and 5.6% were specialist of one side or the
other. Similarly, there were only a small percentage of OTUs that were classified as either surface (4%) or SCM
Scientific Reports | (2021) 11:8413 | https://doi.org/10.1038/s41598-021-87906-4 3
Vol.:(0123456789)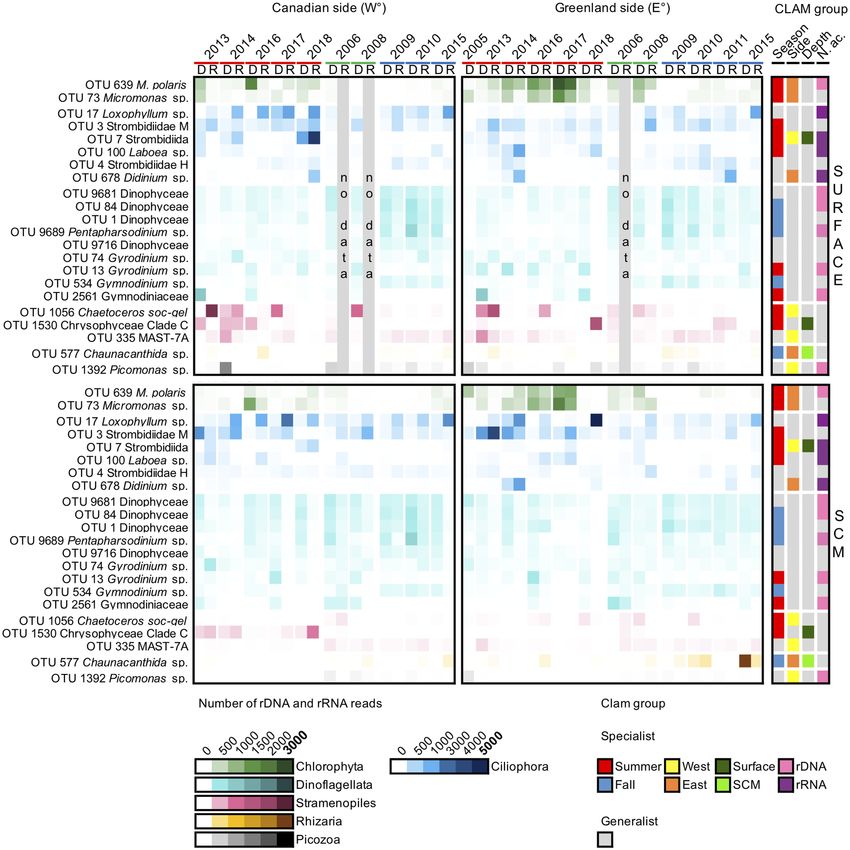
www.nature.com/scientificreports/
Figure 2. Key events by day of year (Julian date). Upper panel shows dates of selected conditions from 2005 to
2018: the first day of open water forming the polynya (yellow circles) in the North Water; date of the Nares Strait
ice bridge collapsing (blue crosses); sampling dates (black squares for Canadian side sampling, grey triangles
for the Greenland side) and the date of new winter sea-ice (orange circles) that corresponds to the date when
sea-ice covers Nares Strait to the north, and an indication of onset of winter ice conditions (see Supplementary
Table S1). The panel below indicates the day-length based on latitude 76.36°N and longitude − 74.01°W over the
same time frame.
specialists (4.2%); (Supplementary Fig. S6). All CLAM tests (season, side and depth comparisons) indicated that
nearly 50% of OTUs were too rare to be considered as either specialist or generalist. As a check on the viability
bias among the OTUs, we also compared taxa that were more represented in the rRNA libraries compared to
rDNA. The CLAM test classified ca. 13% of OTUs as specialists of rRNA and 6.5% specialists of rDNA (Sup-
plementary Fig. S7). Such bias suggests different life cycle stages for the taxa, with the rRNA specialists in more
active growth stages compared to rDNA specialists, but this conjecture remains to be tested.
Finer taxonomy of top OTUs. To gain insight into the ecology of the region’s dominant taxa, we identi-
fied “top” OTUs that accounted for at least 0.5% of all reads in the study. Overall, only 22 OTUs met the criteria
(Figs. 6 and 7). Dinophyceae accounted for nine of the top OTUs. Four of these nine were assigned to Gymno-
diniales, including OTU-74 classified as Gyrodinium spirale (PR2 database), but was distant when placed in the
RAxML tree using pplacer (Supplementary Fig. S8). In addition, pplacer assigned two of the OTUs (OTU-13
and -2561) to the Gyrodinium rubrum–helveticum clade. One unclassified OTU-1 aligned within Kareniaceae
and the other three unclassified dinoflagellate OTUs (OTU-84, -9681 and -9716) grouped separately with other
uncultivated sequences from offshore marine waters, including from the Arctic and sequences from 2500 m
in the East Pacific Rise (KC488435 and KJ757193 respectively). The “Gymnodinium” (OTU-534) was within a
clade that also included radiolarian symbionts and the kleptoplastidic Lepidinium virde that maintains green
algal chloroplasts. The final dinoflagellate (OTU-9689) was assigned to the Thoracospaeracea, in the genus Pen-
tapharsodinium (by P R2) but was put into a clade of Scrippsiella sequences using pplacer. Given their ubiquity
and placement in the 18S rRNA gene tree, the four autumn specialists (OTU-1, -84, -534 and -9689) fit with the
notion of being arctic indicators or sentinels. Two dinoflagellates were summer specialists (OTU-13 and -2561).
The three others were considered generalists and none of these top dinoflagellate OTUs were classified as special-
ist of a particular depth or side of the North Water (Figs. 6 and 7).
Ciliate OTUs accounted for six of the top OTUs. Four were Strombidiida, with three assigned to environmen-
tal Strombidiidae categories (OTU-3, -4 and -7) and one to the genus Laboea in the Tontoniida (OTU-100). The
other two were Lithostomatea and included Didinium (OTU-678) and Loxophylum (OTU-17). Three of these
were summer specialists (OTU-3, -7 and -100) and the other three seasonal generalists. Four were classed as
rRNA specialists. The Strombidiida OTU-7 appeared as highly specialized to the surface summer on the Canadian
side (Figs. 5a and 6; Supplementary Figs. S5 and S6).
The diatom Chaetoceros (OTU-1056) was among the top OTUs and assigned to C. socialis by PR2 but had
a nearest BLAST (Supplementary Table S8) match to C. gelidus (strain RCC2271) from the Beaufort Sea. One
chrysophyte (OTU-1530) could not be identified to a genus but was within Chrysophyceae clade C, which
Scientific Reports | (2021) 11:8413 | https://doi.org/10.1038/s41598-021-87906-4 4
Vol:.(1234567890)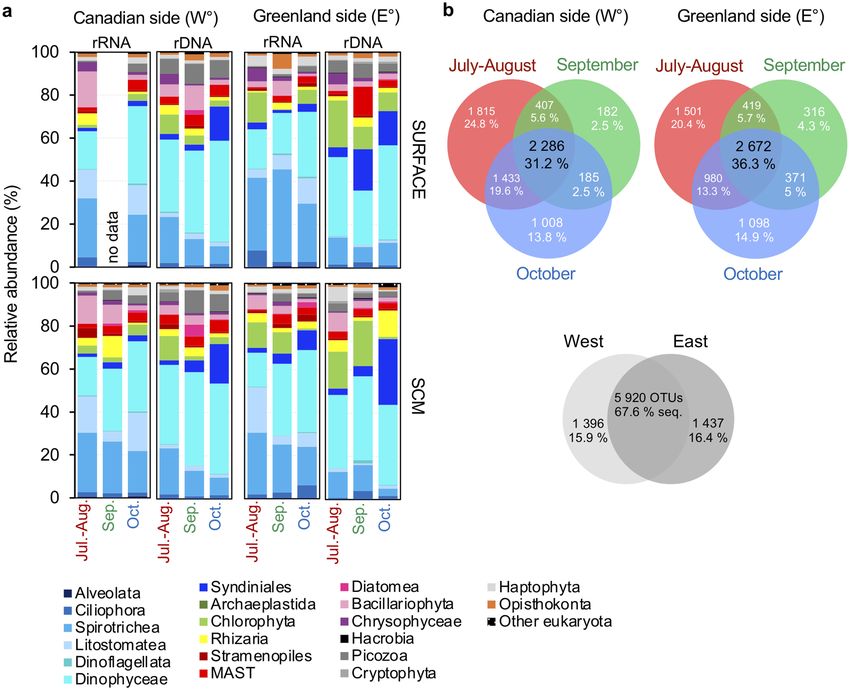
www.nature.com/scientificreports/
Figure 3. Microbial eukaryotic community clustering using distance-based Redundancy Analysis (db-RDA)
with the Bray–Curtis dissimilarity measure. Arrows indicate correlation between environmental parameters and
communities assembled from rRNA (open symbols) and rDNA (symbols with interior dots), for the two sides of
the North Water: Canada on the Western (W°) and Greenland on the eastern side (E°). Colors indicate month of
sampling. Significant factors were water temperature (Temp.), salinity (Sal.), relative Chl a fluorescence (Fluo.),
nitrate (NO3), silicate ( SiO4) and phosphate (PO4) concentration, dissolved oxygen (O2), depth of surface mixed
layer (SML; Supplementary Table S2), day-length and day of the year for the onset of new winter sea-ice (NWSI)
in North Water region (from Fig. 2).
includes most Ochromonas spp. and Dinobryon. These two OTUs were considered as summer specialists, with
Chaetoceros a Canadian side specialist and the chrysophyte a surface specialist (Fig. 6).
Two other top OTUs belonging to photosynthetic taxa were both Micromonas, with M. polaris (OTU-639)
accounting for the highest proportion of total reads ca. 2.5% and a second Micromonas (OTU-73), which was
related to the clade B subarctic (by PR2). Other Micromonas OTUs were recovered in much smaller percentages
(Supplementary Fig. S9). The CLAM test classified both top Micromonas OTUs as summer and Greenland side
specialists with OTU-639 as a rDNA specialist (Fig. 6).
The remaining three top OTUs were heterotrophic taxa. OTU-335 was classified as a heterokont in the MAST-
7A clade and OTU-577 was in the Acantharia (Rhizaria) in the order Chaunacanthida, with closest matches to
other environmental sequences and 98.6% similar to Heteracon sp. Ant-21 (Supplementary Table S8). OTU-1392
was classified as a Picozoa. The CLAM test classified MAST-7A and Picomonas sp. as Canadian side specialists
and Chaunacanthida as an autumn SCM Greenland side specialist (Fig. 6; Supplementary Fig. S5).
Environmental and taxon correlation. A Spearman’s rank correlation (ρ) matrix comparing top OTUs
with environmental factors (Fig. 7) and each other (Supplementary Fig. S10) indicated the positive correlation
between day-length and temperature for the two Micromonas spp. and the chrysophyte. Six dinoflagellate top
OTUs (OTU-1, -84, -534, -9681, -9689 and -9716) were negatively correlated with temperature and positively
correlated with nutrient concentrations. These six were co-correlated with each other (Supplementary Fig. S10)
Scientific Reports | (2021) 11:8413 | https://doi.org/10.1038/s41598-021-87906-4 5
Vol.:(0123456789)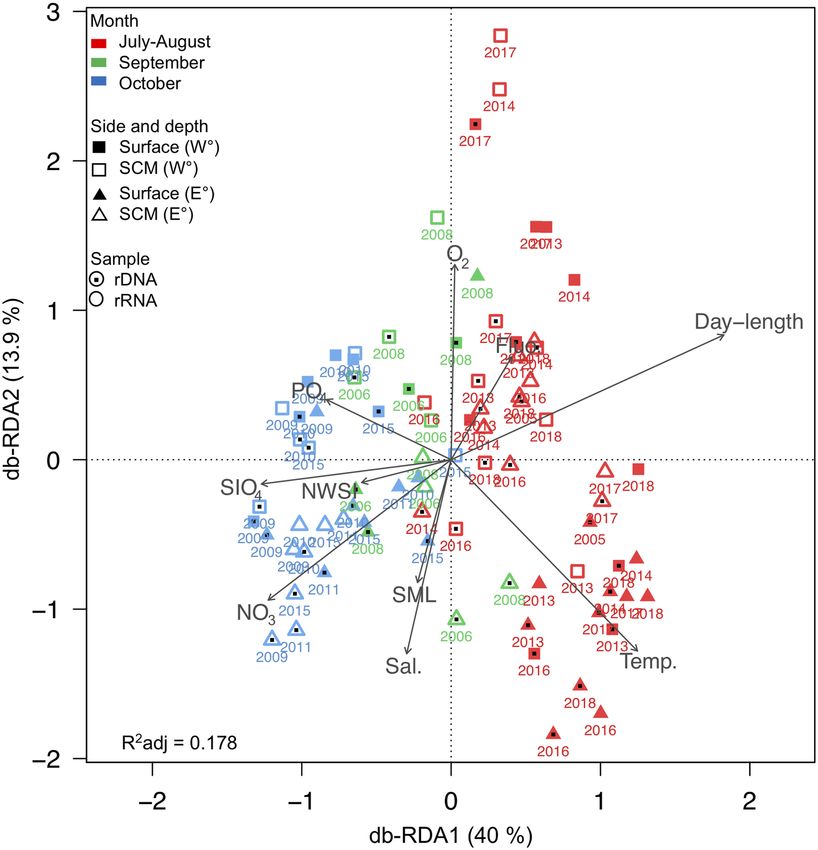
www.nature.com/scientificreports/
Figure 4. Seasonal and sides comparison of community composition. (a) Eukaryotic phytoplankton 18S
rRNA gene OTUs community composition. Relative abundance by month of sampling (see dates of sampling
in Supplementary Table S1) of both depths and sides. (b) Venn diagrams showing the number of unique and
shared OTUs detected by 18S rRNA sequencing comparing the three-time frames (July–August, September
and October) of the two sides of the North Water from 2005 to 2018. Lower Venn diagram shows overlap
of communities between the two sides for all years, with the corresponding percentage of the total OTUs in
combined rRNA and rDNA surveys.
and with the occurrence of Picomonas and MAST-7A. For the most part, the top ciliate OTUs were negatively
correlated with the six co-correlated dinoflagellates.
Overall, this multiyear study highlighted the strong seasonality in the microbial eukaryotic communities
with a distinct October community and more diverse and varied summer communities. Water temperature was
a major variable influencing the microbial eukaryotic community. The surface temperatures in October on both
sides were close to the freezing point of seawater (− 1.78 °C; Supplementary Table S3) and appeared to favor
dinoflagellates (Figs. 4a and 5b). Temperature co-varied with other seasonal indicators, such as day-length and
time since the initial opening of the polynya (open water) in a particular year, as well as nutrient concentrations
(Supplementary Fig. S3). Higher nutrients in surface samples were associated with lower temperatures in Octo-
ber suggesting deeper waters entrained into the surface due to weaker stratification (Supplementary Table S2).
Discussion
In total, the autumn dinoflagellates accounted for around 75% of reads in our study, compared to ~ 50% of
summer reads (Fig. 4a). None of the top autumn OTUs were diatoms, consistent with diatoms being limited
by low autumn light availability and non-diatoms dominating under lower light c onditions21. Autumn Chl a
concentrations remained low in the surface and SCM, suggesting that the dinoflagellates were not overly reli-
ant on photosynthesis. About half of all described dinoflagellates are heterotrophic with the vast majority of
photosynthetic dinoflagellates able to capture prey22, with mixotrophy reported in Arctic dinoflagellates23. In
accordance with this autumn community being on the mixotrophic–heterotrophic continuum, the three other
autumn top OTUs belonged to heterotrophic groups (MAST-7A, Chaunacanthida and Picomonas). These were
Scientific Reports | (2021) 11:8413 | https://doi.org/10.1038/s41598-021-87906-4 6
Vol:.(1234567890)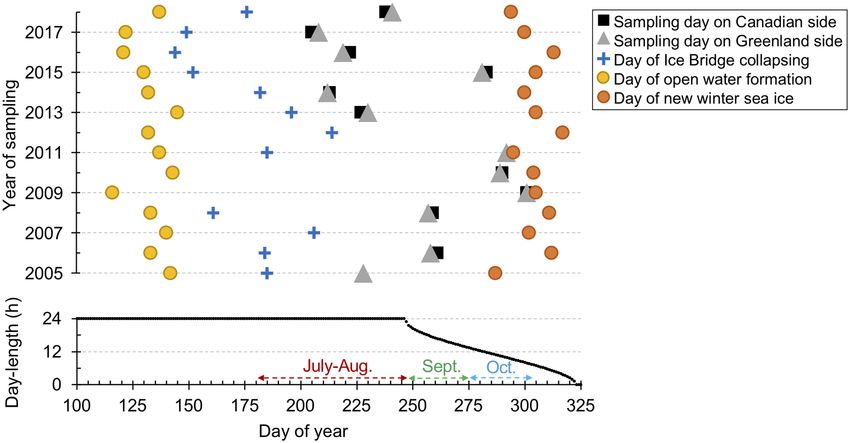
www.nature.com/scientificreports/
Figure 5. Specialist taxa in summer versus autumn inferred using the CLAM test (see main text). (a) The
CLAM test plot of all OTUs in summer (July–August, n = 42) and autumn samples (October, n = 28) from
both sides, both depths (surface and SCM), from both rRNA and rDNA datasets of all years (2005–2018),
excluding 2006 and 2008 from September samples. Note that OTUs with < 10 reads were too rare to be classified.
Percentage of total OTUs following the color code. The points marked with letters indicate the position of
“top” seasonal indicator OTUs (see Fig. 6). (b) Relative abundance of the major groups in summer and autumn
(number of reads), legend correspondence is given by both colors and numbers.
all negatively correlated with temperature and positively correlated with sampling just prior to new winter sea-
ice formation (Fig. 7).
The top summer specialist dinoflagellates (OTU-13 and -2561) were both in the Gyrodinium helveti-
cum–rubrum clade that has been reported from other regions of the Arctic1,24. In the Beaufort Sea, the clade was
common both in summer and autumn mesopelagic s amples25, which may have been due to sinking aggregates
or an ability to exploit wide spectrum of conditions.
While the October alveolate community showed a high proportion of dinoflagellates, the highest proportion
of reads in summer belonged to ciliates. The majority of summer ciliates were in the Spirotrichea, which includes
the order Strombidiida ( PR2 classification), which is more or less synonymous with the Order Oligotrichia
(Silva database). Oligotrichia are often reported to be kleptoplastidic retaining chloroplasts from prey species to
facilitate mixotrophy. In particular, the summer specialist Laboea (OTU-100) favors the retention of Micromonas
chloroplasts and contributes to primary productivity in temperate s eas26. It was also previously reported from
summer North Water s amples17 and associated with longer day-length in the Beaufort S ea27, in keeping with it
being a summer specialist.
Year to year variation in species was evident with the highest proportions of total ciliate reads in summer of
2018, when ciliates dominated communities on both sides (Supplementary Figs. S2 and S4). Loxophyllum (OTU-
17) had exceptionally high read proportions on the Greenland side at the SCM, suggesting a possible ciliate
“bloom”, defined as higher-than-normal biomass within a given taxon. The “bloom” appeared widespread and
while read counts were higher on the Greenland side, Loxophyllum was recorded on the Canadian side (Fig. 6).
Ciliate blooms other than Mesodinium rubrum28 are not often reported but given the dominance of this single
taxon it should be investigated in the Arctic.
In contrast to autumn, top summer OTUs included chrysophytes, along with diatoms and chlorophytes that
are strictly photosynthetic phytoplankton (Fig. 6). The chlorophyte genus Micromonas, in particular M. polaris,
is a key component of Arctic marine food w ebs29 and is frequently reported from summer nutrient-depleted
waters of the Arctic Ocean. M. polaris has a pan-Arctic distribution29,30, is adapted to cold temperatures and
can persist under low-light regimes, with maximum growth rates around 6°C29. Although M. polaris is found
Scientific Reports | (2021) 11:8413 | https://doi.org/10.1038/s41598-021-87906-4 7
Vol.:(0123456789)www.nature.com/scientificreports/
Figure 6. Proportion of reads from the 22 “top” OTUs defined as having reads accounting for > 0.5% of the
entire community. Samples are ordered chronologically for each season (July–August: 2005, 2013–2014,
2016–2018; September: 2006 and 2008; October: 2009–2011 and 2015). The heatmap shows the rRNA (R)
and rDNA (D) library results (upper axis). Taxa are ordered and color coded by major high-level classification
(approximately equivalent to phyla in botanical nomenclature): from most to least abundant in terms of reads
within the phyla (see Fig. 7 for identification of the OTUs). The color intensity in the heatmap reflects the
number of reads of each taxon with darker intensities indicating higher read counts, note the different scale for
Ciliophora. Based on the results of CLAM test (Fig. 5; Supplementary Figs. S5, S6 and S7), the corner right bars
indicate specialist taxa. Color coded for specificity to a season, a region, a depth or to nucleic acid source. Grey
in all bars indicate non-specialist taxa for the category.
all year round25,31, it tends to decrease during the winter24,31 in accord with being a summer specialist. A second
putative species or ecotype of Micromonas (OTU-73), was also revealed with the massive sequencing effort
over the 12 years. In addition, at least in the Arctic where Micromonas is the dominant picophytoplankton,
viral interactions could also play a role in driving population dynamics and s easonality32,33. The two dominant
Micromonas OTUs were both related to cold water isolates. OTU-639 was 100% identical to CCMP2099 that
was originally isolated from the North Water and OTU-73 was closest to clones from Svalbard and the North
Atlantic (Supplementary Table S8 and Fig. S9).
Scientific Reports | (2021) 11:8413 | https://doi.org/10.1038/s41598-021-87906-4 8
Vol:.(1234567890)www.nature.com/scientificreports/
Figure 7. Spearman’s rank correlation (ρ) matrices between environmental variables and the 22 top OTUs
(reads > 0.5% of the entire community) from both rDNA and rRNA reads. Spearman correlation coefficient
values are represented by the size of the circles (larger for high coefficients; smaller for low coefficients) and
color (blue – positive; grey – negative), empty squares indicate no correlation. Asterisks within circles represent
the significance level p-value from Spearman’s Rho (p < 0.05 *, p < 0.01 **, p < 0.001 ***). Environmental variables:
depth of sampling (Z), water temperature (Temp.), salinity (Sal.), Chl a fluorescence (Fluo.), dissolved oxygen
(O2), nitrate (NO32−), silicate ( SiO4), phosphate ( PO43−). Also given are values from the visual analysis of ice
charts produced by the Canadian Ice Service (CIS): day-length (from Fig. 2); days between sampling (s) date
and ice bridge collapsing (s-IBC); depth of maximum mean vertical gradient in fluorescence, dFluo./dz (ΔFluo.);
pycnocline is the depth of Brunt-Väisälä frequency maximum (ΔN2); depth of the Surface Mixed Layer (SML);
day of the year of when the polynya opened as open water (OW); day of the year when the samples were
collected (s day); day of the year when new winter sea ice (NWSI) occurred; total days between OW and NWSI
(OW-NWSI); days from the beginning of OW to sampling (OW-s).
For our multi-year study, although temperatures never exceeded 4.5 °C in any year, both Micromonas top
OTUs were correlated with temperature along with longer day-length. Both were classified as specialists on the
Greenland side (Figs. 6 and 7; Supplementary Fig. S5), which tended to be warmer in summer, but neither were
ever absent from the Canadian side. Overall, given the very small temperature changes influencing relative
abundance and occurrence, it seems that the Arctic M. polaris is truly a sentinel species in the Arctic34.
The spring bloom in the Arctic is generally dominated by larger centric, especially Thalassiosiroid diatoms35,36,
followed by species of hyalochaete Chaetoceros in the Mediophyceae. In particular, biomass is dominated by
colonies of the pan-Arctic C. gelidus, which was previously classified with C. socialis2. C. gelidus is widely distrib-
uted in the Arctic and can remain abundant into July, August and even September, despite diminishing nutrient
concentrations over the course of the season18,37. The persistence in the North Water is attributed to nutrient
input from Pacific origin water from Nares Strait and the Canadian Arctic Archipelago via Jones Sound18. Because
these conditions favor this lightly silicified Chaetoceros, the species is critical in supporting the overall biological
olynya37.
richness of the p
The top Chaetoceros (OTU-1056) was automatically classified as C. socialis but was most similar to C. gelidus
albeit with nucleotide differences compared to the type species from the Beaufort Sea. A true North Atlantic C.
socialis could also occur in the region, due to the input of Atlantic Water in the north flowing West Greenland
Current. Alternatively, OTU-1056 could represents a distinct regional ecotype within a larger C. socialis-gelidus
species complex. Over the 12 years period of our study, the same OTU-1056 was often abundant during sum-
mer months, especially on the more Arctic water influenced Canadian side (Figs. 5b and 6), suggesting that this
is a North Water ecotype and not attributable to A tlantification38 of the northern North Water. The significant
Scientific Reports | (2021) 11:8413 | https://doi.org/10.1038/s41598-021-87906-4 9
Vol.:(0123456789)www.nature.com/scientificreports/
correlation between lower salinity and the OTU was consistent with fresher Arctic modified waters on the
Canadian side (Fig. 7).
The filtration strategy and use of the small size (0.2–3 µm) fraction followed previous molecular s urveys1,39
to better detect small eukaryotic cells. However, many of the 18S rRNA gene sequences belonged to presumably
larger protists, mostly dinoflagellates and ciliates (Fig. 4; Supplementary Fig. S2), as previously reported using
the same a pproach27. Reasons for this have been discussed elsewhere and deformation of flexible-walled cells and
cell breakage during filtration would lead to reads from larger cells in the small fraction. The high read counts in
the rDNA for dinoflagellates, would reflect the larger genomes and multiple rRNA gene copy numbers. However,
we note that a high proportion of dinoflagellates was reported in a recent study of Arctic phytoplankton with
dinoflagellates accounting for 11–45% of phytoplankton across the Arctic, consistent with dinoflagellates as
important contributors to Arctic microplankton biodiversity40. Ciliates were “rRNA” specialists, which would
be consistent with high numbers of r ibosomes41. Dinoflagellates and ciliates are routinely reported as mostly
unidentified species in Baffin Bay, with dinoflagellate biomass v ariable14. And both groups were abundant and
reported in the 1998 North Water Polynya study. Overall, our molecular approach enabled us to identify seasonal
and spatial trends at a much more refined taxonomic level than is possible using routine microscopy, where
species assignation can be subjective and dependent on the experience and expertise of individual researchers.
In summer, the differences between the two sides of the North Water communities reflected the differences
in hydrography, dominant surface currents and water mass distributions. All of these factors influenced nutrient
concentrations and salinity that were the main explanatory variables separating surface and SCM communities
(Fig. 3; Supplementary Fig. S3). In particular, salinity had a strong influence on Greenland side, where warm
salty Atlantic waters are found at depth4 beneath fresher surface waters influenced by ice melt. The increased
stratification promoted the formation of an SCM14. However, only one of the top OTUs was an SCM specialist
(Chaunacanthida, OTU-577) and only two (Strombidiida, OTU-7 and Chrysophyceae, OTU-1530) were surface
specialists, suggesting that the majority of the higher abundance OTUs do relatively well throughout the euphotic
zone. There were differences between the two sides, with each side having specialist top taxa (Fig. 6). The pico-
planktonic Micromonas along with the Chaunacanthida and the ciliate Didinium (OTU-678) were most often
on the Greenland side and associated with warmer temperatures. In contrast, the western specialists included
Chaetoceros (OTU-1056), a Strombidiida (OTU-7) and two picoplanktonic heterotrophs (MAST-7A, OTU-335
and Picozoa, OTU-1392), suggesting a different microbial food webs operating on the two sides.
Day-length and light availability are critical at high latitudes where day-length runs from 0 to 24 h. In our lim-
ited seasonal sampling, where we were only able to collect samples during the ice-free summer and late autumn,
the July–August samples were collected when the sun was above the horizon 24 h a day. Here, Micromonas spp.
were correlated with longer day-length and lower nutrients (Fig. 7) that are characteristic of post-spring-bloom
conditions. Light was the primary limiting resource in October, and we found little evidence of increased Chl a
in October even though nutrient levels were higher. The sun sets below the horizon starting in early September
at this latitude and following the autumnal equinox, day-length shortens rapidly, and the shortest day sampled
was less than 8 h of direct sunlight (Fig. 2; Supplementary Table S1). The lack of a late season bloom contrasts
with the expectation that autumnal blooms will occur due to an extended open water season because of a later
ice formation, with the phytoplankton exploiting the nutrients supplied by convective mixing16. In this case, the
high latitude of the North Water may have precluded an October bloom as diatoms would have been light-limited
due to low sun angle and the deeper mixed l ayer7.
To date, evidence of fall blooms or increased Chl a biomass has been reported for inflow shelfs and linked to
climate change42. Ours is the first multiyear study of an outflow shelf to our knowledge, and it remains to be seen
if outflow shelves are generally less susceptible to fall blooms. A caveat for the lack of change over the 12 years
could be that the series began after major changes had already occurred. Our results highlight the need for further
in situ studies and monitoring along with well-designed paleoceanography studies aimed at recovering planktonic
DNA in the sediments. The differences in relative abundance of OTUs was mostly associated with season and
somewhat by geography, depth and nucleic acid source. In summer, sentinel species such as Micromonas polaris
and Chaetoceros socialis (C. gelidus) were favored by slightly warmer surface temperatures and nutrient-poor
waters at the end of summer. Dinoflagellates, especially from an uncultured oceanic Dinophyceae group were
associated with autumn and correlated with cold and nutrient-rich waters, at least 3 OTUs were placed on long
branches compared to other uncultured sequences available suggesting that they could be typical of current
conditions and sentinels that should be monitored to detect ecosystem change. Although more sampling from
other regions is needed, autumn phytoplankton in the Arctic may be dinoflagellate dominated and not ecologi-
cally equivalent to diatom dominated spring and early summer blooms.
Materials and methods
Study site. Data on ice dynamics of the region (Baffin Bay and Nares Strait) were extracted from satellite
images from National Snow and Ice Data Center (NSIDC) and from NASA Earth Observatory (SMMR, SSM/I
and SSMIS sensors) from 2005 to 2 01843. The beginning of open water (OW) and the start of the new winter
sea-ice (NWSI) period were determined as in Marchese et al.10. The duration of the OW season was defined as
number of days between opening of the North Water polynya and NWSI, when ice reformed over the region. The
date of ice bridge collapse (IBC) in Nares Strait was determined from a visual analysis of ice charts produced by
the Canadian Ice Service and images from NSIDC and NASA consistent with earlier s tudies14,44.
Samples collection. We analysed a total of 50 samples that had been collected onboard the research ice-
breaker CCGS Amundsen between 2005 and 2018 during multidisciplinary missions, associated with ArcticNet.
The missions were carried out nearly annually along West–East transects on a line that varied from 76.20°N to
Scientific Reports | (2021) 11:8413 | https://doi.org/10.1038/s41598-021-87906-4 10
Vol:.(1234567890)www.nature.com/scientificreports/
76.58°N, depending on ice and other mission constraints (Fig. 1; Supplementary Table S1). A primary goal of
our study was to examine variability of the two sides of the northern North Water ecological region between
Ellesmere Island, Nunavut, Canada and Greenland for which we selected samples from the westernmost and
easternmost stations (Stn) of the transect. Because of mission constraints, the samples were collected in different
seasons in the different years (Fig. 2), specifically at the end of July through August in 2005, 2013, 2014, 2016,
2017 and 2018; September in 2006 and 2008 and October in 2009, 2010, 2011 and 2015. The transect was not
carried out in 2007 or 2012 and no samples were available from these two years. The majority of the westernmost
samples were from ArcticNet Stn101, which was sampled 2006, 2008, 2013, 2014, 2017 and 2018. However, due
to ice conditions preventing the ship reaching Stn101, samples were taken from the next most westerly station
(Stn105) in 2009, 2010 and 2016. The easternmost station on the Greenland side, Stn 115, was sampled in all
years. We targeted the upper polar mixed layer (surface; 0–15 m) and the SCM detected on the downward cast.
This feature normally forms below the polar mixed layer at the top of a halocline (20–80 m).
Physical oceanographic profiles were collected on the downward cast using a rosette system that was equipped
with a conductivity, temperature, depth (SBE-911 CTD, Sea-Bird Electronics Inc.) profiler, sensors for chloro-
phyll fluorescence (Seapoint Sensors Inc.) and relative nitrate from the ultraviolet spectrophotometer (ISUS,
Satlantic). All water samples were collected on the upward cast. Nutrient samples were collected every 10 m from
the surface to 100 m. The samples for nutrients were taken directly from the 12L Niskin-type bottles mounted
on the rosette, filtered through a 0.2 µm polycarbonate filters (PC, AMD Manufacturing) into acid cleaned and
rinsed PC tubes and kept at 4 °C until analysis within 4 h of collection. Nitrate + Nitrite, Silicate and Phosphate
were analyzed on board using a Bran-Luebbe 3 auto-analyzer45.
Water samples for microbial DNA and RNA were collected from the Niskin-type bottles into cleaned acid
rinsed carboys. The water was pre-filtered immediately onboard through a 50 µm nylon mesh to remove macro-
zooplankton. Then sequentially through a 3 µm pore size PC filter and a 0.2 µm Sterivex Unit (Millipore Canada
Ltd.) using a peristaltic pump system (Cole-Palmer Company). Prior to 2010, samples for DNA and RNA were
filtered separately as described in Terrado et al.46 (Supplementary Table S9). Briefly, for DNA, lysis buffer was
added to the Sterivex and cryovials, which were then frozen at − 80 °C. For RNA, samples were filtered as indi-
cated above except that only 4L of seawater was filtered for each sample and filters were preserved in RLT buffer
(Qiagen) with 1% β-mercaptoethanol (Sigma-Aldrich) flash frozen in liquid nitrogen and stored at − 80 °C.
After 2011, samples for DNA and RNA were collected on the same filters and preserved by adding 1.8 mL of
RNAlater (Ambio, ThermoFisher Scientific) to the Sterivex and cryovials. After 1 h in buffer, the filters were
frozen at − 80 °C until processing in the laboratory. In an effort to identify smaller organisms typical of later in
the season14, we focused the study on 0.2–3 µm fraction, recognizing that larger organisms are captured on the
same filters, most likely due to cell breakage.
Nucleic acid extraction and sequencing. For samples collected in 2005 and 2006, DNA was extracted
from the filters using an equal volume of phenol–chloroform-isoamyl alcohol (Supplementary Table S9). For
samples collected from 2008 to 2011, DNA was extracted from the filters as described in Terrado et al.46 based
on a salt extraction method. The RNA samples from 2005 to 2011 were extracted using the RNAEasy Micro
Kit (Qiagen). After 2013, DNA and RNA were extracted from the same filters using the All-Prep DNA/RNA
Mini Kit (Qiagen) as previously d escribed47. For all years, conversion of RNA to cDNA was carried out using
the High-Capacity Reverse Transcription Kit (Applied Biosystems) following the manufacturer’s suggestions.
The V4 region of 18S rRNA in both DNA and cDNA samples was amplified using eukaryotic specific forward
primers (E572F) and reverse primers (E1009R)48 coupled with a MiSeq specific linking primer. Unique pairs of
barcodes were added to the sample amplicons using the TruSeq and Nextera (Illumina) barcode sets in a nested
PCR under conditions previously d escribed48. The PCR products were purified using the Axygen PCR cleanup
kit and quantified spectrophotometrically with the Nanodrop 1000 (ThermoFisher Scientific). For each run,
equimolar concentrations of amplicons from each sample were pooled for multiplex sequencing using the MiSeq
at the Plateforme d’Analyses Génomiques (IBIS, Université Laval, Québec, Canada).
Sequence data processing and taxonomic classification. Resulting reads were quality filtered,
checked and de-replicated using BBMerge (v.37.36)49. Putative chimeric sequences and singletons were removed
using VSEARCH (v.2.5)50. The retained reads were clustered into Operational Taxonomic Units (OTU) at 98%
similarity using USEARCH (v.10.0.240)51 and mothur (v.1.41.1)52 as in Comeau et al.53. OTUs were assigned
a taxonomy using the Silva Reference Database (v.132)54 and the Protist Ribosomal Reference ( PR2) database
(v.4.11)55; (Supplementary Table S10). To facilitate diversity comparisons of single-celled microbial eukaryotes,
the OTU matrix was filtered to eliminate metazoan (296 reads in total), fungi (30 reads) and Streptophyta (73
reads), then rarefied, based on the sample with the fewest reads (11,374 reads) using Q IIME56.
The 22 “top” OTUs (with > 0.5% of total reads from the entire data set) were selected to identify species specific
trends. The 22 selected taxa belonged to higher-level taxonomic groups: Ciliophora, Dinoflagellata, Chlorophyta,
Picozoa, Rhizaria, Chrysophyta, Bacillariophyta and the heterotrophic Marine Stramenopiles (MASTs). The
top dinoflagellate OTUs were taxonomically placed onto the reference phylogenetic tree using the Evolutionary
Placement Algorithm (EPA) of R AxML57. The reference tree was constructed from curated full-length 18S rRNA
gene sequences of the specific groups. Sequences were aligned using MUSCLE (v.8.1.13)58 and phylogenetic tree
constructed using randomized accelerated maximum likelihood (RAxML v.8.2.11, 1000 bootstrap replicates,
model GTRGAMMA)59.
Calculations and statistics analyses. Stratification in the upper 100 m was inferred using two methods
epth60 at which the gradi-
(Supplementary Table S2). First the surface mixed layer depth was determined by the d
Scientific Reports | (2021) 11:8413 | https://doi.org/10.1038/s41598-021-87906-4 11
Vol.:(0123456789)www.nature.com/scientificreports/
ent in density between two successive depths was > 0.01 kg m−4. A second method relied on the Brunt-Väisälä
(or buoyancy – N 2) frequency in the upper water column, defined as the depth when N 2 was the greatest in the
11 −
upper waters . The Nitracline (∆NO3 ) was defined as depth where the vertical gradient in N O3− concentration
(dNO3−/dz) was g reatest11. Day-length was calculated from nrc-cnrc.gc.ca and based on latitude 76.36°N and
longitude − 74.01°W. The pairwise Multinomial Species Classification Method (CLAM)61 test was used to classify
each OTU into a category: generalist, specialist of one habitat or of the second habitat or too rare. To separate
samples we used clamtest() function in R (v.3.4.2) with a p-value of 0.01 and a coverage limit of 10 sequences
as a rarity threshold. We applied the CLAM test between 4 different groups of samples: rDNA or rRNA; West
(Canadian side) or East (Greenland side); surface or SCM and summer (July and August) or autumn (October).
NMDS was computed using the metaMDS() function to compare similarity between samples. Distance-Based
Redundancy Analysis (db-RDA) and Constrained Correspondence Analysis (CCA) were computed using dbrda()
and cca() functions, to discriminate the different sampling stations according to the environmental variables. The
independent parameters that best explained variability in the db-RDA and CCA were selected using ordiR2step()
and envfit() functions, by automatic forward selection, which selects variables to build optimal model with the
highest adjusted coefficient determination. Non-Parametric Multivariate Analysis of Variance (NP-MANOVA)
and Analysis of Similarity (ANOSIM) were used to test differences in composition between seasons, sides and
depths. Permutational Multivariate Analyses of Variance (PerMANOVA) was conducted to analyze the correla-
tions between environmental factors and community changes, using adonis() function. To test differences in
environmental parameters between stations and depths, Welsh two-sample t-tests, verified with a non-parametric
Kruskal–Wallis One-Way Analysis of Variance on ranks were used.
Data availability
All amplicon results are in the NCBI GenBank Sequence Read Archive (SRA) under BioProject PRJNA383398
(GenBank: SRX2745641, SRX2745642, SRX2745625 and SRX2745626) and PRJNA662595 (GenBank:
SRR12643378 to SRR12643456). Oceanographic data is available from Amundsen Science: Amundsen Science
Data Collection. [2005–2018]. Processed data. Version 1. Archived at www.polardata.ca, Canadian Cryospheric
Information Network (CCIN), Waterloo, Canada. https://doi.org/10.5884/12713. Accessed on [July 2019].
Code availability
Computer codes and scripts are available from the corresponding authors upon request.
Received: 1 October 2020; Accepted: 6 April 2021
References
1. Lovejoy, C., Massana, R. & Pedros-Alio, C. Diversity and distribution of marine microbial eukaryotes in the Arctic Ocean and
adjacent seas. Appl. Environ. Microb. 72, 3085–3095. https://doi.org/10.1128/aem.72.5.3085-3095.2006 (2006).
2. Chamnansinp, A., Li, Y., Lundholm, N. & Moestrup, Ø. Global diversity of two widespread, colony-forming diatoms of the marine
plankton, Chaetoceros socialis (syn. C. radians) and Chaetoceros gelidus sp. nov.. J. Phycol. 49, 1128–1141. https://doi.org/10.1111/
jpy.12121 (2013).
3. Bluhm, B. A. & Gradinger, R. Regional variability in food availability for Arctic marine mammals. Ecol. Appl. 18, S77-96. https://
doi.org/10.1890/06-0562.1 (2008).
4. Bâcle, J., Carmack, E. C. & Ingram, R. G. Water column structure and circulation under the North Water during spring transition:
April–July 1998. Deep Sea Res. Part II Top. Stud. Oceanogr. 49, 4907–4925. https://d oi.o
rg/1 0.1 016/S 0967-0 645(02)0 0170-4 (2002).
5. Dumont, D., Gratton, Y. & Arbetter, T. E. Modeling wind-driven circulation and landfast ice-edge processes during polynya events
in Northern Baffin Bay. J. Phys. Oceanogr. 40, 1356–1372. https://doi.org/10.1175/2010JPO4292.1 (2010).
6. Tremblay, J. -É., Gratton, Y., Fauchot, J. & Price, N. M. Climatic and oceanic forcing of new, net, and diatom production in the
North Water. Deep Sea Res. Part II Top. Stud. Oceanogr. 49, 4927–4946. https://doi.org/10.1016/S0967-0645(02)00171-6 (2002).
7. Michel, C. et al. Arctic Ocean outflow shelves in the changing Arctic: A review and perspectives. Progr. Oceanogr. 139, 66–88.
https://doi.org/10.1016/j.pocean.2015.08.007 (2015).
8. Møller, E. F. et al. Zooplankton phenology may explain the North Water polynya’s importance as a breeding area for little auks.
Mar. Ecol. Progr. Ser. 605, 207–223. https://doi.org/10.3354/meps12745 (2018).
9. Mei, Z.-P. et al. Physical control of spring–summer phytoplankton dynamics in the North Water, April–July 1998. Deep Sea Res.
Part II Top. Stud. Oceanogr. 49, 4959–4982. https://doi.org/10.1016/S0967-0645(02)00173-X (2002).
10. Marchese, C. et al. Changes in phytoplankton bloom phenology over the North Water (NOW) polynya: a response to changing
environmental conditions. Polar Biol. 40, 1721–1737. https://doi.org/10.1007/s00300-017-2095-2 (2017).
11. Martin, J. et al. Prevalence, structure and properties of subsurface chlorophyll maxima in Canadian Arctic waters. Mar. Ecol. Progr.
Ser. 412, 69–84. https://doi.org/10.3354/meps08666 (2010).
12. Joli, N. et al. Need for focus on microbial species following ice melt and changing freshwater regimes in a Janus Arctic Gateway.
Sci. Rep. 8, 9405. https://doi.org/10.1038/s41598-018-27705-6 (2018).
13. Lehmann, N. et al. Remote western Arctic nutrients fuel remineralization in deep Baffin Bay. Global Biogeochem. Cycles 33, 649–667.
https://doi.org/10.1029/2018GB006134 (2019).
14. Blais, M. et al. Contrasting interannual changes in phytoplankton productivity and community structure in the coastal Canadian
Arctic Ocean. Limnol. Oceanogr. 62, 2480–2497. https://doi.org/10.1002/lno.10581 (2017).
15. Ardyna, M., Gosselin, M., Michel, C., Poulin, M. & Tremblay, J. -É. Environmental forcing of phytoplankton community structure
and function in the Canadian High Arctic: Contrasting oligotrophic and eutrophic regions. Mar. Ecol. Progr. Ser. 442, 37–57.
https://doi.org/10.3354/meps09378 (2011).
16. Ardyna, M. et al. Recent Arctic Ocean sea ice loss triggers novel fall phytoplankton blooms. Geophys. Res. Lett. 41, 6207–6212.
https://doi.org/10.1002/2014GL061047 (2014).
17. Lovejoy, C., Legendre, L., Martineau, M.-J., Bâcle, J. & Von Quillfeldt, C. H. Distribution of phytoplankton and other protists in the
North Water. Deep Sea Res. Part II Top. Stud. Oceanogr. 49, 5027–5047. https://doi.org/10.1016/S0967-0645(02)00176-5 (2002).
18. Tremblay, J. -É., Michel, C., Hobson, K. A., Gosselin, M. & Price, N. M. Bloom dynamics in early opening waters of the Arctic
Ocean. Limnol. Oceanogr. 51, 900–912. https://doi.org/10.4319/lo.2006.51.2.0900 (2006).
Scientific Reports | (2021) 11:8413 | https://doi.org/10.1038/s41598-021-87906-4 12
Vol:.(1234567890)www.nature.com/scientificreports/
19. Mayzaud, P., Boutoute, M., Noyon, M., Narcy, F. & Gasparini, S. Lipid and fatty acids in naturally occurring particulate matter
during spring and summer in a high arctic fjord (Kongsfjorden, Svalbard). Mar. Biol. 160, 383–398. https://doi.org/10.1007/
s00227-012-2095-2 (2013).
20. Dumont, D., Gratton, Y. & Arbetter, T. E. Modeling the dynamics of the North Water Polynya Ice Bridge. J. Phys. Oceanogr. 39,
1448–1461. https://doi.org/10.1175/2008jpo3965.1 (2009).
21. Simo-Matchim, A.-G., Gosselin, M., Poulin, M., Ardyna, M. & Lessard, S. Summer and fall distribution of phytoplankton in relation
to environmental variables in Labrador fjords, with special emphasis on Phaeocystis pouchetii. Mar. Ecol. Progr. Ser. 572, 19–42.
https://doi.org/10.3354/meps12125 (2017).
22. Flynn, K. J. et al. Mixotrophic protists and a new paradigm for marine ecology: where does plankton research go now?. J. Plankton
Res. 41, 375–391. https://doi.org/10.1093/plankt/fbz026 (2019).
23. Levinsen, H. & Nielsen, T. G. The trophic role of marine pelagic ciliates and heterotrophic dinoflagellates in arctic and temperate
coastal ecosystems: A cross-latitude comparison. Limnol. Oceanogr. 47, 427–439. https://d oi.o
rg/1 0.4 319/l o.2 002.4 7.2.0 427 (2002).
24. Marquardt, M., Vader, A., Stübner, E. I., Reigstad, M. & Gabrielsen, T. M. Strong seasonality of marine microbial eukaryotes in a
high-Arctic fjord (Isfjorden, in West Spitsbergen, Norway). Appl. Environ. Microb. 82, 1868–1880. https://doi.org/10.1128/AEM.
03208-15 (2016).
25. Terrado, R., Vincent, W. F. & Lovejoy, C. Mesopelagic protists: diversity and succession in a coastal Arctic ecosystem. Aquat. Microb.
Ecol. 56, 25–39. https://doi.org/10.3354/ame01327 (2009).
26. Johnson, M. D. & Beaudoin, D. J. The genetic diversity of plastids associated with mixotrophic oligotrich ciliates. Limnol. Oceanogr.
64, 2187–2201. https://doi.org/10.1002/lno.11178 (2019).
27. Onda, D. F. et al. Seasonal and interannual changes in ciliate and dinoflagellate species assemblages in the Arctic Ocean (Amundsen
Gulf, Beaufort Sea, Canada). Front. Mar. Sci. 4, 16. https://doi.org/10.3389/fmars.2017.00016 (2017).
28. Olsen, L. M. et al. A red tide in the pack ice of the Arctic Ocean. Sci. Rep. 9, 9536. https://doi.org/10.1038/s41598-019-45935-0
(2019).
29. Lovejoy, C. et al. Distribution, phylogeny, and growth of cold-adapted Picoprasinophytes in Arctic seas 1. J. Phycol. 43, 78–89.
https://doi.org/10.1111/j.1529-8817.2006.00310.x (2007).
30. Metfies, K., von Appen, W.-J., Kilias, E., Nicolaus, A. & Nöthig, E.-M. Biogeography and photosynthetic biomass of arctic marine
pico-eukaroytes during summer of the record sea ice minimum 2012. PLoS ONE 11, e0148512. https://doi.org/10.1371/journal.
pone.0148512 (2016).
31. Joli, N., Monier, A., Logares, R. & Lovejoy, C. Seasonal patterns in Arctic prasinophytes and inferred ecology of Bathycoccus
unveiled in an Arctic winter metagenome. ISME J. 11, 1372. https://doi.org/10.1038/ismej.2017.7 (2017).
32. Piedade, G. J., Wesdorp, E. M., Montenegro-Borbolla, E., Maat, D. S. & Brussaard, C. P. D. Influence of irradiance and temperature
on the virus MpoV-45T infecting the Arctic picophytoplankter Micromonas polaris. Viruses 10, 676. https://d oi.o
rg/1 0.3 390/v 1012
0676 (2018).
33. Maat, D. S. et al. Characterization and temperature dependence of Arctic Micromonas polaris viruses. Viruses 9, 134. https://doi.
org/10.3390/v9060134 (2017).
34. Demory, D. et al. Picoeukaryotes of the Micromonas genus: sentinels of a warming ocean. ISME J. 13, 132–146. https://doi.org/10.
1038/s41396-018-0248-0 (2019).
35. Ardyna, M. et al. Shelf-basin gradients shape ecological phytoplankton niches and community composition in the coastal Arctic
Ocean (Beaufort Sea). Limnol. Oceanogr. 62, 2113–2132. https://doi.org/10.1002/lno.10554 (2017).
36. Luddington, I. A., Lovejoy, C. & Kaczmarska, I. Species-rich meta-communities of the diatom order Thalassiosirales in the Arctic
and northern Atlantic Ocean. J. Plankton Res. 38, 781–797. https://doi.org/10.1093/plankt/fbw030 (2016).
37. Booth, B. C. et al. Dynamics of Chaetoceros socialis blooms in the North Water. Deep Sea Res. Part II Top. Stud. Oceanogr. 49,
5003–5025. https://doi.org/10.1016/S0967-0645(02)00175-3 (2002).
38. Oziel, L. et al. Faster Atlantic currents drive poleward expansion of temperate phytoplankton in the Arctic Ocean. Nat. Commun.
11, 1–8. https://doi.org/10.1038/s41467-020-15485-5 (2020).
39. Dı́ez, B., Pedrós-Alió, C. & Massana, R. Study of genetic diversity of eukaryotic picoplankton in different oceanic regions by small-
subunit rRNA Gene cloning and sequencing. Appl. Environ. Microb. 67, 2932. https://doi.org/10.1128/AEM.67.7.2932-2941.2001
(2001).
40. Crawford, D. W., Cefarelli, A. O., Wrohan, I. A., Wyatt, S. N. & Varela, D. E. Spatial patterns in abundance, taxonomic composition
and carbon biomass of nano-and microphytoplankton in subarctic and Arctic Seas. Prog. Oceanogr. 162, 132–159. https://doi.org/
10.1016/j.pocean.2018.01.006 (2018).
41. Fu, R. & Gong, J. Single cell analysis linking ribosomal (r) DNA and r RNA copy numbers to cell size and growth rate provides
insights into molecular protistan ecology. J. Eukaryot. Microbiol. 64, 885–896. https://doi.org/10.1111/jeu.12425 (2017).
42. Lewis, K., Van Dijken, G. & Arrigo, K. R. Changes in phytoplankton concentration now drive increased Arctic Ocean primary
production. Science 369, 198–202. https://doi.org/10.1126/science.aay8380 (2020).
43. Fetterer, F., Knowles, K., Meier, W. N., Savoie, M. & Windnagel, A. K. Updated daily Sea Ice Index, Version 3 (NSIDC: National
Snow and Ice Data Center, Boulder, CO USA). https://doi.org/10.7265/N5K072F8 (2017).
44. Ryan, P. A. & Münchow, A. Sea ice draft observations in Nares Strait from 2003 to 2012. J. Geophys. Res. Oceans 122, 3057–3080.
https://doi.org/10.1002/2016JC011966 (2017).
45. Grasshoff, K. et al. (eds). Methods of seawater analysis 3rd edn (John Wiley & Sons). https://d oi.o
rg/1 0.1 002/9 78352 76139 84 (2009).
46. Terrado, R. et al. Protist community composition during spring in an Arctic flaw lead polynya. Polar Biol. 34, 1901–1914. https://
doi.org/10.1007/s00300-011-1039-5 (2011).
47. Dasilva, C. R., Li, W. K. W. & Lovejoy, C. Phylogenetic diversity of eukaryotic marine microbial plankton on the Scotian Shelf
Northwestern Atlantic Ocean. J. Plankton Res. 36, 344–363. https://doi.org/10.1093/plankt/fbt123 (2014).
48. Comeau, A. M., Li, W. K., Tremblay, J. -É., Carmack, E. C. & Lovejoy, C. Arctic Ocean microbial community structure before and
after the 2007 record sea ice minimum. PLoS ONE 6, e27492. https://doi.org/10.1371/journal.pone.0027492 (2011).
49. Bushnell, B., Rood, J. & Singer, E. BBMerge–accurate paired shotgun read merging via overlap. PLoS ONE 12, e0185056. https://
doi.org/10.1371/journal.pone.0185056 (2017).
50. Rognes, T., Flouri, T., Nichols, B., Quince, C. & Mahé, F. VSEARCH: A versatile open source tool for metagenomics. PeerJ 4, e2584.
https://doi.org/10.7717/peerj.2584 (2016).
51. Edgar, R. C. Search and clustering orders of magnitude faster than BLAST. Bioinformatics 26, 2460–2461. https://doi.org/10.1093/
bioinformatics/btq461 (2010).
52. Schloss, P. D. et al. Introducing mothur: open-source, platform-independent, community-supported software for describing and
comparing microbial communities. Appl. Environ. Microb. 75, 7537–7541. https://doi.org/10.1128/AEM.01541-09 (2009).
53. Comeau, A. M. et al. Protists in Arctic drift and land-fast sea ice. J. Phycol. 49, 229–240. https://doi.org/10.1111/jpy.12026 (2013).
54. Quast, C. et al. The SILVA ribosomal RNA gene database project: improved data processing and web-based tools. Nucleic Acids
Res. 41, D590–D596. https://doi.org/10.1093/nar/gks1219 (2012).
55. Guillou, L. et al. The protist ribosomal reference database (PR2): A catalog of unicellular eukaryote Small Sub-Unit rRNA sequences
with curated taxonomy. Nucleic Acids Res. 41, D597–D604. https://doi.org/10.1093/nar/gks1160 (2012).
56. Caporaso, J. G. et al. QIIME allows analysis of high-throughput community sequencing data. Nat. Methods 7, 335–336. https://
doi.org/10.1038/nmeth.f.303 (2010).
Scientific Reports | (2021) 11:8413 | https://doi.org/10.1038/s41598-021-87906-4 13
Vol.:(0123456789)You can also read