PARROT is a flexible recurrent neural network framework for analysis of large protein datasets
←
→
Page content transcription
If your browser does not render page correctly, please read the page content below
TOOLS AND RESOURCES
PARROT is a flexible recurrent neural
network framework for analysis of large
protein datasets
Daniel Griffith1,2, Alex S Holehouse1,2*
1
Department of Biochemistry and Molecular Biophysics, Washington University
School of Medicine, St Louis, United States; 2Center for Science and Engineering
Living Systems, Washington University, St Louis, United States
Abstract The rise of high-throughput experiments has transformed how scientists approach
biological questions. The ubiquity of large-scale assays that can test thousands of samples in a day
has necessitated the development of new computational approaches to interpret this data. Among
these tools, machine learning approaches are increasingly being utilized due to their ability to
infer complex nonlinear patterns from high-dimensional data. Despite their effectiveness, machine
learning (and in particular deep learning) approaches are not always accessible or easy to implement
for those with limited computational expertise. Here we present PARROT, a general framework for
training and applying deep learning-based predictors on large protein datasets. Using an internal
recurrent neural network architecture, PARROT is capable of tackling both classification and regres-
sion tasks while only requiring raw protein sequences as input. We showcase the potential uses
of PARROT on three diverse machine learning tasks: predicting phosphorylation sites, predicting
transcriptional activation function of peptides generated by high-throughput reporter assays, and
predicting the fibrillization propensity of amyloid beta with data generated by deep mutational scan-
ning. Through these examples, we demonstrate that PARROT is easy to use, performs comparably
to state-of-the-art computational tools, and is applicable for a wide array of biological problems.
*For correspondence:
alex.holehouse@wustl.edu
Competing interest: See page
14 Introduction
Funding: See page 14 The past decade has seen an exponential increase in the rate at which biological data is generated
(Marx, 2013). Technological advances coupled with the falling costs of DNA synthesis and sequencing
Received: 21 May 2021
Preprinted: 23 May 2021 have made conducting high-throughput experiments accessible to most research labs (Hughes and
Accepted: 06 September 2021 Ellington, 2017). The affordability of being able to sequence massive quantities of DNA is trans-
Published: 17 September 2021 forming how molecular biologists approach research. Protein functional assays and screens are seeing
increasing library sizes, which allows researchers to investigate many different sequences and variants
Reviewing Editor: Volker
in a single experiment. In recently published studies, it is not uncommon to find deep mutational
Dötsch, Goethe University,
scanning (DMS) experiments that achieve nearly complete sequence coverage or assays that test tens
Germany
of thousands of peptides (Arnold et al., 2018; Bolognesi et al., 2019; Erijman et al., 2020; Jones
Copyright Griffith and et al., 2020; Livesey and Marsh, 2020; Seuma et al., 2021; Sanborn et al., 2021; Schmiedel and
Holehouse. This article is
Lehner, 2019). This abundance of data being generated has the potential to answer important biolog-
distributed under the terms
ical questions; however, at the same time, it also significantly complicates experimental analysis.
of the Creative Commons
Attribution License, which
Coinciding with the explosion of high-throughput omics experiments has been the development
permits unrestricted use and of computational methods for analyzing the resulting high-dimensional biological data. In partic-
redistribution provided that the ular, machine learning approaches have emerged as popular strategies in a wide range of biological
original author and source are applications (Xu and Jackson, 2019; Eraslan, 2019; Moses, 2017). In general, machine learning
credited. approaches are effective at identifying patterns in complex datasets and extrapolating these learned
Griffith, and Holehouse. eLife 2021;10:e70576. DOI: https://doi.org/10.7554/eLife.70576 1 of 17
Tools and resources Computational and Systems Biology
patterns to make predictions on previously untested samples. Deep learning approaches, as opposed
to ‘shallow’ machine learning approaches, such as logistic regression, are particularly well-suited for
biological applications as they can implicitly capture relevant features in order to model complex,
nonlinear, biological relationships (Min et al., 2017; Raimondi et al., 2019; Xu et al., 2020). In
the context of protein datasets, deep learning approaches offer the attractive quality of allowing
researchers to simply input raw protein sequences into the model, rather than requiring an interme-
diate step where proteins are reduced into simplified representations (e.g., amino acid content or
biophysical properties; Raimondi et al., 2019).
However, despite their advantages over simpler models, deep learning approaches are still a rela-
tively specialized form of data analysis. As a result, in many domains of biological sciences, there
remains a technical and conceptual barrier for labs to apply deep learning approaches to their data. In
some cases, this could be reasonably attributed to preference for more interpretable simple models,
rather than more accurate, but often cryptic, deep learning models (Rudin, 2019; Murdoch et al.,
2019). In other cases, this lack of adoption could be due to a general unfamiliarity and inexperience
with deep learning. Indeed, the field of deep learning can appear daunting for those without exten-
sive computational backgrounds. For an untrained scientist with amenable high-throughput data-
sets, it may be infeasible or too time-consuming to implement deep learning models into an analysis
workflow.
Here, we aim to make cutting-edge deep learning accessible to a broad audience of biological
researchers through our package PARROT (Protein Analysis using RecuRrent neural networks On
Training data). PARROT is designed to be a general framework for training machine learning networks
on large protein datasets, then using the trained network to make predictions on new protein
sequences. The user side of PARROT is an easy-to-use command line tool that is flexible enough to
handle a variety of data formats and machine learning tasks. In its implementation, PARROT carries out
the computational heavy lifting through implementation of a recurrent neural network (RNN). RNNs
are a class of deep learning architecture originally designed for language processing applications, but
have since been employed with remarkable success in biology (Rumelhart et al., 1986; Lipton et al.,
2021; Hanson et al., 2017; Heffernan et al., 2017; Almagro Armenteros et al., 2017; Li et al.,
2017; Angermueller et al., 2017; Alley et al., 2019). Compared to other deep learning approaches,
RNNs are unique in that they are designed to handle variable length sequences, which makes them
well-suited for applications involving proteins. Using only raw protein sequences as input, RNNs can
learn the relevant positional dependencies of amino acids needed to associate each sequence with
a corresponding functional value or values. Through this architecture, PARROT is able to capture
intrinsic patterns in large protein datasets in order to construct highly accurate predictive models.
In this paper, we introduce the underlying RNN architecture of PARROT and demonstrate its appli-
cation to three different biological problems. First, we show that PARROT performs at a near state-
of-the-art level on phosphorylation site prediction tasks, a well-characterized bioinformatics problem.
Second, we use PARROT to train a predictor of transcriptional activation activity using the exten-
sive peptide library from Erijman et al., 2020. Third, we demonstrate how PARROT can be used in
conjunction with DMS assays, using the amyloid beta-based dataset from Seuma et al., 2021. Ulti-
mately, we show that PARROT is an effective, generalizable, and easy-to-use machine learning tool
that is applicable to a range of different protein datasets.
Results
PARROT is a general RNN framework
Our motivation behind PARROT was to develop a powerful deep learning tool that is easy to imple-
ment into any large-scale protein analysis workflows (>1000s of sequences; Figure 1A). The general
workflow involves the following steps. A user starts with a set of sequences of interest where each
sequence (or each residue in each sequence) has some label associated with it, either a discrete class
or a continuous value. PARROT uses this initial dataset to train, validate, and test a deep learning
model. Training, validation, and testing are all performed automatically within PARROT using standard
best practices for machine learning model generation. Once a model is built, the user can use that
model to make predictions on new sequences for which there is no data associated.
Griffith, and Holehouse. eLife 2021;10:e70576. DOI: https://doi.org/10.7554/eLife.70576 2 of 17Tools and resources Computational and Systems Biology
(A)
(B) (C)
Sequence Residues
e.g. Protein classification e.g. Secondary structure classification
seq1 MENTF 0 seq1 MENTF 0 0 0 1 1
Classification
seq2 SQTRKA 1 seq2 SQTRKA 1 1 0 1 1 1
seq3 TKKG 0 seq3 TKKG 0 0 0 0
seq4 YSPRP 2 seq4 YSPRP 1 1 1 0 0
seq5 GSGSA 1 seq5 GSGSA 1 0 0 1 1
seq6 PQQNDP 2 seq6 PQQNDP 0 0 0 1 0 1
e.g. Functional assay score e.g. Disorder prediction
seq1 MENTF 0.61 seq1 MENTF 0.2 0.8 0.1 0.1 0.4
Regression
seq2 SQTRKA 1.93 seq2 SQTRKA 1.0 0.9 0.6 0.2 0.1 0.5
seq3 TKKG 2.25 seq3 TKKG 0.4 0.5 0.4 0.6
seq4 YSPRP 1.96 seq4 YSPRP 0.2 0.9 1.0 0.3 0.4
seq5 GSGSA 0.12 seq5 GSGSA 0.7 0.5 0.2 0.5 0.6
seq6 PQQNDP 2.10 seq6 PQQNDP 0.0 0.1 0.2 0.0 0.1 0.5
Figure 1. PARROT overview. (A) A standard workflow that incorporates PARROT. Quantitative protein data is either obtained computationally or
generated through experiment, then formatted such that each protein sequence or residue is linked to a particular value. PARROT allows users to train
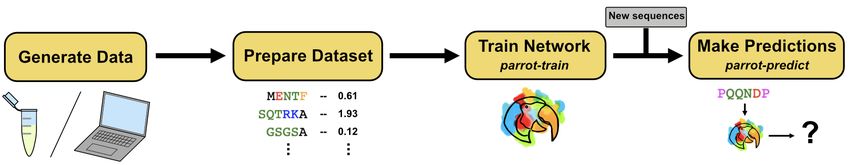
a predictor on this dataset. The trained network can then be applied on new sequences to make predictions. (B) The internal architecture of PARROT
is a bidirectional long short-term memory (LSTM) network. (Top) Series of cells propagate information along the length of a protein sequence in both
N-to-C and C-to-N directions and the final output is integrated from the deepest layers in each direction. (Bottom) A diagram of the LSTM cells used in
PARROT. (C) Example data formats for the four kinds of machine learning problems PARROT can carry out on proteins: classification or regression tasks
using per-sequence or per-residue output.
We used the PyTorch platform to implement the core RNN framework of PARROT (Paszke, 2021).
The serialized architecture of RNNs and their ability to handle variable length inputs makes them well-
suited for learning information from protein sequences. In the context of protein analysis, each cell in
an RNN integrates information from a particular amino acid with the output (‘hidden state vector’) of
the preceding cell in the network. However, there are two main drawbacks of using the standard RNN
architecture for protein analysis. First, standard RNNs require that information is propagated through
the network in a single direction, which imposes an arbitrary constraint on the ability of a network
to learn from protein sequences. Second, standard RNNs are susceptible to the ‘vanishing gradient
problem,’ which arises due to the multiplication of many small values and can limit the ability of a
network to learn long-range dependencies in the data (Bengio et al., 1994). PARROT implements two
common variants of RNN architecture in order to mitigate these factors (Figure 1B). To address the
first, the RNN implementation of PARROT is bidirectional, such that there are two parallel RNNs that
propagate information from the protein sequence in opposite directions (N-to-C and C-to-N) simulta-
neously (Schuster and Paliwal, 1997). To address the issue of vanishing gradients, PARROT employs
long short-term memory (LSTM) cells, which have been shown to capture long-range dependencies
in sequences more efficiently than standard RNNs (Hochreiter and Schmidhuber, 1997). Combining
bidirectionality with LSTM cells has been previously demonstrated to be effective at learning from
biological sequences (Hanson et al., 2017; Heffernan et al., 2017; Almagro Armenteros et al.,
Griffith, and Holehouse. eLife 2021;10:e70576. DOI: https://doi.org/10.7554/eLife.70576 3 of 17Tools and resources Computational and Systems Biology
2017; Li et al., 2017; Alley et al., 2019). Taken together, PARROT’s underlying network architecture
is specifically optimized for working with protein datasets.
PARROT was designed to conceal the inner workings of this RNN, such that only a limited set of
information is required from the user. For the most basic usage, the user only needs to provide their
data and specify the kind of machine learning task for which they are training the network (classifica-
tion or regression, described below). User datasets are input as basic whitespace-delimited text files
with each protein sequence and its corresponding data contained on a single line. This file can be
prepared in any spreadsheet program (e.g., Excel) and saved as a tab-separated variable file. More
detailed instructions for file preparation are provided in the PARROT documentation. One of the
consequences of PARROT’s internal RNN is that the provided input sequences are not required to
be the same length. Before training a PARROT network, users must specify whether their application
qualifies as a classification or regression task. In classification tasks, the network is trained to assign
discrete class labels to each input. For example, if one had a set of proteins where each protein
localized to a specific organelle, this would lend itself to a classification task for predicting subcellular
localization. For regression, the network outputs a continuous, real-number value for each input. For
example, if one had a set of peptides where each sequence had an aggregation score between 0
and 1, this would lend itself to a regression task for predicting quantitative peptide aggregation. In
addition to these two categories, users must also specify whether they want the PARROT network to
produce per-sequence or per-residue output. Example data formats for each of these four categories
are depicted in Figure 1C. Beyond this core usage, advanced users may optionally specify network
hyperparameters such as the number of layers in the network, size of the hidden state vectors, learning
rate, batch size, number of training epochs, and various other optional arguments (see Materials and
methods).
In the remaining sections, we demonstrate the effectiveness of PARROT in the context of three
distinct protein applications. Our goal here is to illustrate the diverse types of biological questions
PARROT is capable of interrogating and to inspire readers to apply PARROT in their own research.
PARROT predicts phosphosites on par with established methods
We first benchmarked the performance of PARROT-derived networks on a commonly studied bioin-
formatics task: predicting phosphorylation sites in a protein sequence. We used the Phospho.
ELM (P.ELM) version 9.0 (Diella et al., 2007) and PhosPhAt (PPA) version 3.0 (Heazlewood et al.,
2008; Durek et al., 2010) datasets for training and independent validation, similar to Dou et al.,
2014. P.ELM consists of literature-derived animal phosphorylation sites, and PPA consists of mass
spectrometry-validated phosphosites in Arabidopsis thaliana. For both of these datasets, we extracted
all 19-residue windows centered around serine, threonine, and tyrosine and divided each of these
into phosphorylation-positive and -negative sets. After filtering out similar sequences with CD-HIT
(Fu et al., 2012), we then downsampled the larger phosphorylation-negative sets in order to create
balanced datasets with identical numbers of phosphorylation-positive and phosphorylation-negative
windows. Separate PARROT networks were trained on the serine, threonine, and tyrosine windows
from the P.ELM dataset (Figure 2A).
We first tested our PARROT phosphosite predictors for each of the three residues on the P.ELM
dataset using 10-fold cross-validation. This involved randomly splitting each residue-specific dataset
into 10 even subsets, then training on 9/10 of the data and testing on the held out 1/10 for each of
the subsets. As a benchmark, we compared the performance of our PARROT networks against three
established phosphosite predictors, PhosphoSVM, MusiteDeep, and PHOSFER, which each rely upon
different methodologies (Dou et al., 2014; Trost and Kusalik, 2013; Wang et al., 2017). As this was a
binary classification problem, we focused our analysis on sensitivity, specificity, and Matthew’s correla-
tion coefficient (MCC) as performance metrics. We chose MCC as a performance metric because it has
been shown to be more informative for binary classification tasks than the more commonly used F1
score or accuracy (Chicco and Jurman, 2020). Overall, the PARROT networks performed better than
PhosphoSVM, and at a comparable level to PHOSFER and MusiteDeep (Figure 2B, Supplementary
file 1). Interestingly, there was variation in the relative performance of the top three methods across
the three residue types, with PARROT performing best on pSer, second best on pThr, and third best
on pTyr. This performance trend corresponds with the size of the training dataset available for each
residue. The P.ELM cross-validation analysis also illuminated particular biases in each of the predictors.
Griffith, and Holehouse. eLife 2021;10:e70576. DOI: https://doi.org/10.7554/eLife.70576 4 of 17Tools and resources Computational and Systems Biology
(A) Extract Train
annotated Get all S/T/Y Predict new
PARROT
sequences windows sequences
predictor
GAKVGYHAGEWAGAE GAKVGYHAGEWAGAE
AEALESFQLFAP
ALESFQLFAPTHNKGR ALESFQLFAPTHNKGR ?
LTPGGSAVADD
DGYFPHFDLTHGAQVK DGVFPHFDLTHGAQVK KKDALSNAVAH
GHGKKDALSNAVAHVR GHGKKDALSNAVAHVR
(B)
(C)
(D)
Serine Threonine Tyrosine
Figure 2. PARROT’s performance on a phosphosite prediction task. (A) Workflow for training PARROT networks for phosphosite prediction. Full-length,
annotated sequences from the Phospho.ELM (P.ELM) dataset were split into phospho-positive and phospho-negative 19aa windows (11aa windows
used in figure for clarity). PARROT predictors trained on these sequence windows and were used to make predictions on held out sequences and
the PhosPhAt (PPA) dataset. (B) Matthew’s correlation coefficient (MCC), (C) sensitivity (D), and specificity scores for the PARROT predictors and three
external predictors on the task of phosphosite prediction on the P.ELM and PPA datasets.
Notably, PHOSFER and MusiteDeep tended to predict with high sensitivity and low specificity, Phos-
phoSVM predicted with low sensitivity and high specificity (Figure 2C and D). However, PARROT’s
predictions tended to be the most balanced, with comparable sensitivity and specificity across the
three different residue types.
Overfitting to training data is a common problem in the field of machine learning, so to test for
this we assessed the performance of our PARROT predictors on an independent test dataset. For
each of the three residue types, we trained a PARROT predictor on the full P.ELM dataset and made
predictions on Ser, Thr, and Tyr residues in the PPA dataset. Unsurprisingly, all of the PARROT predic-
tors performed worse on the PPA data than they did on the P.ELM cross-validation analysis; however,
the PARROT predictors still performed comparably or better than the three established phosphory-
lation site predictors (Figure 2B–D, Supplementary file 2). PARROT’s comparable performance to
PHOSFER on the PPA dataset is particularly notable because PHOSFER was specifically designed for
the prediction of plant phosphorylation sites (Trost and Kusalik, 2013).
Ultimately, our intention behind these analyses is not to assert that our PARROT-based predictors
are inherently superior to all other existing phosphorylation site predictors. Rather it is to demonstrate
that PARROT, despite being a general framework for any type of protein analysis, can perform equiv-
alently to methods that are specifically developed for a particular task. In doing so, we establish that
Griffith, and Holehouse. eLife 2021;10:e70576. DOI: https://doi.org/10.7554/eLife.70576 5 of 17Tools and resources Computational and Systems Biology
PARROT-trained networks perform at a high level and that PARROT can confidently be extended to
other less well-characterized protein applications.
PARROT can integrate into high-throughput experiment workflows
Having established that predictors trained with PARROT can accurately learn patterns in large data-
sets, we next focused on showcasing PARROT’s ability to integrate into a typical high-throughput
experiment workflow. To accomplish this, we turned to the data generated by Erijman et al., 2020,
in which the authors developed a high-throughput fluorescence assay for testing 30-mer peptides for
activation domain (AD) function in yeast. Their assay measured ~37,000 sequences with AD function
and ~1 million without, allowing them to train a convolutional neural network to predict AD function
from sequence and secondary structure information (ADpred). This general workflow of (1) gener-
ating massive quantities of data using a high-throughput assay and (2) developing a computational
predictor based on the assay data is becoming increasingly common in molecular biology. While
ultimately the approach taken by Erijman et al. was computationally rigorous and successful, here
we demonstrate that PARROT could readily be implemented in such a workflow without sacrificing
performance (Figure 3A). Using PARROT in cases like this could save researchers valuable time from
having to develop their own machine learning predictors from scratch.
Using 10-fold cross-validation, we trained PARROT networks on this AD dataset (see Materials
and methods) and evaluated their performance and generalizability. First, we tested how well each
of the networks predicted AD function on the held-out test set. PARROT networks predicted AD
function with an accuracy of 93.1% (standard error ±0.1%) and an area under the precision-recall
curve (AUPRC) of 0.973 (± 0.001), which were not significantly different from ADpred’s reported accu-
racy and AUPRC of 93.2% (± 0.1%) and 0.975 (± 0.001), respectively (Figure 3B). However, the
PARROT-based predictors did significantly outperform the simple logistic regression model also used
in Erijman et al., 2020, which had an accuracy of 89.1% (± 0.4%) and AUPRC of 0.942 (± 0.002).
We also assessed the generalizability of the PARROT predictors through a similar approach as in the
ADpred paper. Each cross-validation-trained network was also applied to an independent yeast AD
dataset from Staller et al., 2018. We found good correlation between our predicted AD values and
the independent data with an average Pearson’s R = 0.586 (± 0.005), which was slightly higher than
the reported performance of ADpred of R = 0.57 (Figure 3C).
To assess how the PARROT networks performed with fewer sequences to train on, we repeated
both of these analyses on reduced datasets. Sampling from the complete dataset containing 75,846
30-mer peptides (50% displaying AD function), we created new 70K , 60K , 50K , 40K , 30K , 20K ,
10K , and 5K peptide datasets. AUPRC began to plateau around 40K peptides, and generalizability
to the Staller et al. data plateaued at around 30 K, indicating that PARROT can robustly capture mean-
ingful patterns in reduced datasets (Figure 3D).
Although all of the peptides studied in this analysis were 30 residues in length, one of the benefits
of PARROT over other deep learning approaches is that it is not limited to fixed length sequences. In
theory, one could train a predictor with PARROT using the combined results from multiple indepen-
dent assays that test for similar phenotypes. As a proof of concept for this idea, we combined the
data from Erijman et al. with the results from a similar AD functional assay that tested 5–20 residue
peptides (Ravarani et al., 2018), trained new PARROT predictors on a variety of dataset sizes, and
repeated the analyses described above. We found that 10-fold cross-validation accuracy and AUPRC
slightly decreased using the combined datasets, possibly due to greater intra- dataset variance.
However, performance on the independent test dataset was not significantly different (Figure 3—
figure supplement 1). Despite the modest dip in performance for this particular case, we posit that
PARROT’s flexibility to incorporate multiple datasets while training could be useful in other contexts
where a single, comprehensive dataset is not available.
As a final set of analyses, we compared our PARROT predictor to a recently published deep
learning-based method for activation domain prediction, called PADDLE, developed by Sanborn
et al., 2021. Similar to ADpred, PADDLE is a deep convolutional neural network and was trained
on data derived from a quantitative, high-throughput assay. When applying our PARROT predictor
trained on the Erijman et al. data to the Sanborn et al. data., we obtained relatively poor predic-
tive power (Figure 3—figure supplement 2). However, since ADpred had also been shown to be
ineffective at predicting the data obtained by Sanborn et al., 2021, we suspected that PARROT’s
Griffith, and Holehouse. eLife 2021;10:e70576. DOI: https://doi.org/10.7554/eLife.70576 6 of 17Tools and resources Computational and Systems Biology
(A) Erijman et
Split AD / Train
Predict new
non-AD PARROT
al. dataset sequences sequences
predictor
# seqs
# seqs
?
GFP fluor. GFP fluor.
(B) (D)
(C)
Figure 3. PARROT predicts functional yeast activation domains. (A) Diagram of activation domain workflow. A
PARROT network was trained on the yeast fluorescence activation assay data from Erijman et al. and used to
make predictions on new protein sequences. (B) PARROT’s 10-fold cross-validation accuracy and area under the
precision-recall curve (AUPRC) on the Erijman et al. dataset compared to the reported scores for two approaches
employed in that paper: ADpred and a logistic regression based method. (C) Representative example of the
correlation between PARROT’s predictions and the true activation scores of an independent yeast activation
domain dataset. (D) PARROT’s performance on the tasks in (B) (top) and (C) (bottom) as a function of dataset size.
For each specified dataset size, the actual number of sequences used for training and validation was 90% of the
indicated value since networks were trained using 10-fold cross-validation. The dashed line is a hyperbola best-fit
line. The reported performance of ADpred is shown for reference in gray.
The online version of this article includes the following figure supplement(s) for figure 3:
Figure supplement 1. Performance of PARROT networks trained on a multi-study dataset on the activation
domain prediction task.
Figure supplement 2. Analysis of PARROT networks on the test set data of Sanborn et al.
underperformance may reflect inherent system-specific limitations in transferability between the two
datasets. To test this, we leveraged PARROT’s flexibility and trained a new predictor using the same
training data as PADDLE. This new predictor saw substantially improved performance and was able to
predict activation domain function comparably to PADDLE.
Griffith, and Holehouse. eLife 2021;10:e70576. DOI: https://doi.org/10.7554/eLife.70576 7 of 17Tools and resources Computational and Systems Biology
PARROT can complement DMS experiments
For our final analysis, we demonstrate a unique usage for PARROT in tandem with DMS experiments.
We conducted our training and testing of PARROT networks using a recent DMS dataset investi-
gating amyloid beta (Aß42), a 42-residue peptide that can form plaques implicated in Alzheimer’s
disease (Seuma et al., 2021; Findeis, 2007). In work by Seuma et al., the authors tested >450 single
and >14,000 double mutants of Aß42 in an assay that measured each variant’s propensity to nucleate
amyloid fibrils. Each of the variants they tested was assigned a log-ratio score (normalized to WT) with
positive values indicating that that variant was nucleation-prone. While this scale of this experiment
was massive, the sheer combinatorics of DMS makes it infeasible to truly capture all possible single
and double mutations for a peptide of this size in a single assay. In our analysis, we show that PARROT
can be employed to ‘fill in the gaps’ of a DMS experiment by training on the experimental variants and
applying the network to predict the experimental outcome for variants that were not directly assayed.
We first validated PARROT’s ability to predict nucleation scores from DMS data. Unlike the previous
applications, the peptides obtained from DMS experiments occupy a relatively limited region of
sequence space given that each sequence differs by only a few point mutations. It was not initially
clear to us if PARROT would be able to learn the general, underlying patterns within this more focused
dataset rather than overfitting on specific observations. To test this, we set out to rigorously evaluate
our PARROT networks by developing and applying a method of residue-wise cross-validation. For
each cross-validation fold, the held-out test set consisted of the data of all variants (single and double)
linked to a particular residue in the sequence, while the training set consisted of all other variants.
For example, during the round of cross-validation for the fourth position of Aß42 (Phe-4), variants like
F4G, F4S, F4S-H13N, etc., would be excluded from the training data and held in the test set. While
this approach to training might seem excessive, it avoids the issue of overfitting that would arise using
conventional cross-validation training. For example, if we were to naively divide our DMS data into
10 random subsets, we could have cases where the training set consists of double mutants like F4S-
H13N and F4S-V36M while the single mutant F4S is in the held-out test set. In this kind of situation,
our predictions would be more accurate, but this would be improperly overestimating PARROT’s
performance.
Using residue-wise cross-validation, we trained and tested PARROT networks for all 42 posi-
tions of Aß42, taking the average predictions of double mutants since they were represented in the
two separate test sets. Across all of the single and double mutants in the dataset, we see good
correlation between PARROT’s predictions and the true assay scores (R2 = 0.593; Figure 4B). To
provide context for this value, between multiple biological replicates of the DMS experiments an
R2 of 0.72 was obtained, indicating to us that PARROT is effectively capturing much of the variation
between sequences that are not due to biological noise (Seuma et al., 2021). Within our entire set
of predictions, the correlation was tighter among the double mutants in the dataset than the single
mutants, likely due to the limited information that PARROT sees for the single mutants during training
(Figure 4—figure supplement 1).
We next sought to see if the PARROT networks could capture epistatic relationships between Aß42
residues in the set of double mutants. In assays that measure complex phenotypes such as the nucle-
ation of amyloid fibrils, it is not clear a priori if independent mutations will work synergistically or antag-
onistically when combined. For this analysis, we were interested in how well PARROT could predict
the impact of double mutations in the DMS dataset relative to simpler estimations, such as summing
the assay score of the two single mutations. Looking at only the double mutants in our dataset for
which both point mutations were represented in the set of single mutants, we found that PARROT’s
predictions significantly outperformed this simple summing approach (pTools and resources Computational and Systems Biology
(A) Seuma et Split variants Train
Predict new
al. dataset by mutation PARROT
sequences
position predictor
1 42
AB42 DAEFR VIA
# variants
Nucl. score
R2 = ?
Nucl. score
(B) (D)
(C)
Figure 4. PARROT can ‘fill in the gaps’ of deep mutational scanning experiments. (A) Depiction of the residue-wise
cross-validation workflow for predicting fibril nucleation scores using the Aß42 deep mutational scanning (DMS)
assay from Seuma et al. (B) Correlation between the true assay scores and predictions made by PARROT networks
trained using residue-wise cross-validation for >14,000 single and double mutant variants. (C) Measurement of
epistasis within the nucleation assay. (Left) Correlation between the nucleation scores of double mutants and the
sum of nucleation scores of their composite single mutants. (Right) Correlation between the same double mutant
nucleation scores and the predictions made by PARROT. (D) Receiver operator characteristic (ROC) curves for 12
familial Alzheimer’s disease (fAD) mutants versus all other single mutant variants in the dataset. Area under the
curve (AUC) values are reported in the legend.
The online version of this article includes the following figure supplement(s) for figure 4:
Figure supplement 1. Related to Figure 4B, correlation between Aß42 nucleation scores and PARROT
predictions divided into (A) single mutants and (B) double mutants.
Figure supplement 2. Related to Figure 4C, measured epistasis between Aß42 double mutant nucleation scores
and the average (top), maximum (middle), and minimum (bottom) of their composite single mutant scores.
in the protein sequence, we reasoned that PARROT might be an effective tool for making predictions
on the mutants not covered by the assay. To test this idea, we assessed how effectively PARROT prior-
itized a set of 12 Aß42 variants linked to familial Alzheimer’s disease (fAD) within the entire collection
of single mutants. This analysis was analogous to what was performed by Seuma and colleagues in
Griffith, and Holehouse. eLife 2021;10:e70576. DOI: https://doi.org/10.7554/eLife.70576 9 of 17Tools and resources Computational and Systems Biology
the original DMS study (Seuma et al., 2021). In addition to the predictions made by our residue-wise
cross-validation networks (PARROT_ResCV), we trained an additional network using PARROT on the
entire DMS dataset minus the 12 fAD-linked single mutants and all double mutants containing one or
both of these mutations (PARROT_nofAD). We calculated area under the ROC curve (AUROC) to eval-
uate the predictions of these PARROT networks and compared PARROT’s performance to the original
DMS assay and to TANGO (Fernandez-Escamilla et al., 2004) and CADD (Rentzsch et al., 2019),
which are computational predictors of aggregation and variant effect, respectively (Figure 4D). With
the exception of the assay’s scores (which PARROT trained on), PARROT_nofAD and PARROT_ResCV
outperformed all other predictors. In particular, the success of the PARROT_nofAD predictor demon-
strates that PARROT can effectively ‘fill in the gaps’ of DMS experiments and help prioritize candidate
variants for follow-up study. Essentially, researchers can use PARROT to construct their own variant
effect predictor that is specific to their assay and protein of interest.
Discussion
When designing PARROT, we set out to develop a machine learning tool that effectively extracts
patterns from protein sequence data, is generalizable to a wide array of regression and classification
tasks, and is easy to use. There are a number of tools in recent years that satisfy some of these criteria,
but not all three. For instance, deep learning-based predictors are becoming widely used in protein
analysis, but these implementations tend to be designed for a single specific application rather than
general use (Heffernan et al., 2017; Almagro Armenteros et al., 2017; Alipanahi et al., 2015).
Although general protein analysis tools do exist, these typically implement simpler techniques like
linear or logistic regression, support vector machines or decision trees, and are not necessarily able
to identify complex, nonlinear patterns in datasets (Brandes et al., 2016; Liu, 2019). Meanwhile,
open-source software packages like PyTorch, Keras, and TensorFlow make general deep learning
frameworks freely available, but implementing these requires significant computational expertise and
time investment. PARROT offers a freely available deep learning tool that satisfies all three of these
criteria. By creating a tool that is sufficiently flexible, straightforward, and computationally rigorous,
we aim to make the advantages of deep learning accessible to all biologists.
Importantly, we have demonstrated that predictors built using PARROT perform comparably to
existing machine learning predictors across multiple contexts. In the case of phosphorylation site
prediction, PHOSFER, PhosphoSVM, and MusiteDeep have all been specifically designed for this
task, while PARROT was not. Nonetheless, PARROT still predicts phosphorylation sites approximately
equivalently to each of these methods. Likewise, PARROT also performs comparably to both ADpred
and PADDLE after training on the same dataset as either of these predictors. In our analysis of Aß42,
we saw that PARROT networks trained on the DMS dataset were more effective at identifying patho-
genic, fibril forming variants than computational tools like TANGO or CADD. Collectively, these results
demonstrate that PARROT’s flexibility across datasets does not come at the expense of performance.
Moreover, while there has been a previous focus on the application of deep learning to understand
folded protein stability, PARROT is demonstrably well-suited for working with intrinsically disordered
protein sequences (Alley et al., 2019; Cao et al., 2019; Hoie et al., 2021; Lindorff-Larsen and
Kragelund, 2021).
The three specific applications we used to showcase PARROT outline broader use cases in which
it can be effective. For starters, PARROT can be used to create predictors from existing bioinformatic
datasets; for example, we trained networks to predict phosphosites using the existing P.ELM dataset.
Second, PARROT can easily be incorporated into the workflows of high-throughput protein experi-
ments, as shown with the yeast activation domain predictor we created from Erijman et al.’s fluores-
cence assay data. DMS experiments are a special subset of this kind of usage. Our third example
demonstrated how PARROT can train on DMS data and extrapolate predictions on variants that were
not experimentally tested. In all three cases, PARROT can save researchers valuable time by elimi-
nating the need to develop machine learning predictors de novo.
Beyond these applications, there are several other features built into PARROT that may increase its
appeal to a wider scientific audience. Trained PARROT networks are fully portable into Python, which
allows them to be easily integrated into stand-alone software tools, entirely independent of PARROT.
As an example, we recently used PARROT to train a predictor of per-residue intrinsic disorder or
predicted structure that offers a number of advantages in terms of performance and ease of use
Griffith, and Holehouse. eLife 2021;10:e70576. DOI: https://doi.org/10.7554/eLife.70576 10 of 17Tools and resources Computational and Systems Biology
compared to the state of the art (Emenecker et al., 2021). Additionally, while PARROT uses one-hot
encoding to transform amino acid sequences into machine-readable numeric vectors by default, it can
readily adopt other user-specified encoding schemes such as describing amino acids by their biophys-
ical properties. As a consequence of this fact, PARROT is not specific to the canonical amino acid
alphabet and can even be applied to nucleotide sequences. All of these features, and much more, are
described in detail in the PARROT documentation.
As a final point, we would like to emphasize to prospective users of PARROT, or any similar tool,
that predictions made by machine learning models should be interpreted with caution. Although deep
learning methods are powerful at detecting patterns in data, this power also comes with increased
susceptibility to overfitting and biased datasets. Proper data processing, not specific model archi-
tecture, is arguably the most critical factor for ensuring that deep learning is utilized accurately and
meaningfully. While deep learning-based predictions can be instrumental in generating follow-up
candidates and developing hypotheses, it is important to remember that these predictions do not
replace the need for direct experimental validation.
Materials and methods
LSTM implementation
PARROT’s underlying bidirectional LSTM network is implemented using the PyTorch library in Python.
Input protein sequences are converted to one-hot vectors and grouped into batches (default: 32
sequences per batch), then fed into both the first forward layer and first reverse layer of LSTM cells.
By default, PARROT networks consist of two layers of LSTM cells, though this hyperparameter can be
manually specified by the user. Information is propagated between adjacent LSTM cells and between
layers through hidden state vectors, which can also have a manually specified size (default 10). Hidden
state vectors from the final layer of LSTM cells are converted to the final output via a fully connected
linear or softmax neuron (Figure 1C). PARROT uses either a many-to-one or many-to-many architec-
ture depending on whether the machine learning task at hand involves mapping protein sequences
to single values (or class labels) or mapping each residue to a value/class label. The key implementa-
tion difference between these two architectures is in which hidden state vectors of the final layer of
LSTM cells are input into the fully connected layer. For residue mapping, the hidden state vectors of
the final forward and reverse cells at each position in the sequence are integrated into their own final
connected layer (Figure 1C, gray). In contrast for sequence mapping, only the hidden state vectors
from the final forward and final reverse cells are integrated into the fully connected layer (Figure 1C,
green). For classification tasks, the fully connected layer outputs a vector with a size corresponding to
the number of class labels. For regression tasks, this layer outputs a single value.
During training, weights in PARROT networks are updated using the Adam optimizer (Kingma
and Ba, 2014). By default, the initial learning rate is set at 0.001. Classification tasks employ a cross-
entropy loss function, while regression tasks use L1 and L2 loss functions for sequence mapping and
residue mapping tasks, respectively. PARROT splits input datasets 70-15-15 into training, validation,
and testing datasets by default; however, these proportions can be manually specified via the ‘--set-
fractions’ argument. The validation set is not trained on, but used to assess network performance
after each epoch of training. The test set is completely held out until after training has concluded in
order to give an estimate for how generalizable the trained network is on unseen data. Approximate
training times for different hyperparameters and dataset sizes are listed in Supplementary file 3.
Further implementation details and information on additional run-time arguments can be found in the
PARROT documentation.
Evaluation metrics
In binary classification problems, each prediction falls into one of four cases: true positive (TP), false
positive (FP), true negative (TN), and false negative (FN). We compared our PARROT networks to
other predictors using a variety of performance metrics that describe distribution of predictions across
each of these categories. These metrics are calculated in the following ways:
TP + FP
Accuracy = TP + FP + TN + FN (1)
Griffith, and Holehouse. eLife 2021;10:e70576. DOI: https://doi.org/10.7554/eLife.70576 11 of 17Tools and resources Computational and Systems Biology
TP
Sensitivity = TP + FN (2)
TN
Specificity = TN + FP (3)
TP
Precision = TP + FP (4)
TP
F1 Score = ( )
TP + 0.5 ∗ FN + FP (5)
TP ∗ TN − FP ∗ FN
MCC = √( )( )( )( )
TP + FP TP + FN TN + FP TN + FN (6)
Alternatively, performance on classification tasks can be evaluated using precision-recall or receiver
operator characteristic (ROC) curves. Instead of assigning each predicted sequence a discrete class
label, sequences are assigned a continuous real number value corresponding to the confidence that
it belongs to a particular class. We generated these non-discrete predictions using the optional
‘--probabilistic-classification’ command-line argument and calculated AUPRC and AUROC using the
Python package scikit-learn (Pedregosa et al., 2011).
Phosphosite prediction
The same P.ELM and PPA datasets were used as by Dou et al., 2014, each split into separate
phospho-serine, -threonine, and -tyrosine subsets. Initially, sequences with >30% similarity within
each subset were removed using CD-HIT with default arguments (Fu et al., 2012). We next extracted
all 19-residue windows centered around all serine, threonine, and tyrosine residues in each of the
respective datasets, dividing these into phosphorylation-positive and phosphorylation-negative sets.
A subsequent round of filtering was performed and sequences within these subsets with >20% simi-
larity were removed. We then randomly downsampled the phosphorylation-negative sequences so
that their number equaled the phosphorylation-positives and merged the two datasets into a single
file for training by PARROT.
Our analysis proceeded by training and evaluating the networks on the P.ELM dataset using 10-fold
cross-validation. The pSer, pThr, and pTyr datasets were each split randomly into 10 equal subsets.
The PARROT script parrot-cvsplit facilitates this process of splitting a dataset into cross-validation
subsets. Using the ‘--split’ flag, PARROT networks were subsequently trained on nine of these sets
and the resulting network made predictions for the sequences in the held out test set. These networks
were trained using the following arguments: two hidden layers; hidden vector size of 10; learning
rate of 0.0001; batch size of 64; 500 training epochs. The reported performance metrics in Figure 2
and Supplementary files 1 and 2 denote the average scores across the 10 cross-validation test sets.
Predictions were also made by PHOSFER and MusiteDeep through their online web server on each
of the cross-validation test sets and performance metrics were averaged. However, we opted not to
test PhosphoSVM in this manner since this predictor was originally trained on the same P.ELM data
and we wanted to avoid overfitting. Instead, we report the performance metrics taken directly from
Dou et al. since these were calculated using a similar strategy of 10-fold cross-validation on the P.ELM
dataset (Dou et al., 2014).
Using the same training arguments, additional networks were trained on the full P.ELM dataset
(separately for pSer, pThr, and pTyr) and used to make predictions on the PPA dataset. Predictions
were also made by PHOSFER, MusiteDeep on the same PPA data, and performance metrics were
calculated for each of these sets of predictions. As with the P.ELM data, the performance metrics of
PhosphoSVM on the PPA data were taken directly from Dou et al.
Activation domain function prediction
The quantitative fluorescence assay data of Erijman et al. was collected and processed in a manner
identical to its source paper (Erijman et al., 2020). Briefly, each 30-mer was assigned a real number
score based on its distribution of reads across four fluorescence expression bins. These sequences
were split into AD-positive and AD-negative sets and the negative set was sampled such that there
were equal numbers of positive and negative sequences in the final dataset. This sampling process
was repeated five times for the ‘full’ dataset (75,846 sequences), as well as for each of the reduced
datasets (70K sequences, 60K sequences, etc.) in order to generate additional replicates.
Each dataset was split randomly into 10 cross-validation subsets, and PARROT networks were
subsequently trained on nine and tested on the held-out subset. PARROT networks were trained
Griffith, and Holehouse. eLife 2021;10:e70576. DOI: https://doi.org/10.7554/eLife.70576 12 of 17Tools and resources Computational and Systems Biology
using the following hyperparameters: two hidden layers; hidden vector size of 10; learning rate of
0.0005; batch size of 64; 300 training epochs. Although our input data was set up as a classification
task, by using the ‘--probabilistic-classification’ argument, all of our predictions were output as real
numbers between 0 and 1, which allowed us to conduct precision-recall curve analysis. In addition to
assessing the performance on the held-out test set, each network was also used to make predictions
on an independent dataset. This independent dataset was obtained from a similar yeast AD quantita-
tive fluorescence assay from Staller et al., 2018. We calculated the normalized expression value for
each sequence in this dataset by dividing the raw AD activity (GFP) by the protein expression level
(mCherry), and log-normalizing the data around the WT sequence. The performance metrics reported
in Figure 3 are the averages of 50 total replicates (five replicate datasets with 10-fold cross-validation
for each).
We also created a combined training dataset using the results from a similar AD functional assay
in Ravarani et al., 2018. We extracted all sequences from this assay that were at least five residues in
length and split into positive and negative sets as described using a cutoff of –0.14. These AD-positive
and -negative sequences were then merged with the full Erijman et al. dataset, and PARROT networks
were trained and evaluated in the same manner as before.
To perform comparisons against PADDLE (Sanborn et al., 2021), we extracted the activation assay
data from Sanborn et al. and split into training and test sets as specified by the ‘PADDLE split’ column.
A PARROT regressive model was trained on the full training set using the following hyperparameters:
two hidden layers; hidden vector size of twenty; learning rate of 0.001; batch size of 64; 300 training
epochs. Predictions were made on all of the test set sequences with this new network, as well as with
the PARROT predictor that trained on the Erijman et al. data. Sequences in the test set that belonged
to the transcription factor tiling, scramble mutant, and Pdr1 variant subsets were split and graphed
separately.
Aß42 nucleation prediction
Data linking Aß42 nucleation propensity to sequence was obtained from Seuma et al., 2021. Each
single or double mutant variant was assigned a log-normalized (relative to WT) score with positive
values reflecting that a variant is more prone to nucleating amyloid fibrils. For simplicity, we removed
all nonsense variants from the dataset prior to training. The remaining variants were split into 42
different training-test set pairs, based on the position of the mutation(s) in that variant. Each test set
contained all variants with mutations associated with a single residue, while the training sets consisted
of all remaining variants. Accordingly, each double mutant was withheld in two separate test sets.
Individual PARROT networks were trained on each of these unique training sets and the resulting
network was used to make predictions on the corresponding test set. Networks were trained using
the following hyperparameters: 3 hidden layers, hidden vector of size 8; learning rate of 0.0005; batch
size of 64; and 250 training epochs. Predictions from the 42 test sets were combined, averaged (in the
case of double mutants), and then analyzed.
We assessed the ability of PARROT to detect ‘epistasis’ by comparing the network’s prediction
of double mutants to simpler approaches that estimated mutant effect by integrating nucleation
scores of the associative single mutations. We determined statistical significance between correla-
tions derived from these different approaches through bootstrapping. All data points were resampled
with replacement 10,000 times, calculating Pearson’s R for each iteration, and the 99% confidence
intervals were used as a threshold for significance (pTools and resources Computational and Systems Biology
these analyses, but can be used to automatically select network hyperparameters through Gaussian
process optimization. parrot-cvsplit allows users to automatically split their datasets into k-folds for
cross-validation. More details can be found in the PARROT documentation: https://idptools-parrot.
readthedocs.io/. PARROT is optimized to run in a Mac or Linux environment, but can also work using
Windows.
Acknowledgements
We thank the members of the Holehouse lab for helpful discussions and feedback. Special thanks
to Shubhanjali Minhas for designing the PARROT logo. Funding for this work was provided by the
National Science Foundation grant number DGE-2139839 and the Longer Life Foundation (an RGA/
Washington University collaboration).
Additional information
Competing interests
Alex S Holehouse: is a scientific consultant with Dewpoint Therapeutics. The other author declares
that no competing interests exist.
Funding
Funder Grant reference number Author
National Science DGE-2139839 Daniel Griffith
Foundation
Longer Life Foundation Alex S Holehouse
The funders had no role in study design, data collection and interpretation, or the
decision to submit the work for publication.
Author contributions
Daniel Griffith, Conceptualization, Data curation, Formal analysis, Investigation, Methodology, Soft-
ware, Visualization, Writing – original draft, Writing – review and editing; Alex S Holehouse, Concep-
tualization, Funding acquisition, Investigation, Methodology, Software, Supervision, Writing – original
draft, Writing – review and editing
Author ORCIDs
Daniel Griffith http://orcid.org/0000-0002-9633-9601
Alex S Holehouse http://orcid.org/0000-0002-4155-5729
Decision letter and Author response
Decision letter https://doi.org/10.7554/70576.sa1
Author response https://doi.org/10.7554/70576.sa2
Additional files
Supplementary files
• Supplementary file 1. Complete table of performance metrics for phosphosite predictions on the
Phospho.ELM (P.ELM) dataset. Standard error, whenever possible, is reported in parentheses.
• Supplementary file 2. Complete table of performance metrics for phosphosite predictions on the
PhosPhAt (PPA) datasets. Standard error, whenever possible, is reported in parentheses.
• Supplementary file 3. Average PARROT network training times on different sizes of datasets and
with variable hyperparameters. Datasets were created by assigning random values in [–5, 5] to
randomly generated protein sequences ~25–35 residues in length. Networks were trained using
a NVIDIA TU116 GPU. Three replicate PARROT networks were trained for each specified set of
hyperparameters and dataset.
• Transparent reporting form
Griffith, and Holehouse. eLife 2021;10:e70576. DOI: https://doi.org/10.7554/eLife.70576 14 of 17Tools and resources Computational and Systems Biology
Data availability
All code is fully open source and available here: https://github.com/idptools/parrot. Documenta-
tion is available here: https://idptools-parrot.readthedocs.io/. Additional supporting data available
here: https://github.com/holehouse-lab/supportingdata/tree/master/2021/griffith_parrot_2021 (copy
archived at https://archive.softwareheritage.org/swh:1:rev:4bb48369891dc4416b6b176046846091
d8cd9ddb). PhosPhat was taken from http://phosphat.uni-hohenheim.de (specifically P hosphat_
20200624.csv), while data for PhosphoElm where taken from http://phospho.elm.eu.org/. In both
cases the entire dataset available at the time of analysis was used.
References
Alipanahi B, Delong A, Weirauch MT, Frey BJ. 2015. Predicting the sequence specificities of DNA- and RNA-
binding proteins by deep learning. Nature Biotechnology 33: 831–838. DOI: https://doi.org/10.1038/nbt.3300,
PMID: 26213851
Alley EC, Khimulya G, Biswas S, AlQuraishi M, Church GM. 2019. Unified rational protein engineering with
sequence-based deep representation learning. Nature Methods 16: 1315–1322. DOI: https://doi.org/10.1038/
s41592-019-0598-1, PMID: 31636460
Almagro Armenteros JJ, Sønderby CK, Sønderby SK, Nielsen H, Winther O. 2017. DeepLoc: prediction of
protein subcellular localization using deep learning. Bioinformatics 33: 3387–3395. DOI: https://doi.org/10.
1093/bioinformatics/btx431, PMID: 29036616
Angermueller C, Lee HJ, Reik W, Stegle O. 2017. DeepCpG: accurate prediction of single-cell DNA methylation
states using deep learning. Genome Biology 18: 67. DOI: https://doi.org/10.1186/s13059-017-1189-z, PMID:
28395661
Arnold CD, Nemčko F, Woodfin AR, Wienerroither S, Vlasova A, Schleiffer A. 2018. A high‐throughput method
to identify trans‐activation domains within transcription factor sequences. The EMBO Journal 37: e98896. DOI:
https://doi.org/10.15252/embj.201798896, PMID: 30006452
Bengio Y, Simard P, Frasconi P. 1994. Learning long-term dependencies with gradient descent is difficult. IEEE
Transactions on Neural Networks 5: 157–166. DOI: https://doi.org/10.1109/72.279181, PMID: 18267787
Bolognesi B, Faure AJ, Seuma M, Schmiedel JM, Tartaglia GG, Lehner B. 2019. The mutational landscape of a
prion-like domain. Nature Communications 10: 4162. DOI: https://doi.org/10.1038/s41467-019-12101-z, PMID:
31519910
Brandes N, Ofer D, Linial M. 2016. ASAP: a machine learning framework for local protein properties. Database
2016: baw133. DOI: https://doi.org/10.1093/database/baw133
Cao H, Wang J, He L, Qi Y, Zhang JZ. 2019. DeepDDG: Predicting the Stability Change of Protein Point
Mutations Using Neural Networks. Journal of Chemical Information and Modeling 59: 1508–1514. DOI: https://
doi.org/10.1021/acs.jcim.8b00697, PMID: 30759982
Chicco D, Jurman G. 2020. The advantages of the Matthews correlation coefficient (MCC) over F1 score and
accuracy in binary classification evaluation. BMC Genomics 21: 6. DOI: https://doi.org/10.1186/s12864-019-
6413-7, PMID: 31898477
Diella F, Gould CM, Chica C, Via A, Gibson TJ. 2007. Phospho.Elm: A database of phosphorylation sites—
update 2008. Nucleic Acids Research 36: D240–D244. DOI: https://doi.org/10.1093/nar/gkm772
Dou Y, Yao B, Zhang C. 2014. PhosphoSVM: prediction of phosphorylation sites by integrating various protein
sequence attributes with a support vector machine. Amino Acids 46: 1459–1469. DOI: https://doi.org/10.1007/
s00726-014-1711-5, PMID: 24623121
Durek P, Schmidt R, Heazlewood JL, Jones A, MacLean D, Nagel A. 2010. PhosPhAt: the Arabidopsis thaliana
phosphorylation site database. An Update. Nucleic Acids Res 38: D828-D834. DOI: https://doi.org/10.1093/
nar/gkp810, PMID: 19880383
Emenecker RJ, Griffith D, Holehouse AS. 2021. Metapredict: A Fast, Accurate, and Easy-to-Use Cross-Platform
Predictor of Consensus Disorder. bioRxiv. DOI: https://doi.org/10.1101/2021.05.30.446349
Eraslan G. 2019. Deep learning: new computational modelling techniques for genomics. Nature Reviews.
Genetics 20: 389–403. DOI: https://doi.org/10.1038/s41576-019-0122-6, PMID: 30971806
Erijman A, Kozlowski L, Sohrabi-Jahromi S, Fishburn J, Warfield L, Schreiber J. 2020. A High-Throughput Screen
for Transcription Activation Domains Reveals Their Sequence Features and Permits Prediction by Deep
Learning. Molecular Cell 78: 890–902. DOI: https://doi.org/10.1016/j.molcel.2020.04.020, PMID: 32416068
Fernandez-Escamilla AM, Rousseau F, Schymkowitz J, Serrano L. 2004. Prediction of sequence-dependent and
mutational effects on the aggregation of peptides and proteins. Nature Biotechnology 22: 1302–1306. DOI:
https://doi.org/10.1038/nbt1012, PMID: 15361882
Findeis MA. 2007. The role of amyloid beta peptide 42 in Alzheimer’s disease. Pharmacology & Therapeutics
116: 266–286. DOI: https://doi.org/10.1016/j.pharmthera.2007.06.006, PMID: 17716740
Fu L, Niu B, Zhu Z, Wu S, Li W. 2012. CD-HIT: accelerated for clustering the next-generation sequencing data.
Bioinformatics 28: 3150–3152. DOI: https://doi.org/10.1093/bioinformatics/bts565, PMID: 23060610
Hanson J, Yang Y, Paliwal K, Zhou Y. 2017. Improving protein disorder prediction by deep bidirectional long
short-term memory recurrent neural networks. Bioinformatics 33: 685–692. DOI: https://doi.org/10.1093/
bioinformatics/btw678, PMID: 28011771
Griffith, and Holehouse. eLife 2021;10:e70576. DOI: https://doi.org/10.7554/eLife.70576 15 of 17You can also read