Cloud adjustments dominate the overall negative aerosol radiative effects of biomass burning aerosols in UKESM1 climate model simulations over the ...
←
→
Page content transcription
If your browser does not render page correctly, please read the page content below
Atmos. Chem. Phys., 21, 17–33, 2021
https://doi.org/10.5194/acp-21-17-2021
© Author(s) 2021. This work is distributed under
the Creative Commons Attribution 4.0 License.

Cloud adjustments dominate the overall negative aerosol radiative
effects of biomass burning aerosols in UKESM1 climate model
simulations over the south-eastern Atlantic
Haochi Che1,a , Philip Stier1 , Hamish Gordon2,b , Duncan Watson-Parris1 , and Lucia Deaconu1
1 Atmospheric,  Oceanic and Planetary Physics, Department of Physics, University of Oxford, Oxford, OX1 3PU, UK
2 School of Earth and Environment, University of Leeds, Leeds, LS2 9JT, UK
a now at: Department of Geophysics, Tel Aviv University, Tel Aviv 69978, Israel
b now at: Engineering Research Accelerator, Carnegie Mellon University, Pittsburgh, PA 15217, USA

Correspondence: Haochi Che (haochiche@tauex.tau.ac.il)

Received: 31 May 2020 – Discussion started: 10 June 2020
Revised: 19 October 2020 – Accepted: 1 November 2020 – Published: 4 January 2021

Abstract. The south-eastern Atlantic Ocean (SEA) is semi-        the ocean, although this change is relatively small. The liq-
permanently covered by one of the most extensive stratocu-       uid water path is also significantly increased over the SEA
mulus cloud decks on the planet and experiences about one-       (mainly caused by the absorption effect of biomass burning
third of the global biomass burning emissions from the south-    aerosols) when biomass burning aerosols are above the stra-
ern Africa savannah region during the fire season. To get a      tocumulus cloud deck. The microphysical pathways lead to a
better understanding of the impact of these biomass burn-        slight increase in the liquid water path over the ocean. These
ing aerosols on clouds and the radiation balance over the        changes in cloud properties indicate the significant role of
SEA, the latest generation of the UK Earth System Model          biomass burning aerosols for clouds in this region. Among
(UKESM1) is employed. Measurements from the CLARIFY              the effects of biomass burning aerosols on the radiation bal-
and ORACLES flight campaigns are used to evaluate the            ance, the semi-direct radiative effects (rapid adjustments in-
model, demonstrating that the model has good skill in re-        duced by the radiative effects of biomass burning aerosols)
producing the biomass burning plume. To investigate the un-      have a dominant cooling impact over the SEA, which offset
derlying mechanisms in detail, the effects of biomass burn-      the warming direct radiative effect (radiative forcing from
ing aerosols on the clouds are decomposed into radiative ef-     biomass burning aerosol–radiation interactions) and lead to
fects (via absorption and scattering) and microphysical ef-      an overall net cooling radiative effect in the SEA. However,
fects (via perturbation of cloud condensation nuclei – CCN –     the magnitude and the sign of the semi-direct effects are sen-
and cloud microphysical processes). July–August means are        sitive to the relative location of biomass burning aerosols and
used to characterize aerosols, clouds, and the radiation bal-    clouds, reflecting the critical task of the accurate modelling
ance during the fire season. Results show that around 65 %       of the biomass burning plume and clouds in this region.
of CCN at 0.2 % supersaturation in the SEA can be attributed
to biomass burning. The absorption effect of biomass burn-
ing aerosols is the most significant on clouds and radiation.
Near the continent, it increases the supersaturation diagnosed   1   Introduction
by the activation scheme, while further from the continent it
reduces the altitude of the supersaturation. As a result, the    The south-eastern Atlantic Ocean (SEA) is semi-
cloud droplet number concentration responds with a similar       permanently covered by one of the most extensive
pattern to the absorption effect of biomass burning aerosols.    stratocumulus cloud decks on the planet (Wood, 2012).
The microphysical effect, however, decreases the supersat-       These clouds reflect a significant amount of solar radiation.
uration and increases the cloud droplet concentration over       Hence, even a moderate change in the cloud deck coverage

Published by Copernicus Publications on behalf of the European Geosciences Union.
18                                H. Che et al.: Cloud adjustments dominate the overall negative aerosol radiative effects

(15 %–20 % increase) or liquid water path (20 %–30 %              (Zuidema et al., 2018) and throughout the SEA from flight
increase) would produce a negative radiative effect that          measurements (Diamond et al., 2018; Kacarab et al., 2020),
could completely compensate for the radiative forcing of          confirming the interaction of BBA and clouds. These findings
greenhouse gases (Wood, 2012). From July through October,         are also supported by the possible BBA effects on chang-
the widespread biomass burning across the savannah region         ing cloud properties from satellite observations (Costantino
in southern Africa contributes about one-third of the global      and Bréon, 2010, 2013; Painemal et al., 2014). When the
biomass burning emissions (Roberts et al., 2009; van der          BBA plume enters and interacts with clouds, the microphys-
Werf et al., 2010). The emitted biomass burning aerosols          ical effect of BBA is non-negligible, as BBAs can serve
(BBAs) in southern Africa are transported over the SEA,           as CCN, become activated, and increase the cloud droplet
resulting in different impacts on the underlying stratocumu-      number concentration (CDNC), resulting in optically thicker
lus deck and radiative balance through multiple interactions      clouds of higher albedo (Twomey, 1974, 1977). However,
(Adebiyi and Zuidema, 2016; Wilcox, 2012; Wood, 2012).            some studies have found that when the LWP remains con-
   BBAs can warm the lower troposphere and modify the             stant, the increased CDNC will increase cloud-top entrain-
radiation budget as they absorb shortwave radiation. At the       ment through the fast evaporation of small droplets at the
top of atmosphere, BBA can exert either a cooling or a            cloud top, which, in return, can reduce cloud fraction and
warming shortwave direct radiative effect (radiative forcing      LWP (Wood, 2012). As a result, the BBA microphysical ef-
from BBA–radiation interactions) depending on the underly-        fect on clouds may be diminished or even cancelled out under
ing layer brightness (e.g. ocean or stratocumulus cloud deck)     some scenarios (Ackerman et al., 2004; Wood, 2007). A re-
(Chand et al., 2009; Wilcox, 2012). Despite the fact that in-     cent study found that the BBA number concentration and hy-
tensive studies have been performed (Chand et al., 2009; Lu       groscopicity played different roles in modulating the CDNC
et al., 2018; Sakaeda et al., 2011; Stier et al., 2013; Wilcox,   in clean and polluted environments (Kacarab et al., 2020),
2012), there is still no consensus on the magnitude or even       adding more uncertainty to the BBA microphysical effect.
the sign of the BBA direct radiative effect over the SEA. This    As to the BBA radiative effects, when BBAs enter clouds,
discrepancy is primarily due to the uncertainties in the under-   they can “burn off” clouds by absorbing shortwave solar ra-
lying cloud coverage (Stier et al., 2013) and the BBA spatial     diation and warming the air, with an accompanying increase
distribution; therefore, accurate modelling of the spatial and    in saturation vapour pressure (Hansen et al., 1997; Hill et
vertical distribution of the BBA plume and clouds is a critical   al., 2008; Koch and Del Genio, 2010), which can lead to
task in this area.                                                a decrease in both the cloud LWP and the cloud coverage.
   The interactions between BBA and the underlying cloud          Therefore, BBA microphysical and radiative effects can play
deck adds additional complication as BBA can alter the ther-      opposing roles for cloud physical and radiative properties,
modynamic structure of the atmosphere (through rapid ad-          creating significant uncertainties in the net effective radia-
justments induced by BBA radiative effects, i.e. semi-direct      tive forcing (change in net downward radiative flux at the top
effects) and also serve as additional cloud condensation nu-      of the atmosphere after allowing rapid adjustments) associ-
clei (CCN). The former is referred to as the BBA radiative        ated with BBA in the SEA area. Hence, it is critical to assess
effect on cloud, and the latter is the BBA microphysical ef-      the BBA effects over the SEA during the fire season using a
fect on cloud. Both effects have a significant impact on the      model that can account for all the relevant processes.
cloud liquid water path (LWP), cloud coverage, and radia-            The complex interactions between cloud microphysics, ra-
tion balance (Gordon et al., 2018; Lu et al., 2018; Wilcox,       diation, cloud entrainment processes, and, in particular, the
2010). When the BBA layer is above the cloud deck, its            small spatial scales involved make the simulation of the stra-
radiative effect can enhance the existing temperature inver-      tocumulus clouds deck in the SEA a challenge. Hence, re-
sion and therefore stability, inhibiting cloud-top entrainment.   lated process studies mainly rely on high-resolution limited-
As a consequence, boundary layer relative humidity is pre-        area models (Gordon et al., 2018; Lu et al., 2018) and ide-
served and cloud coverage maintained. This could lead to an       alized large-eddy simulations (Yamaguchi et al., 2015; Zhou
increase in LWP, optically thicker clouds, and therefore an       et al., 2017). However, ultimately it is important to represent
additional cooling semi-direct effect – potentially of com-       and constrain the related effects in general circulation mod-
parable magnitude to the warming BBA direct radiative ef-         els (GCMs) widely used to investigate climate responses to
fect, resulting in both the sign and the magnitude of the         anthropogenic perturbations, e.g. by the Intergovernmental
total BBA radiative effect remaining unclear (Deaconu et          Panel on Climate Change (IPCC). In this paper, we use the
al., 2019; Sakaeda et al., 2011; Wilcox, 2010, 2012). Pre-        UK Earth System Model (UKESM1), which is also being
vious efforts have mainly focused on the above-cloud BBA          used in the recent Coupled Model Intercomparison Project
radiative effect, as the BBA plume is generally well sepa-        Phase 6, to study the BBA effects on clouds and radiation
rated from the underlying cloud deck in experiments (Hobbs,       in the SEA. A detailed description of the model, simulation
2002; Wilcox, 2012). However, recent studies found abun-          setup, and the data we used for evaluation is in Sect. 2. The
dant biomass burning influence within the marine boundary         model is evaluated by observations in Sect. 3.1, and BBA
layer (MBL) at Ascension Island from in situ observations         effects on clouds are investigated by decomposition into ra-

Atmos. Chem. Phys., 21, 17–33, 2021                                                   https://doi.org/10.5194/acp-21-17-2021
H. Che et al.: Cloud adjustments dominate the overall negative aerosol radiative effects                                       19

diative effects (absorption and scattering) and microphysical      (noBBnoABS
                                                                          0.3   , noBBnoABS
                                                                                        0     ) (setting the imaginary part of the
effects in Sect. 3.2. The BBA radiative forcing is studied in      refractive index to zero). Radiative and microphysical effects
Sect. 3.3. Section 4 offers conclusions and a discussion.          of BBA are separated using the method by Lu et al. (2018)
                                                                   and described by the following equations.

2   Method                                                         Absorption effect = BB0 − BBnoABS
                                                                                               0                              (1)
                                                                   Scattering   effect = BBnoABS
                                                                                           0     − noBB0                      (2)
The first version of the United Kingdom Earth System
                                                                   Total effect = BB0.3 − noBB0.3                             (3)
Model, UKESM1 (Sellar et al., 2019), is the latest Earth sys-
tem model developed jointly by the UK’s Met Office and the         Microphysical effect = total effect − absorption effect
Natural Environment Research Council (NERC). The core                                    − scattering effect                  (4)
of UKESM1 is based on the Hadley Centre Global Environ-
mental Model version 3 (HadGEM3) Global Coupled (GC)                  This method allows us to decompose the effects of BBA,
climate configuration of the Unified Model (UM) (Hewitt et         with some limitations due to inherent assumptions and model
al., 2011), comprised of the UM atmosphere (Walters et al.,        structures. For example, our model only allows us to switch
2019), ocean (Storkey et al., 2018), land surface, and sea         off the absorption of BBA, not the total radiative effects.
ice components (Ridley et al., 2018; Walters et al., 2019).        This assumes that the cloud adjustment due to BBA scatter-
Aerosol and its interaction with clouds are represented by the     ing is negligible in our experiments (which excludes fast ad-
UK Chemistry and Aerosol model (UKCA) (Mulcahy et al.,             justments to corresponding surface flux changes). Also note
2020; O’Connor et al., 2014), including the modal aerosol          that the microphysical effect of BBA decomposed from our
microphysics GLOMAP (Mann et al., 2010), with five inter-          setting is mainly driven by the variation of κorg , and thus
active log-normal aerosol modes (four soluble modes from           the small fraction (around 10 %) of OC from non-biomass-
nucleation to coarse and one insoluble of Aitken mode) com-        burning emissions in this region (Fig. S1) would contribute a
prised of internally mixed sulfate, sea salt, black carbon, and    small error. Then the BBA radiative effect is further decom-
organic carbon. Mineral dust is represented separately by an       posed into direct, indirect (effective radiative forcing from
externally mixed bin representation (Woodward, 2001).              BBA–cloud interactions, defined as rapid adjustments, and
   For BBA emissions, we use the global fire assimilation          the net forcing with these adjustments from BBA–cloud in-
system (GFAS) version 1 data. GFAS is based on satellite           teractions), and semi-direct effects using the method of Ghan
fire radiative power (FRP) products and has been operating         et al. (2012) and Gordon et al. (2018). Two years are simu-
in real time under the Monitoring Atmospheric Composi-             lated in the model (2016 and 2017); however, this analysis fo-
tion and Change (MACC) project (Kaiser et al., 2012). The          cuses on July and August for consistency with the flight cam-
GFAS biomass burning emissions are scaled by 2.0 to im-            paigns. Note that although July and August can be used to
prove the agreement with observations, as suggested in the         represent BBA effects during the African fire season (July–
model configuration (Johnson et al., 2016), with scale fac-        October), this selection will also result in some uncertain-
tors commonly used for this emission inventory (Kaiser et          ties, as the BBA distribution and properties change over the
al., 2012). For other emissions, the Coupled Model Intercom-       course of the fire season, influenced in part by meteorological
parison Project Phase 6 (CMIP6) emission data during 2014          shifts, such as the strengthening of the southern African east-
are used (Eyring et al., 2016; Gidden et al., 2019).               erly jet (AEJ-S) in September and October, corresponding to
   The model is configured as Global Atmosphere 7.1                a more elevated plume (Adebiyi and Zuidema, 2016).
(GA7.1), and our simulations are run with a horizontal reso-          To evaluate the model performance, we use two flight cam-
lution of N96, i.e. 1.875◦ × 1.25◦ , and 85 vertical levels. The   paigns that took place in the SEA to compare with the base-
sea surface temperatures and sea ice are prescribed with daily     line model simulation. One is the ORACLES (Observations
reanalysis data (Reynolds et al., 2007). The model simula-         of Aerosols above Clouds and their interactions) campaign
tions are nudged every 6 h by ERA-Interim horizontal wind          (Redemann et al., 2020) including three deployments, which
fields above 1500 m (Telford et al., 2008), while the tempera-     were conducted from Namibia in 2016 and from São Tomé
ture is not nudged to allow the fast adjustments by the BBA,       in 2017 and 2018 (not used), ranging from the west coast
following the recommendations of Zhang et al. (2014). To           of Africa to Ascension Island. The other is the CLARIFY
decompose the BBA effect into radiative and microphysical          (Clouds and Aerosol Radiative Impacts and Forcing: Year
effects, we performed six simulations from 2016 to 2017: one       2016) campaign (Haywood et al., 2020), which was con-
with present GFAS BBA emissions and the kappa value of             ducted from Ascension Island in 2017. These flight cam-
organic carbon κorg set to 0.3 (Chang et al., 2010) as the base-   paigns were carried out during the biomass burning seasons
line simulation (BB0.3 ), one with the same settings but κorg      and have provided an ideal dataset covering both BBA above
set to 0 (BB0 ), two without BBA emissions and κorg set to 0.3     and interacting with clouds, as previous studies have found
and 0 (noBB0.3 , noBB0 ), and two with BBA emissions and           that the BBA plume layer generally subsides and meets the
κorg set to 0.3 and 0 but with the BBA absorption turned off       gradually deepening marine boundary layer in the vicinity

https://doi.org/10.5194/acp-21-17-2021                                                   Atmos. Chem. Phys., 21, 17–33, 2021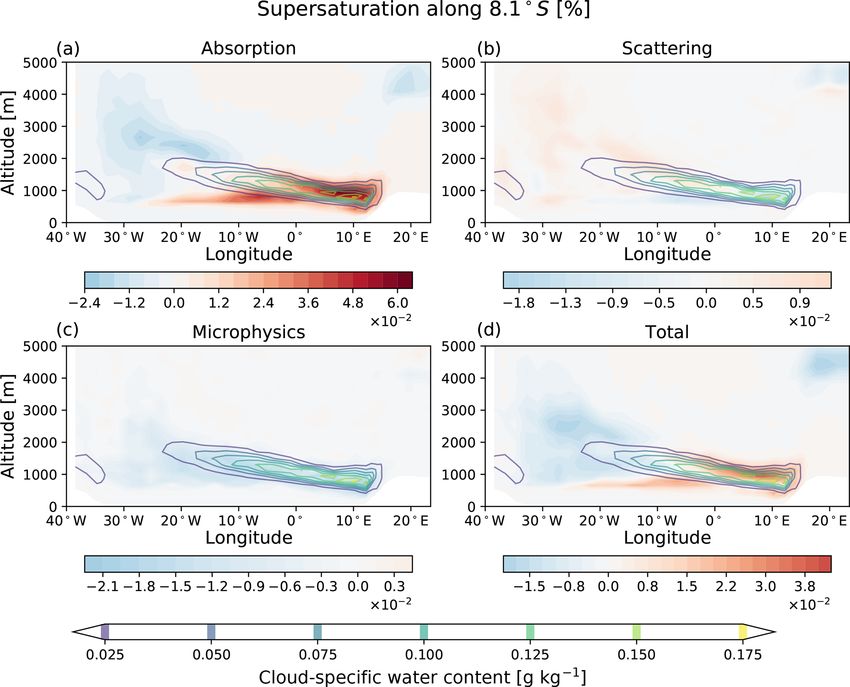
20                                 H. Che et al.: Cloud adjustments dominate the overall negative aerosol radiative effects

of Ascension Island and St. Helena (Adebiyi et al., 2015).         errors suggest that the reproduced plume generally agrees
However, observations also indicate that the entrainment of        well with measurements but is transported too far north and
BBA into the MBL can be intermittent, can require signif-          west. These biases might be partly attributable to the coarse
icant contact time (Diamond et al., 2018), and recircula-          model resolution and the use of 3-hourly output, which re-
tion patterns can result in clean MBL near Ascension Is-           duces reliability in the collocation. The comparison of mean
land. The aerosol extinction from ORACLES (2016, 2017)             July–August AOD from the model and retrievals (at ambi-
and CLARIFY is used to compare with the model data. For            ent relative humidity) from the MODIS satellite instrument
ORACLES, we use the dry aerosol scattering and absorption          further confirms this bias (Fig. S2), which indicates that the
coefficients from nephelometers and particle soot absorption       model error may be related to the location and initial altitude
photometer (PSAP) (Pistone et al., 2019); for CLARIFY, the         of biomass burning emissions. Furthermore, the BBA depo-
dry aerosol extinction coefficient was measured by cavity          sition in the model may be biased low.
ring-down spectroscopy using the EXSCALABAR instru-                   The mean vertical distribution of the aerosol extinction co-
ment (Extinction Scattering and Absorption of Light for Air-       efficient is shown in Fig. 2. The model extinction coefficient
Borne Aerosol Research; Cotterell et al., 2020; Davies et al.,     profile is collocated to the 3-D (latitude, longitude, time) co-
2018), similar to that reported by Langridge et al. (2011). For    ordinate of the observation. It can be seen in the figure that
the comparison, the extinction data from the observations are      the plume is above clouds from the coast to 2◦ W, where
calculated at the 550 nm wavelength by using the Ångström          it shows the extinction peak. From east to west, the plume
exponent. Then we collocate the 3-hourly variables from            subsides and comes into contact with the clouds. At 5◦ W,
the baseline model simulation with the aircraft observations       the plume is generally inside the clouds, although the actual
(Watson-Parris et al., 2016, 2019). Two different collocations     plume distribution and occurrence of plume–cloud contact at
are performed: one to the 4-D coordinates of the observations      any given time can be more nuanced (Diamond et al., 2018).
(time, longitude, latitude, altitude) and another one with 3-D     Thus, the BBAs can interact and modulate cloud properties.
coordinates (time, longitude, latitude) to provide modelled        This finding is also confirmed by previous studies (Adebiyi
point and profile data at the location of the observations.        et al., 2015; Chand et al., 2009; Deaconu et al., 2019; Gordon
The aerosol optical depth (AOD) at 550 nm from the Mod-            et al., 2018). From Fig. 2, the modelled vertical distribution
erate Resolution Imaging Spectroradiometer (MODIS) Terra           of the BBA plume agrees quite well with the measurements,
(MOD08_D3, version 4.4) and Aqua (MYD08_D3, Version                with the measured peak extinctions generally captured by the
4.4) level 3, 1◦ × 1◦ resolution, collection 6 daily products is   model. However, near 11◦ W, the modelled extinction coeffi-
also used to further evaluate the model performance.               cient has a slightly lower altitude than the measurement. This
                                                                   may indicate that the altitude of the plume is lower in the
                                                                   model; i.e. the model has less aerosol above cloud or aerosol
3     Results                                                      reaches lower when in clear sky, or it may be the result of
                                                                   comparing simulated extinction at ambient humidity to ob-
3.1    Model evaluation                                            servations of dry extinction.
                                                                      This comparison shows that the model has skill in repro-
The spatial and vertical distribution of the BBA plume is crit-    ducing the BBA plume, although the plume is transported
ical to aerosol–cloud interactions, as it can significantly im-    slightly too far west and north and also at a lower altitude
pact the sign and magnitude of the BBA effects (Bellouin           towards the western part of the region of interest (westward
et al., 2019). To evaluate the performance of the model, the       of 5◦ W). The bias of the BBA plume location and vertical
spatial and vertical distributions of the aerosol extinction co-   profile reproduced by the model will contribute to the uncer-
efficient from the model are compared with the aircraft ob-        tainty of the BBA microphysical effect over the ocean west
servations                                                         of 5◦ W and of the BBA radiative effect. However, these er-
   The mean spatial distributions of the aerosol extinction        rors are relatively small as the BBA plume is generally well
coefficient along the flight tracks are illustrated in Fig. 1.     simulated in the model, allowing us to investigate the BBA
Note that the modelled extinction is for ambient aerosols,         effect on the underlying and interacting cloud as well as the
while the measurement gives dry extinction. Although this          radiation balance.
intercomparison is widely used in model studies (Shinozuka
et al., 2020), it is a potential source of error for model–        3.2   Biomass burning aerosol impacts on clouds
measurement discrepancies, as the extinction coefficient will
generally be larger in the model. From Fig. 1, the model gen-      BBA can serve as CCN and further impact the CDNC and
erally agrees well with the measurements, and it captures          cloud optical depth. Meanwhile, it also has a significant im-
the extinction coefficient peak around 2◦ W; however, it also      pact on the atmospheric thermal structure and therefore the
overestimates the extinction around 5◦ W. Extinction coeffi-       cloud supersaturation, cloud droplet concentration, and cloud
cients are slightly underestimated by the model near the coast     albedo. The BBA effects on clouds are decomposed into
of southern Africa and overestimated over the SEA. These           radiative (absorption and scattering) and microphysical ef-

Atmos. Chem. Phys., 21, 17–33, 2021                                                    https://doi.org/10.5194/acp-21-17-2021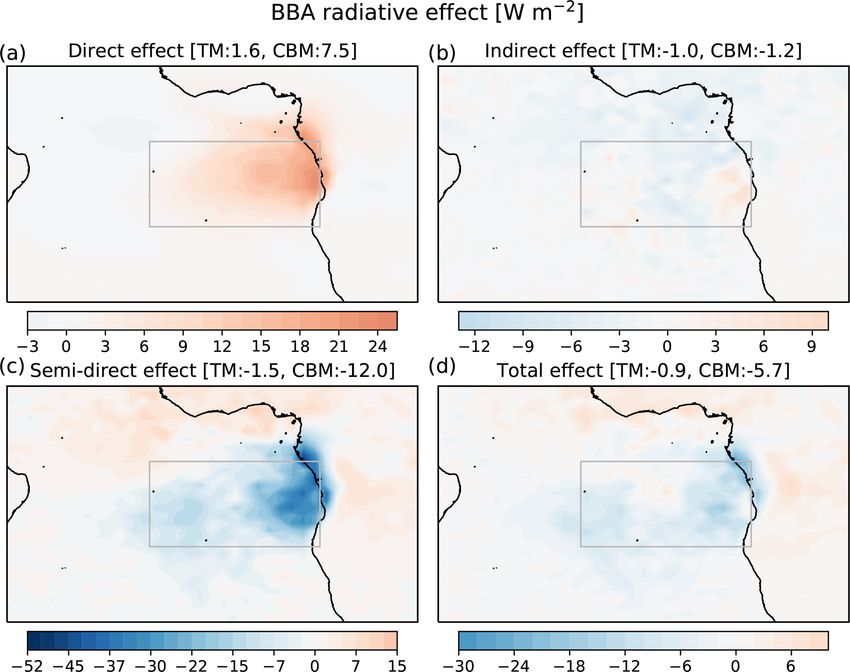
H. Che et al.: Cloud adjustments dominate the overall negative aerosol radiative effects                                                   21

Figure 1. Mean along-track aerosol extinction coefficient (Mm−1 ) from the (a) UKESM1 model collocated to the flight tracks, (b) flight
observations, and (c) differences between the model and observations. Note that the model extinction is under ambient conditions, whereas
the measured extinction is for dry aerosols with relative humidity below 30 %.

Figure 2. Mean along-flight-track vertical distribution of the aerosol extinction coefficient along longitude. The contour lines show the mean
collocated model extinction coefficient profile along with the location of the aircraft. The pixels represent the mean value of the aerosol
extinction coefficient from the CLARIFY and ORACLES (2016, 2017) campaigns. The hashed lines illustrate the model cloud location by
using cloud liquid water content from the model. Note that the modelled extinction is for ambient relative humidity, whereas the measured
extinction is for dry aerosols with relative humidity below 30 %. The same colour map is applied for measurement and model results to
facilitate comparison.

fects (detailed in Sect. 2), and their impact on the clouds              in Gordon et al., 2018), suggesting the dominance of stra-
is examined in this section. Figure 3 provides the baseline              tocumulus clouds in this area.
cloud properties from the standard simulation. The domain
in Fig. 3a, ranging from 30◦ S to 10◦ N and from 40◦ W to                3.2.1    Biomass burning aerosol effects on CCN
30◦ E, is the focus area of this paper. To get BBA effects on
the stratocumulus clouds, a cloud box area is used to rep-               CCN from BBA mainly occur over land and in the east-
resent the stratocumulus cloud deck region (the grey box in              ern part of the SEA. From east to west, a sharp gradient of
Fig. 3a). The mean low cloud fraction is 0.58 in the cloud               BBA CCN0.2 % (CCN at 0.2 % supersaturation) is evident in
box region, and its western border reaches the area where                Fig. 4a, which may be due to the strong aerosol wet and dry
the stratocumulus-to-cumulus transition occurs (See Fig. 1               removal mechanisms over the SEA, resulting in only BBA
                                                                         with a very small diameter being transported so far away
                                                                         from the continent. Due to the low hygroscopicity of BBA,

https://doi.org/10.5194/acp-21-17-2021                                                           Atmos. Chem. Phys., 21, 17–33, 2021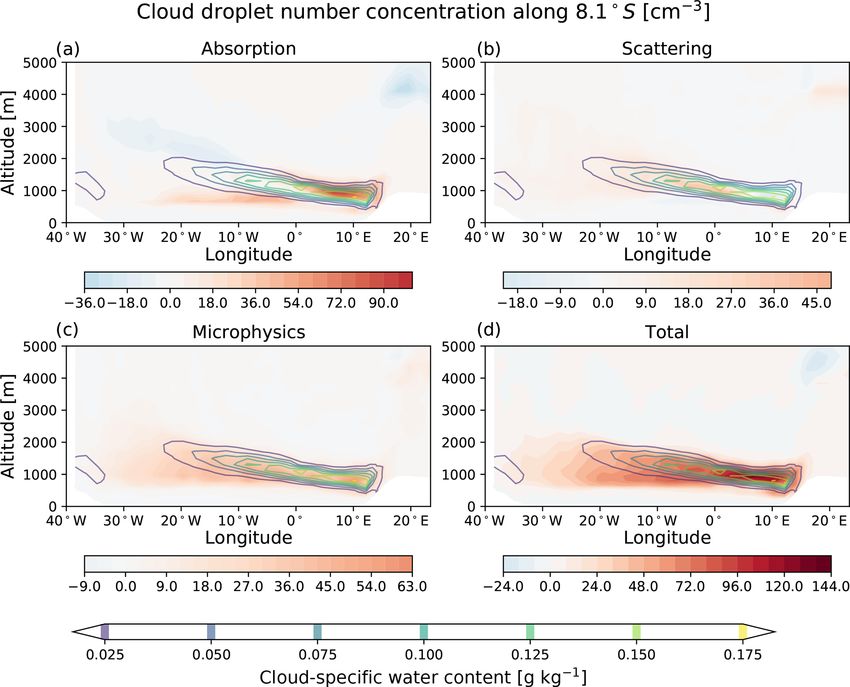
22 H. Che et al.: Cloud adjustments dominate the overall negative aerosol radiative effects
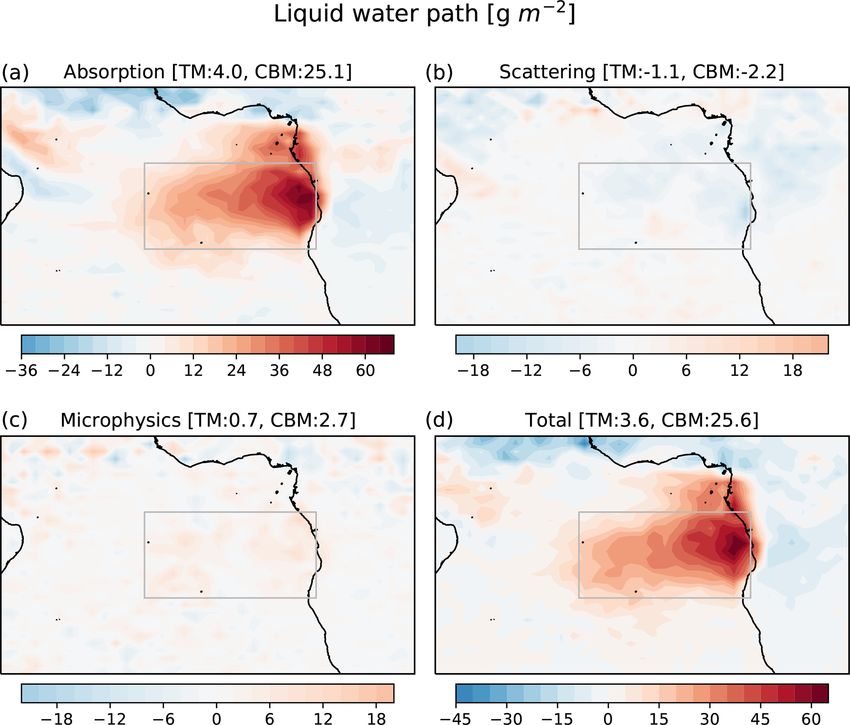
Figure 3. UKESM1-simulated mean (a) vertical profiles of supersaturation and (b) vertical profiles of cloud droplet number concentration
along the latitude of Ascension Island; spatial distribution of (c) cloud liquid water path and (d) cloud albedo from the International Satellite
Cloud Climatology Project (ISCCP) simulator. These means are averaged during July and August 2016–2017. The contour lines in (a–b) are
the cloud-specific water content. The TM in (c–d) is the total mean of the domain, and the CBM is the mean of the cloud box (the grey box
on the map) representing the areas where the average low cloud fraction is above 0.58.
small-diameter particles (below 0.1 µm) are unable to acti- as diagnosed by the activation scheme, is illustrated in Fig. 5.
vate. Furthermore, these fine particles decrease the average BBAs slightly increase the supersaturation near the continent
hygroscopicity of internally mixed aerosols and can thus re- and at low altitude over the SEA, while they decrease the
duce the CCN concentration. The budget of CCN0.2 % at- supersaturation at higher altitude. The increased supersatu-
tributed to BBA accounts for ∼ 65 % of total CCN0.2 % in ration mainly results from the BBA absorption effect, as the
the cloud box (grey box) and ∼ 40 % in the whole domain supersaturation profile is shifted to a lower altitude over the
(Fig. S3), indicating that BBA is the dominant source of CCN ocean. This supersaturation altitude shift may be related to
in the marine stratocumulus deck area. the change in the MBL height (Fig. S4). When BBA accu-
The BBA CCN0.2 % profile along the latitude of Ascension mulates above the inversion the absorbed shortwave radiation
Island (Fig. 4b) shows a distinct gradient. With near-source warms the air at the bottom of the inversion layer, strength-
concentrations of 1000 cm−3 , the BBA CCN0.2 % is trans- ening the temperature inversion (Fig. S5) and decreasing the
ported westward above the clouds and gradually enters the MBL height. This is also supported by a radiosonde research
cloud layer from the cloud top, accompanying the increase (Adebiyi et al., 2015), which found a shoaling of the bound-
in the marine boundary layer height and cloud height. These ary layer when absorbing aerosol was above. This effect is
BBAs could impact the cloud droplet number concentration especially notable further away from the continent, where the
either by acting as CCN or by evaporation of droplets through MBL is also higher and sensitive to the temperature profile
shortwave absorption. Although only a small fraction of the variations. Near the coast, BBAs are generally above the un-
BBA associated with CCN0.2 % has contact with cloud, the derlying cloud deck; the absorption aerosols could strengthen
in-cloud CCN0.2 % can still reach up to ∼ 500 cm−3 , indicat- the boundary layer inversion (Fig. S4) and thus decrease
ing the significant role of BBA acting as CCN and the po- the dry air entrainment, resulting in increased humidity and
tential impact upon the cloud and radiation balance through hence supersaturation. The increased supersaturation due to
modulation of CDNC. BBA absorption can be up to 45 % of the total, indicating
the significant role of BBA absorption in cloud droplet for-
3.2.2 Biomass burning aerosol effects on cloud droplets mation. The BBA scattering has little impact on supersat-
uration, with the mean effect around 0. The microphysical
The July and August averaged profile of BBA radiative and effect of BBA always exerts a negative impact on supersatu-
microphysical effects on supersaturation from 2016 to 2017,
Atmos. Chem. Phys., 21, 17–33, 2021 https://doi.org/10.5194/acp-21-17-2021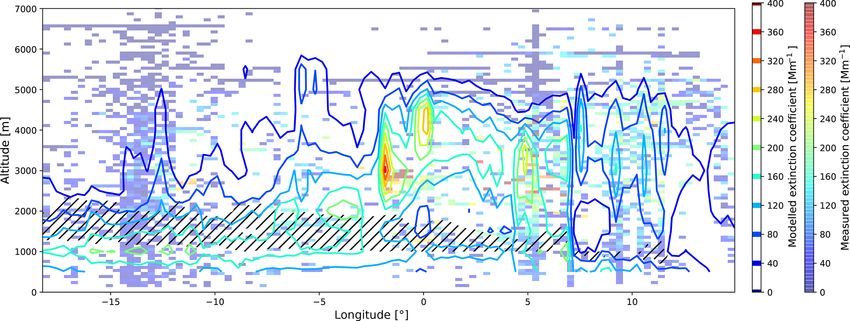
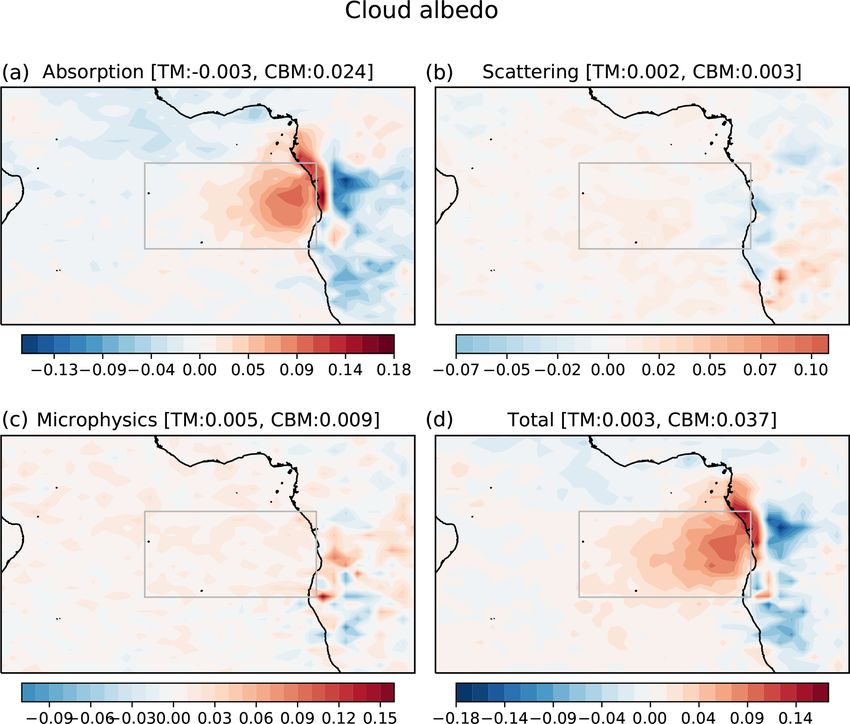
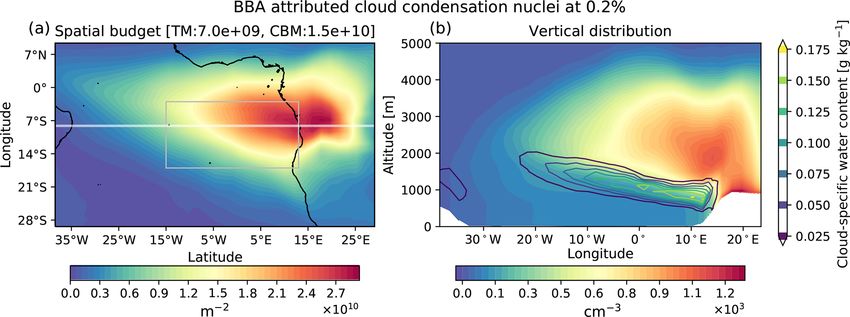
H. Che et al.: Cloud adjustments dominate the overall negative aerosol radiative effects                                                  23

Figure 4. UKESM1-simulated mean cloud condensation nuclei attributed to BBA at 0.2 % supersaturation under standard conditions for
temperature and pressure (STP) during July and August 2016–2017 as (a) the vertically integrated burden and (b) profile along the latitude
of Ascension Island, 8.1◦ S (the white line in Fig. 3a). The domain in Fig. 3a, ranging from 30◦ S to 10◦ N and from 40◦ W to 30◦ E, is the
area of interest in this paper. The grey box in the map (cloud box) represents the cloud areas where the averaged low cloud fraction is above
0.58. The TM is the total mean of the domain and the CBM is the mean of the cloud box. The contours in Fig. 3b are the cloud-specific water
content in the baseline simulation.

ration, as expected from BBA acting as a condensation sink               to the microphysical effect is more notable over the sea be-
through hygroscopic growth or CCN activation and subse-                  cause only when the BBAs are entrained and interact with
quent droplet growth. However, the decrease in supersatura-              the cloud can they be activated as cloud droplets. The scat-
tion due to the BBA microphysical effect is comparatively                tering effect only slightly increases CDNC when the MBL is
small, indicating that the ability of BBA to act as CCN in               deep enough to entrain BBA. However, similarly to the BBA
our simulations is limited by its low hygroscopicity. In gen-            scattering effect on supersaturation, the increased CDNC due
eral, the BBA total effect on supersaturation shares a similar           to scattering is negligible. In general, the substantial increase
pattern with the absorption effect. However, as the BBA ra-              in CDNC by BBA can be attributed to the combined effect
diative and microphysical effects counterbalance in the lower            of absorption and microphysics, whereby the former mainly
part of the cloud, the total BBA effect on supersaturation is            increases CDNC near the continent and at lower altitude, and
smaller near the continent and at the cloud base. The increase           the latter increases CDNC above the ocean. Though BBA can
in supersaturation from the BBA total effect is still quite no-          contribute up to 56 % of total CDNC in some areas, its aver-
ticeable.                                                                age contribution during July–August in the SEA is around
   Before the onset of collision coalescence CDNC is deter-              13 %, much less than its contribution to the CCN0.2 % bud-
mined by both the CCN and supersaturation, and the varia-                get fraction. This indicates a contribution of BBAs above
tion of CDNC due to BBA is shown in Fig. 6. As illustrated               the cloud layer unable to activate, although they can serve
through the previous analysis, although the radiative prop-              as CCN at 0.2 % supersaturation.
erties of BBA are not directly related to the CCN number
concentration, this could still alter supersaturation and hence          3.2.3   Biomass burning aerosol effects on cloud liquid
impact the activation of CCN. The change in CDNC due to                          water
the absorption of BBA shows a corresponding response to
the effect of BBA on supersaturation, shifting to lower alti-            The simulated changes in LWP in Fig. 7 show a distinct re-
tude over the ocean, which is expressed as increasing at the             sponse to BBA over the SEA. Within the cloud box area, the
cloud base and decreasing at the cloud top over the ocean                BBA interaction can increase LWP by up to ∼ 34 % of the
compared to the baseline simulation. Interestingly, the BBA              total (Fig. 3), indicating the critical influence of BBA on the
absorption increases CDNC up to 102 cm−3 near the conti-                 stratocumulus deck. Figure 7 shows that the BBA impacts
nent, which is surprisingly high compared to the increased               the LWP mainly through its absorption effect. The increased
supersaturation. This may partly be because the increased                LWP due to BBA absorption is more significant near the con-
cloud fraction near the continent caused by the stabilizing              tinent than in other areas, which may be because most BBAs
effect of absorption results in an increase in total CDNC, or            are above cloud near the continent. This finding is consistent
the critical supersaturation of ambient aerosols is around the           with the results of large-eddy simulation research (Herbert
cloud supersaturation, and thus a slight variation of the cloud          et al., 2020; Johnson et al., 2004; Yamaguchi et al., 2015;
supersaturation would activate a large quantity of CCN. Un-              Zhou et al., 2017) indicating that above-cloud BBA can in-
like the effect of BBA absorption, the increased CDNC due                hibit cloud-top entrainment and increase LWP. When BBA

https://doi.org/10.5194/acp-21-17-2021                                                           Atmos. Chem. Phys., 21, 17–33, 2021
24 H. Che et al.: Cloud adjustments dominate the overall negative aerosol radiative effects
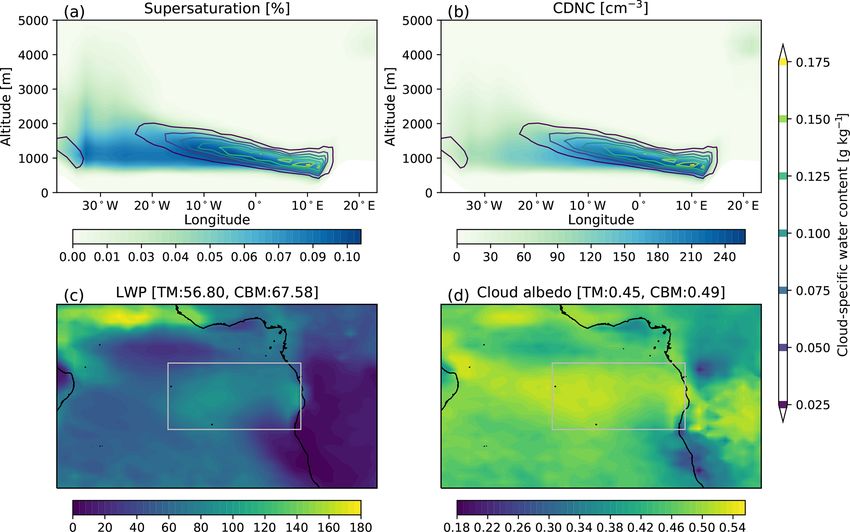
Figure 5. UKESM1-simulated mean vertical profiles of BBA effects on supersaturation along the latitude of Ascension Island (see Fig. 3a)
during July and August 2016–2017: (a) absorption, (b) scattering, (c) microphysical, and (d) total. The contour lines are the baseline cloud-
specific water content. The same colour map scale is used in each plot to facilitate comparison, but the colour map ranges differ in each plot,
corresponding to the maximum and minimum variation of supersaturation in each.
is transported further from the continent, the entrainment of the International Satellite Cloud Climatology Project (IS-
BBA into the cloud layer reduces cloud droplet numbers by CCP) simulator (Bodas-Salcedo et al., 2011), which can min-
lowering the relative humidity through diabatic heating from imize the impacts of how clouds are defined in different
absorption, which further reduces the increase in LWP and parameterizations and facilitate model intercomparison. As
results in a nearly zero or slightly negative effect on LWP. shown in Fig. 8, BBA generally increases cloud albedo in the
As a result of the different effects of the absorption by BBA cloud box area (total effect), which is consistent with rela-
and its spatial distribution (more concentrated near the con- tionships derived from a satellite-based analysis (Deaconu et
tinent), the increased LWP from BBA absorption is mainly al., 2019). The cloud albedo increased by BBA accounts for
located near the continent where BBA and clouds are well ∼ 8 % of the total in the area where the stratocumulus cloud
separated, indicating the role of BBA in modulating the cloud deck dominates (cloud box area). The effect of BBA on cloud
distribution. The microphysical effect of BBA, which is less albedo from BBA can be primarily attributed to absorption
clearly distinguishable, generally increases the LWP above and the microphysical effect; these two effects together can
the ocean. However, the increase in LWP by the BBA mi- account for ∼ 90 % of the cloud albedo increase due to BBA
crophysical effect in the cloud box only accounts for ∼ 4 % in the cloud box area. Unlike the microphysical effect, BBA
of the total LWP, far less than the BBA absorption effect. absorption significantly increases cloud albedo near the con-
Therefore, the BBA effect on the LWP is mainly due to its tinent where most BBAs are above the cloud. The above-
absorption characteristics. cloud BBA can decrease the dry air entrainment, increase
the liquid water content due to absorption (see Fig. 7), and
3.2.4 Biomass burning aerosol effects on cloud albedo lead to an increase in cloud particles and higher cloud albedo.
However, when more BBAs are entrained into the MBL, the
BBAs decrease the number of cloud droplets through their
Cloud albedo is crucial in climate, as it is one of the crit-
absorption effect and therefore have a negative impact on the
ical parameters in determining the shortwave cloud radia-
cloud albedo. Therefore, the two different effects of BBA ab-
tive effect. In the UKESM1, cloud albedo is diagnosed by
Atmos. Chem. Phys., 21, 17–33, 2021 https://doi.org/10.5194/acp-21-17-2021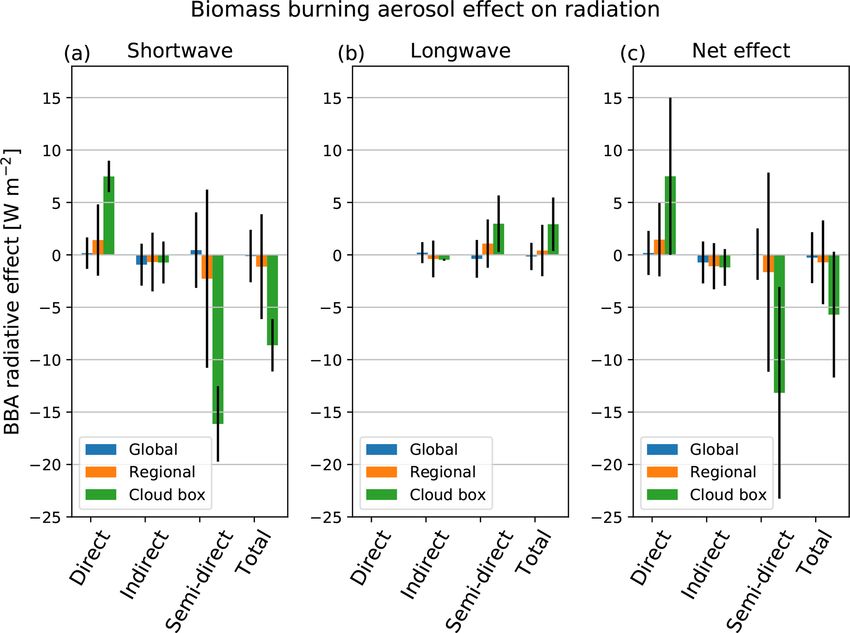
H. Che et al.: Cloud adjustments dominate the overall negative aerosol radiative effects                                            25

Figure 6. Same as Fig. 5 but for the in-cloud cloud droplet number concentration per cubic centimetre.

sorption – BBA above clouds and inside clouds – counteract              shows a cooling effect. However, the cooling due to the di-
each other and result in a slight increase in LWP and a nearly          rect effect is negligible, as only a minor proportion of BBA
zero impact on the cloud albedo near the western boundary               with small particle diameters is transported so far west. The
of the cloud box. Note that the LWP and the cloud albedo                July–August averaged warming effect from the direct effect
changes are consistent, although the different colour scale             is large in the cloud box area: up to ∼ 25.5 W m−2 near the
and the non-linear response of cloud albedo to LWP may re-              continent. The indirect radiative effect of BBA shows a sim-
sult in the cloud albedo having less variation than the LWP             ilar pattern to the LWP changes due to the microphysical ef-
in the western boundary of the cloud box. The microphysi-               fect of BBA and has a July–August mean cooling effect of
cal effect of BBA increases cloud albedo homogenously over              −1.2 W m−2 in the cloud box area. In some areas, the in-
the ocean because the increase in CCN provided by BBA in-               direct effect shows a slight warming effect, which may be
creases CDNC. Compared to the effect of BBA absorption,                 caused by the weather noise unconstrained by nudging be-
the increased cloud albedo due to a change in CCN is small,             tween different initializations as the cloud fraction and LWP
again indicating the significant role of BBA radiative proper-          both increase. The magnitude of the indirect effect is strongly
ties.                                                                   related to the CCN; particles with high hygroscopicity could
                                                                        further increase the CDNC. Thus, different settings of OC
3.3   Biomass burning aerosol radiative effect                          hygroscopicity would result in differences in the indirect ef-
                                                                        fect. In this paper, we use a kappa value of 0.3 for OC, which
The time-averaged BBA effects on the top-of-atmosphere                  may account for some of the uncertainty in the indirect effect.
radiation balance are investigated in this section. The sim-               The BBA semi-direct radiative effects show the most sub-
ulated direct radiative effect of BBA is generally positive,            stantial cooling in the cloud box; however, they also have
except in the western areas of the ocean (north-west of As-             a warming effect in the north-west areas over the sea out-
cension Island) where BBAs have been transported far away               side the cloud box. The July–August semi-direct effects can
from the source. The different sign of the mean direct effect           be up to ∼ −52 W m−2 near the coast and dominate the to-
depends on the underlying surface brightness; thus, when                tal radiative effect in the cloud box area. The cooling of the
BBAs are above clouds, the direct effect shows a warming                semi-direct effects is mainly located in the area where the
effect, while under clear sky far away from the continent, it           BBAs are above the clouds and results from the significant

https://doi.org/10.5194/acp-21-17-2021                                                         Atmos. Chem. Phys., 21, 17–33, 2021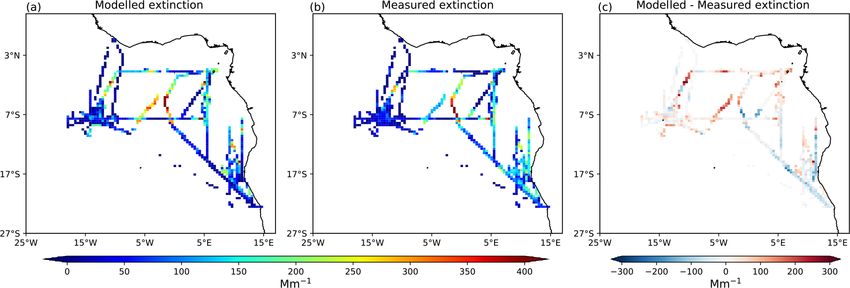
26                                   H. Che et al.: Cloud adjustments dominate the overall negative aerosol radiative effects

Figure 7. UKESM1-simulated mean spatial distribution of the BBA effects of (a) absorption, (b) scattering, (c) microphysical, and (d) total
on the cloud liquid water path during July and August 2016–2017. The domain range is from 30◦ S to 10◦ N and from 40◦ W to 30◦ E. The
TM is the total mean of the domain and the CBM is the mean of the cloud box (the grey box on the map) representing the areas where the
average low cloud fraction is above 0.58. The same colour scale is used in each plot to facilitate comparison, but the colour map ranges differ
in each plot, corresponding to the maximum and minimum variation of LWP in each.

increase in LWP and cloud albedo in that area (due to the                 net cooling effect in that area. In the cloud box, the July–
stabilizing effect of BBA absorption). The warming effect                 August averaged BBA total radiative effect can be up to
dominates where the cloud fraction is low and BBAs have                   −30 W m−2 , with a mean value of −5.7 W m−2 . Gordon et
already entered the boundary layer, which further reduces                 al. (2018) have previously estimated the BBA radiative ef-
the cloud fraction and leads to positive semi-direct effects.             fects near Ascension Island using the same model with a
Thus, as the dominant effect over the south-eastern Atlantic,             different high-resolution configuration and model version.
the magnitude and the sign of the semi-direct effects are                 Comparing the radiative effects in the same domain, the
strongly dependent on the relative location of the BBA and                direct and semi-direct effects from their simulations (di-
the cloud layer. Herbert et al. (2020) studied different lay-             rect effect: 10.3 W m−2 ; semi-direct effects: −16.1 W m−2 )
ers of the plume with different altitudes and found that the              are roughly 2 times higher than our results (direct effect:
closer the aerosol layer is to the cloud top, the stronger the            3.3 W m−2 ; semi-direct effects: −9.2 W m−2 ), as they only
magnitude of the semi-direct effects. However, in our simu-               sampled the 5 most polluted days. Nevertheless, the indirect
lation, the BBA plume is not well separated from the under-               effect in their results is −11.4 W m−2 , which is dispropor-
lying clouds. Thus, when the BBAs are closer to the cloud,                tionately higher than our simulation (−0.6 W m−2 ). The pos-
some BBA may have entered the cloud layer. As a result, the               sible reason behind this discrepancy is that the OC kappa
above-cloud semi-direct effects lead to a top-of-atmosphere               value in their simulation is 0.88, which is much higher than
(TOA) cooling, whereas in-cloud semi-direct effects lead to               our setting of 0.3. Furthermore, the meteorological condi-
a TOA warming.                                                            tions are different as they only averaged 5 d.
   The total net radiative effect of BBA shows a similar spa-                The mean BBA radiative effects in the shortwave and long-
tial pattern as the semi-direct effects albeit with a smaller             wave are summarized in Fig. 10. In the cloud box, the semi-
magnitude, reflecting the dominant role of semi-direct ef-                direct effects are the dominate BBA radiative effect, resulting
fects in this region. The total July–August BBA radiative                 in a considerable cooling of the total radiative effect over the
effect over the whole domain is −0.9 W m−2 , exerting a                   cloud area. The cooling of semi-direct effects in the cloud

Atmos. Chem. Phys., 21, 17–33, 2021                                                             https://doi.org/10.5194/acp-21-17-2021
H. Che et al.: Cloud adjustments dominate the overall negative aerosol radiative effects                                               27

Figure 8. UKESM1 International Satellite Cloud Climatology Project (ISCCP) simulator mean spatial distribution of the BBA effects
of (a) absorption, (b) scattering, (c) microphysical, and (d) total on the cloud albedo during July and August 2016–2017. The domain
range is from 30◦ S to 10◦ N and from 40◦ W to 30◦ E. The TM is the total mean of the domain and the CBM is the mean of the cloud box
(the grey box on the map) representing the areas where the average low cloud fraction is above 0.58. The same colour scale is used in each
plot to facilitate comparison, but the colour map ranges differ in each plot, corresponding to the maximum and minimum variation of cloud
albedo in each.

box is generally at the shortwave, while at longwave, semi-            gional semi-direct effects, indicating the role of BBA–cloud
direct effects show a slight warming effect. This may result           interactions in this region. In general, BBAs have the most
from the semi-direct enhancement of LWP and cloud cover;               significant radiative effects in the cloud deck area, followed
therefore, the outgoing longwave radiation at the top of the           by the South Atlantic Ocean and western Africa (regional do-
atmosphere is reduced as it comes from the relatively cool             main). The indirect effect is generally the same in these areas
cloud tops rather than the warmer ocean surface, as discussed          and is one of the critical factors in determining the regional
in Zhou et al. (2017). The direct effect is 7 W m−2 in the             radiation balance. The dominant effect in these areas is the
cloud box area, which partially cancels the cooling of the             cooling effect exerted by the semi-direct radiative effects.
semi-direct effects. The indirect effect is cooling in this area.
However, its magnitude is relatively small, which may result
from the limited capability of BBA to act as CCN due to its            4   Discussion and conclusion
low hygroscopicity.
                                                                       The UK Earth System Model (UKESM1) is used to in-
   For the regional domain, the BBA semi-direct effects also
                                                                       vestigate the effects of biomass burning aerosols over the
show a negative cooling effect. However, compared with the
                                                                       south-eastern Atlantic to provide a better understanding of
cloud box, the mean value of semi-direct effects decreases
                                                                       their radiative and microphysical effects on clouds as well
rapidly when the averaged domain size increases, as it is only
                                                                       as the radiation balance in this area. The analysis focuses
about −1.6 W m−2 for the regional domain, i.e. ∼ 13 % of the
                                                                       on the biomass burning seasons from July–August for the
semi-direct net effects in the cloud box area. Globally, the net
                                                                       years 2016 and 2017, which facilitates model evaluation
semi-direct effects are nearly zero, indicating that the semi-
                                                                       with flight measurements from the ORACLES and CLAR-
direct effects from biomass burning primarily affect the cloud
                                                                       IFY campaigns.
deck over the SEA. The regionally averaged indirect effect is
                                                                          Comparison with the flight observations shows that the
similar to the cloud box mean and slightly lower than the re-
                                                                       model generally captures the spatial and vertical distribu-

https://doi.org/10.5194/acp-21-17-2021                                                         Atmos. Chem. Phys., 21, 17–33, 2021
28 H. Che et al.: Cloud adjustments dominate the overall negative aerosol radiative effects Figure 9. UKESM1 mean net (shortwave + longwave) biomass burning aerosols. (a) Direct, (b) indirect, (c) semi-direct, and (d) total radiative effects during July and August 2016–2017. The same colour map scale is used for each plot, but the colour map ranges differ in each plot, corresponding to the maximum and minimum of the effect in each. tions of the BBA plume; however, the simulated plume is lo- version, which results in the weakening of entrainment across cated too far north-west and at a slightly lower altitude in the the inversion layer, as buoyant parcels of air in the MBL re- model. Although the semi-direct effects and cloud response quire more energy in order to push through the strengthened are sensitive to the relative distance of cloud and the biomass temperature inversion (Herbert et al., 2020). Therefore, the burning plume (Herbert et al., 2020), these errors are rela- relative humidity increases, as does the supersaturation. As a tively small, providing the foundation for our investigation consequence, the BBA absorption effect shows a correspond- of the BBA effect on clouds and the radiation balance in this ing response to the supersaturation, with increases at low al- region. titudes (cloud bottom in the baseline simulation), decreases BBA-associated CCN are emitted from the land and then at high altitudes (cloud top from baseline) over the ocean fur- transported westward above the cloud. With the increase in ther offshore, and general increases near the continent. The the marine boundary layer height and reduction of the plume microphysical effect decreases the supersaturation, as BBA height, BBAs enter the cloud layer from the top. The bud- can act as CCN and allow additional water vapour to con- get of CCN0.2 % attributable to BBA can account for ∼ 65 % dense; however, this decrease is comparatively small. The of the total CCN0.2 % in the cloud box area, indicating that CDNC over SEA is increased, especially further offshore, BBAs are the primary source of CCN for the marine stra- due to the BBA microphysical effect compensating for the tocumulus deck. decreased CDNC at higher altitude from the absorption ef- The effects of BBA on clouds are separated into radiative fect. In general, BBA absorption and microphysical effects effects (including the effects from absorption and scattering) both contribute to the increase in CDNC, although the for- and the microphysical effect. The impact of BBA on in-cloud mer is mainly through affecting the supersaturation, while supersaturation is mainly due to its absorption. When BBAs the latter is through increasing CCN. accumulate above the inversion, the absorbed shortwave ra- The BBA absorption effect increases LWP significantly diation warms the air at the bottom of the inversion layer, when BBAs are located above the stratocumulus deck, as strengthening the temperature inversion and decreasing the the stabilization from absorption can inhibit cloud-top en- marine boundary layer height. As a consequence, the super- trainment. When BBA enters the cloud layer, it can decrease saturation shifts to a lower altitude above the ocean. Near the the amount of condensable liquid water and so decrease the coast, the above-cloud BBA strengthens the temperature in- LWP. As a result, the variation of LWP due to the absorp- Atmos. Chem. Phys., 21, 17–33, 2021 https://doi.org/10.5194/acp-21-17-2021
H. Che et al.: Cloud adjustments dominate the overall negative aerosol radiative effects                                              29

Figure 10. Bar chart of UKESM1 mean BBA radiative effect during July and August 2016–2017. The BBA radiative effect at the (a)
shortwave and (b) longwave as well as the (c) net effect are presented in separate plots. Blue represents the global mean; orange is the
domain mean, and green is the cloud box mean. The error bars represent standard errors.

tion effect is nearly zero or slightly negative when far away         results from the response of LWP to the BBA microphysi-
from the continent. The microphysical effect also contributes         cal effect, as they share a similar spatial pattern. When com-
to the increase in LWP; however, this increase is small com-          paring the BBA radiative effects at different scales, we find
pared to the absorption effect. Therefore, the LWP response           that semi-direct effects from biomass burning play a signifi-
to BBA is dominated by the effect of absorption, showing a            cant role over the south-eastern Atlantic stratocumulus deck,
substantial increase over the south-eastern Atlantic. The vari-       while they have little impact on the global mean.
ation of cloud albedo due to BBA shows a similar pattern as
the LWP.
   The dominance of the effect of absorption on cloud prop-           Data availability. The original simulation data are available from
erties is reflected in the effect on the top-of-atmosphere ra-        the JASMIN facility upon request. There are also processed model
diation balance. When BBAs are above the stratocumulus                data, which can be downloaded from https://data.mendeley.com/
deck, semi-direct effects contribute most to the overall cool-        datasets/xdxh8stc48/3 (Che, 2020). Data from the CLARIFY air-
                                                                      craft campaign are available on the CEDA repository at http://
ing, while they also exert a warming effect in the north-west
                                                                      archive.ceda.ac.uk/ (Facility for Airborne Atmospheric Measure-
areas over the sea. The magnitude and the sign of the semi-           ments, Natural Environment Research Council, and Met Office,
direct effects are dependent on the relative location of BBA          2020). Data from ORACLES aircraft campaigns are available on the
and clouds, as BBAs can either increase the underlying cloud          repository at https://espo.nasa.gov/oracles/archive/browse/oracles
LWP or decrease the surrounding droplet numbers depending             (ORACLES Science Team, 2020a, b).
on whether the BBAs are above or inside the cloud. The di-
rect radiative effect is generally positive and shows a strong
warming when BBAs are above the stratocumulus deck (with              Supplement. The supplement related to this article is available on-
a July–August average of 7.5 W m−2 ), as the surface albedo           line at: https://doi.org/10.5194/acp-21-17-2021-supplement.
of the underlying clouds is fairly high. However, for the total
net BBA radiative effect the positive direct radiative effect is
more than compensated for by the semi-direct effects, result-         Author contributions. PS and HC developed the concepts and ideas
ing in an overall cooling effect over the SEA (with a July–           for the direction of the paper. HC and HG set up the model. HC
August average of −0.9 W m−2 ). In addition to the semi-              carried out and analysed the model simulation. DWP and HC per-
direct effects, the indirect radiative effect is also negative,       formed the model validation. LD, DWP, HG, HC, and PS con-
showing a cooling in this area. The indirect effect mainly

https://doi.org/10.5194/acp-21-17-2021                                                       Atmos. Chem. Phys., 21, 17–33, 2021
30 H. Che et al.: Cloud adjustments dominate the overall negative aerosol radiative effects
tributed to the analysis of the results. HC wrote the paper with input A.-L., Dufresne, J.-L., Feingold, G., Fiedler, S., Forster, P., Get-
and comments from all other authors. telman, A., Haywood, J. M., Lohmann, U., Malavelle, F., Mau-
ritsen, T., McCoy, D. T., Myhre, G., Mülmenstädt, J., Neubauer,
D., Possner, A., Rugenstein, M., Sato, Y., Schulz, M., Schwartz,
Competing interests. The authors declare that they have no conflict S. E., Sourdeval, O., Storelvmo, T., Toll, V., Winker, D., and
of interest. Stevens, B.: Bounding global aerosol radiative forcing of climate
change, Reviews of Geophysics, 58, e2019RG000660, 2019.
Bodas-Salcedo, A., Webb, M. J., Bony, S., Chepfer, H., Dufresne,
Special issue statement. This article is part of the special issue J.-L., Klein, S. A., Zhang, Y., Marchand, R., Haynes, J. M., Pin-
“New observations and related modelling studies of the aerosol– cus, R., and John, V. O.: COSP: Satellite simulation software
cloud–climate system in the Southeast Atlantic and southern Africa for model assessment, B. Am. Meteor. Soc., 92, 1023–1043,
regions (ACP/AMT inter-journal SI)”. It is not associated with a https://doi.org/10.1175/2011BAMS2856.1, 2011.
conference. Chand, D., Wood, R., Anderson, T. L., Satheesh, S. K., and
Charlson, R. J.: Satellite-derived direct radiative effect of
aerosols dependent on cloud cover, Nat. Geosci., 2, 181–184,
https://doi.org/10.1038/ngeo437, 2009.
Acknowledgements. We sincerely acknowledge Kate Szpek from
Chang, R. Y.-W., Slowik, J. G., Shantz, N. C., Vlasenko, A., Liggio,
the Met Office CLARIFY team and Steven Howell from the NASA
J., Sjostedt, S. J., Leaitch, W. R., and Abbatt, J. P. D.: The hy-
ORACLES team for providing aerosol scattering and absorption
groscopicity parameter (κ) of ambient organic aerosol at a field
data, as well as all CLARIFY and ORACLES science teams for
site subject to biogenic and anthropogenic influences: relation-
data support. We also thank Luke Abraham and William Ingram
ship to degree of aerosol oxidation, Atmos. Chem. Phys., 10,
for the help with the model, Ben Johnson for the help with setting
5047–5064, https://doi.org/10.5194/acp-10-5047-2010, 2010.
up biomass burning emissions, and William Jones for proofread-
Che, H.: Cloud adjustments dominate the overall negative aerosol
ing the paper. We acknowledge the use of the Monsoon2 system, a
radiative effects of biomass burning aerosols in UKESM1 cli-
collaborative facility supplied under the Joint Weather and Climate
mate model simulations over the south-eastern Atlantic, Mende-
Research Programme, a strategic partnership between the UK Met
ley Data, V3, https://doi.org/10.17632/xdxh8stc48.3, 2020.
Office and the Natural Environment Research Council (NERC). We
Costantino, L. and Bréon, F.-M.: Analysis of aerosol-cloud inter-
also used the JASMIN facility (https://www.jasmin.ac.uk/, last ac-
action from multi-sensor satellite observations, Geophys. Res.
cess: 21 December 2020) via the Centre for Environmental Data
Lett., 37, L11801, https://doi.org/10.1029/2009GL041828, 2010.
Analysis, funded by NERC and the UK Space Agency and deliv-
Costantino, L. and Bréon, F.-M.: Aerosol indirect effect on
ered by the Science and Technology Facilities Council.
warm clouds over South-East Atlantic, from co-located MODIS
and CALIPSO observations, Atmos. Chem. Phys., 13, 69–88,
https://doi.org/10.5194/acp-13-69-2013, 2013
Financial support. This research has been supported by the Nat- Cotterell, M. I., Szpek, K., Haywood, J. M., and Lan-
ural Environment Research Council CLARIFY project (grant no. gridge, J. M.: Sensitivity and accuracy of refractive in-
NE/L01355X/1) and European Research Council constRaining the dex retrievals from measured extinction and absorption
EffeCts of Aerosols on Precipitation (RECAP) (grant no. 724602). cross sections for mobility-selected internally mixed light
absorbing aerosols, Aerosol Sci. Tech., 54, 1034–1057,
https://doi.org/10.1080/02786826.2020.1757034, 2020.
Review statement. This paper was edited by Frank Eckardt and re- Davies, N. W., Cotterell, M. I., Fox, C., Szpek, K., Haywood, J.
viewed by Michael Diamond and one anonymous referee. M., and Langridge, J. M.: On the accuracy of aerosol photoa-
coustic spectrometer calibrations using absorption by ozone, At-
mos. Meas. Tech., 11, 2313–2324, https://doi.org/10.5194/amt-
11-2313-2018, 2018.
References Deaconu, L. T., Ferlay, N., Waquet, F., Peers, F., Thieuleux, F.,
and Goloub, P.: Satellite inference of water vapour and above-
Ackerman, A. S., Kirkpatrick, M. P., Stevens, D. E., and cloud aerosol combined effect on radiative budget and cloud-
Toon, O. B.: The impact of humidity above stratiform top processes in the southeastern Atlantic Ocean, Atmos. Chem.
clouds on indirect aerosol climate forcing, Nature, 432, 1014, Phys., 19, 11613–11634, https://doi.org/10.5194/acp-19-11613-
https://doi.org/10.1038/nature03174, 2004. 2019, 2019.
Adebiyi, A. A. and Zuidema, P.: The role of the southern African Diamond, M. S., Dobracki, A., Freitag, S., Small Griswold, J.
easterly jet in modifying the southeast Atlantic aerosol and D., Heikkila, A., Howell, S. G., Kacarab, M. E., Podolske, J.
cloud environments, Q. J. Roy. Meteorol. Soc., 142, 1574–1589, R., Saide, P. E., and Wood, R.: Time-dependent entrainment of
https://doi.org/10.1002/qj.2765, 2016. smoke presents an observational challenge for assessing aerosol–
Adebiyi, A. A., Zuidema, P., and Abel, S. J.: The Convolution of cloud interactions over the southeast Atlantic Ocean, Atmos.
Dynamics and Moisture with the Presence of Shortwave Absorb- Chem. Phys., 18, 14623–14636, https://doi.org/10.5194/acp-18-
ing Aerosols over the Southeast Atlantic, J. Climate, 28, 1997– 14623-2018, 2018.
2024, https://doi.org/10.1175/JCLI-D-14-00352.1, 2015. Eyring, V., Bony, S., Meehl, G. A., Senior, C. A., Stevens, B.,
Bellouin, N., Quaas, J., Gryspeerdt, E., Kinne, S., Stier, P., Watson- Stouffer, R. J., and Taylor, K. E.: Overview of the Coupled
Parris, D., Boucher, O., Carslaw, K. S., Christensen, M., Daniau,
Atmos. Chem. Phys., 21, 17–33, 2021 https://doi.org/10.5194/acp-21-17-2021You can also read