Flash flood warnings in context: combining local knowledge and large-scale hydro-meteorological patterns
←
→
Page content transcription
If your browser does not render page correctly, please read the page content below

Nat. Hazards Earth Syst. Sci., 22, 461–480, 2022
https://doi.org/10.5194/nhess-22-461-2022
© Author(s) 2022. This work is distributed under
the Creative Commons Attribution 4.0 License.

Flash flood warnings in context: combining local knowledge
and large-scale hydro-meteorological patterns
Agathe Bucherie1,2,3 , Micha Werner2 , Marc van den Homberg3 , and Simon Tembo4
1 International Research Institute for Climate and Society (IRI), Columbia University, New York, New York 10964, USA
2 IHE  Delft Institute for Water Education, Delft, 2611 AX, the Netherlands
3 510, the Netherlands Red Cross, the Hague, 2593 HT, the Netherlands
4 Malawi Red Cross Society, Lilongwe, 30096, Malawi

Correspondence: Agathe Bucherie (agathe.bucherie@gmail.com)

Received: 5 April 2021 – Discussion started: 23 April 2021
Revised: 8 October 2021 – Accepted: 18 December 2021 – Published: 16 February 2022

Abstract. The small spatial and temporal scales at which          1   Introduction
flash floods occur make predicting events challenging, par-
ticularly in data-poor environments where high-resolution
weather models may not be available. Additionally, the up-        Weather-related hazards are responsible for 78 % of the eco-
take of warnings may be hampered by difficulties in trans-        nomic losses and 38 % of the fatalities related to disasters
lating the scientific information to the local context and ex-    worldwide, with a drastic increase in the number of events
periences. Here we use social science methods to charac-          in the last 35 years attributed to global climate change. Hy-
terise local knowledge of flash flooding among vulnerable         drological events show the highest increase globally with
communities along the flat Lake Malawi shoreline in the           a rise of a factor of 4, while meteorological catastrophes
district of Karonga, northern Malawi. This is then used to        have increased by a factor of 3 (Hoeppe, 2015). Although
guide a scientific analysis of the factors that contribute to     these events affect the entire globe, exposure to hydrological
flash floods in the area using contemporary global datasets,      events and vulnerability of those affected are not uniformly
including geomorphology, soil and land-use characteristics,       distributed, and climate risk disproportionately affects the
and hydro-meteorological conditions. Our results show that        world’s poorest (Byers et al., 2018). For example, the im-
communities interviewed have detailed knowledge of the im-        pact floods have is greater in developing countries. Indeed,
pacts and drivers of flash floods (deforestation and sedimen-     95 % of people are affected by floods, and 73 % of the total
tation), early warning signs (changes in clouds, wind direc-      direct damages every year occur in Asia and Africa (Alfieri
tion, and rainfall patterns), and distinct hydro-meteorological   et al., 2017). Aiming at reducing the global impacts of natural
processes that lead to flash flood events at the beginning and    hazards, the Sendai Framework for Disaster Risk Reduction
end of the wet season. Our analysis shows that the scientific     (UNISDR, 2015) calls for the increased adoption of multi-
data corroborate this knowledge and that combining local          hazard early warning systems.
and scientific knowledge provides improved understanding             A recent survey of the development of operational fore-
of flash flood processes within the local context. We high-       casting systems for floods (Perera et al., 2020) shows that
light the potential of linking large-scale global datasets with   in many countries and river basins good progress has been
local knowledge to improve the usability of flash flood warn-     made, though such progress is often limited in least de-
ings.                                                             veloped countries, hampered by a lack of monitoring net-
                                                                  works as well as human and technical capacities. These
                                                                  also often focus on large spatial- and temporal-scale river-
                                                                  ine floods, which have attracted the most attention of the
                                                                  flood forecasting, warning, and response research commu-
                                                                  nity (Alfieri et al., 2018; Kauffeldt et al., 2015; Sai et al.,

Published by Copernicus Publications on behalf of the European Geosciences Union.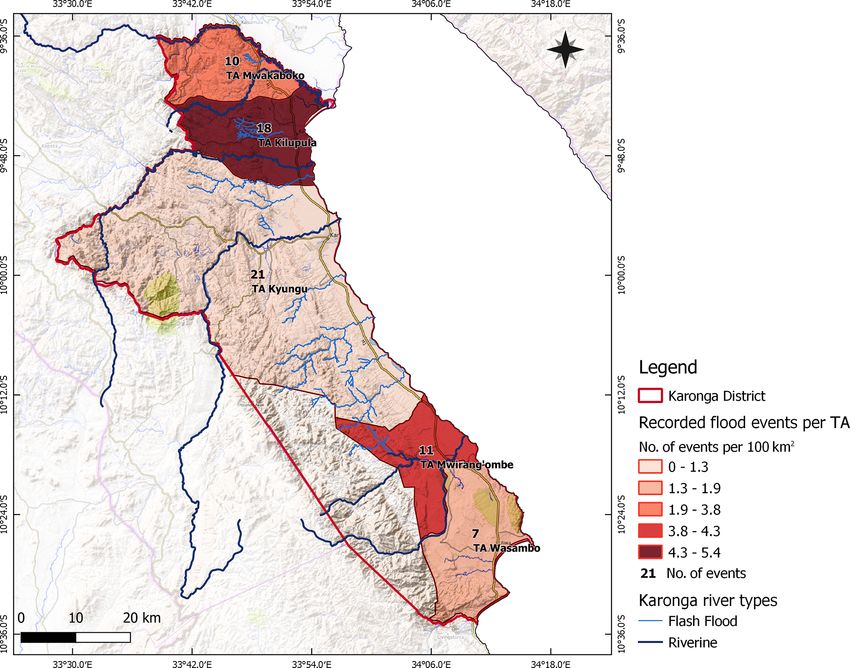
462                                                                        A. Bucherie et al.: Flash flood warnings in context

2018). Flash floods, in contrast, occur at smaller spatial and      means they are inadequate to support flash flood forecasts
temporal scales, resulting in severe damage to infrastruc-          (Emerton et al., 2016) and may be limited only to the fore-
ture and the environment, and are more deadly than river-           casting of larger-scale weather patterns.
ine floods (Jonkman, 2005). Flash flood events are charac-             Despite these technical challenges, increasing the abil-
terised by very rapid runoff generation and the sudden rise         ity to anticipate the occurrence and impacts of flash floods
of water levels out of the riverbanks. They can be caused by        stands to benefit communities at risk and organisations in-
a combination of high local precipitation rates (Doswell and        volved in disaster relief, potentially leading to faster re-
Brooks, 1996), adverse antecedent hydrological conditions           sponse and better allocation for the emergency flood relief
(The University Corporation for Atmospheric Research and            effort. However, to be effective, the early warning needs to
SENAMI-Cusco, 2010), and the geomorphological disposi-              have not only a technical basis but also a human-centred ap-
tion of the catchment to flash flooding (Georgakakos, 1986).        proach, commensurate with the knowledge of the people at
   Flash flood warning is challenging due to the response           risk (Basher, 2006). Local communities have shown to have a
times of the catchments that flash floods occur in. These           complex knowledge cutting across the full disaster risk man-
are often shorter than the time needed for decision mak-            agement cycle (Šakić Trogrlić et al., 2019) and the climatic
ing, thus preventing efficient flash flood warning responses        conditions that lead to extreme (flood) events (Lefale, 2010;
(Drobot and Parker, 2007). Additionally, the development            Orlove et al., 2010). Integration of both local and scientific
of effective warnings for flash floods is hampered by the           knowledge is recommended in all steps of early warning sys-
spatial and temporal incoherence between the understand-            tem design (Martin and Rice, 2012) and can contribute to
ing of the atmospheric and geomorphological processes that          closing the “usability” gap (Vincent et al., 2020). Plotz et al.
leads to flash floods and observation data availability, even       (2017) suggest two approaches to the integration of local
in countries with well-developed hydro-meteorological net-          knowledge and the knowledge derived from contemporary
works (Creutin and Borga, 2003). Recent decades have, how-          forecasts systems, either through validating local knowledge
ever, seen significant progress in developing warning systems       based on scientific datasets or through combining the local
in flash-flood-prone catchments (Hapuarachchi et al., 2011;         and scientific data into a consensus forecast that considers
Braud et al., 2018), though these rely extensively on the           both knowledge. The evolving people-centred paradigm to
availability of high-resolution quantitative precipitation es-      early warning also recognises that community engagement,
timates and forecasts, in particular helped by the availability     the integration of local perceptions and information tailored
of radar-based precipitation estimates and nowcasts (Creutin        to those at risk, is important to the fostering of trust in warn-
and Borga, 2003; Werner and Cranston, 2009; Javelle et al.,         ing information, thus increasing the potential of its uptake
2010). Such weather radars are practically non-existent in          (WMO, 2015, 2018). Impact-based forecasting follows this
developing countries. Medium- to high-resolution numerical          paradigm, recognising that early action by those at risk is
weather prediction (NWP) models may, however, be avail-             more likely to be taken where warning messages recognise
able and are applied in selected cases, such as in the South-       people’s local understanding of the hazard, environmental
ern Africa Region Flash Flood Guidance system (Poolman              and social cues (Calvel et al., 2020), and potential impact
et al., 2014). Flash flood guidance relies on geomorphologi-        (Luther et al., 2017; Meléndez-Landaverde et al., 2020).
cal indicators (Azmeri et al., 2016; Smith, 2003) of the sus-          In this paper we explore local knowledge and science-
ceptibility of a catchment to flash floods and triggers. Several    based information on the occurrence of flash floods in ru-
approaches to establish triggers have been developed across         ral communities in Karonga District in northern Malawi. We
the globe, based on forecasting river discharge (Drobot and         hypothesise that local knowledge can complement the in-
Parker, 2007) or rainfall thresholds (Alfieri et al., 2015; Geor-   formation contained in larger-scale global datasets and that
gakakos, 2005). These also rely on the availability of hy-          the combination of local and scientific knowledge can con-
drological observation data for calibration and validation of       tribute to the development of meaningful and trustworthy
triggers and have reached a high level of complexity. Avail-        early warning, within the context of the people-centred early
ability of these data is not equally distributed around the         warning framework (WMO, 2015, 2018). This framework
world, compounding the difficulty of making flash flood pre-        recognises that effective early warning builds on four key in-
dictions in data-poor countries, which are often also develop-      terrelated elements: (i) risk knowledge, (ii) monitoring and
ing countries. Global- and continental-scale flood forecasting      warning, (iii) dissemination and communication, and (iv) re-
systems are increasingly being developed with the availabil-        sponse capacity. Northern Malawi is an example of an area
ity of global meteorological forecast and reanalysis datasets       with high flash flood risk where the population is extremely
as well as satellite-based precipitation data (Emerton et al.,      vulnerable due to low coping capacities. Through interviews
2016), and these provide an opportunity to fill the gap where       with impacted communities, we develop a shared knowledge
national and regional forecasting systems are not available.        of risk through a joint understanding of the root causes of
However, although these offer the advantage of providing            flash floods in the area, the impacts these have, and where
consistent datasets to areas otherwise poorly served, the lim-      these are more likely to occur. In the interviews we also con-
ited resolution of global- and continental-scale NWP datasets       sider the local knowledge of meteorological and hydrologi-

Nat. Hazards Earth Syst. Sci., 22, 461–480, 2022                                     https://doi.org/10.5194/nhess-22-461-2022

A. Bucherie et al.: Flash flood warnings in context                                                                            463

cal signs communities recognise as precursors to flash flood       1175 persons and damaging 42 houses and 397 ha of crops in
events. We then interrogate available information on catch-        the small village of Mwenelupembe according to DoDMA.
ment geomorphology and hydro-meteorological conditions
derived from large-scale global models and satellite datasets
to examine if these provide useful information congruent to        3     Materials and methods
that local knowledge. Our aim is to reconcile these scientific
data with local knowledge of flash floods to inform the imple-     3.1    Building common knowledge of flash flooding
mentation of people-centred flash flood warnings and foster
the taking of early action by communities.                         To develop a common understanding of what constitutes a
                                                                   flash flood in the perception of local communities in Karonga
                                                                   District, a primary data collection campaign was conducted
2   Study area                                                     at national, district, and community levels through a series
                                                                   of semi-structured key informant interviews (KIIs) and focus
Malawi is a sub-Saharan landlocked country in south-eastern        group discussions (FGDs), following a systematic protocol
Africa, sharing its borders with Zambia, Mozambique, and           (see Sect. 3.1 of the Supplement). The KIIs at the national
Tanzania. It has an elongated orientation, following Lake          and district level and FGDs held at the community level fol-
Malawi, with its physiography dominated by the rift valley         lowed a similar questioning pattern allowing for an align-
geology. The subtropical climate and highly seasonal precip-       ment and comparison of the results obtained. We ensure that
itation variability result in Malawi being prone to weather-       all KIIs and FGDs were prepared to comply with the COREQ
related disasters (McSweeney et al., 2010). Two main sea-          (consolidated criteria for reporting qualitative research) qual-
sons exist: a wet austral summer season (November–April)           itative research criteria (Tong et al., 2007).
and a dry season (May–October). Perhaps more importantly              KII refers to qualitative in-depth interviews with people
than its disposition to weather-related hazards, the most se-      from a range of sectors selected for their knowledge on the
vere impacts from disasters result from the high vulnerabil-       specific topic (USAID, 1996). For the KIIs at the national
ity of the population, estimated at around 16.5 million, with      and district levels, we approached actors from a wide range
a poverty index of 57.9 %. Karonga is the northernmost dis-        of institutions, including representatives of disaster, meteo-
trict of Malawi, sharing a border with Tanzania. It is located     rological, and hydrological governmental institutions; uni-
along the Lake Malawi shore and has a surface of 3355 km2          versities; and disaster practitioners from locally active NGOs
and an estimated population of 380 000 in 2020. The dis-           (non-governmental organisations). As a results, we were able
trict is characterised by a steep rift escarpment separating the   to carry out six KIIs in English at the national level, includ-
hills and plateau area from the lake-shore plain (see Fig. 1).     ing with identified experts from the Malawi Red Cross So-
Characterised by strong erosion of the crystalline base rock,      ciety; the Department of Disaster Risk Management Affairs;
filling the rift valley with quaternary sediments, Karonga         the Ministry of Finance and Economic Affairs; the Depart-
soil types are primarily sandy. Land use along the flat lake       ment of Climate Change and Meteorological Services; the
shore is almost entirely cropland (mainly rice, maize, and         Ministry of Agriculture, Irrigation, and Water Development;
cassava), while the hills and plateau are covered by bushes        and Mzuzu University. At the Karonga District level, local
and open forest. The population of Karonga is rural and is         actors such as members of the district civil-protection com-
distributed mainly on the flat lake shore in small communi-        mittee, a reporter from the Nyasa Times news agency, and
ties. The economy depends upon subsistence agriculture and         NGOs active in the district (Salvation Army, Focus, and Self
fishing. With a poverty incidence of 57.1 % (IFPRI, 2019),         Help Africa) were interviewed. Based on these interviews,
Karonga District is poorer than average for Malawi. Being          we identified 12 communities that are recognised to have a
one of the most vulnerable areas to floods, Karonga is the         higher flash flood risk in Karonga District, located on dif-
focus of several projects of the Malawi Red Cross Society          ferent river basins across the district. Focus group discus-
that aim to improve preparedness, early action, and disaster       sions (FGDs) were carried out with six of these communities
response in Malawi. Flood events recur annually and are par-       (communities are identified as a group village head, GVH)
ticularly damaging in Karonga due to poor infrastructure, a        represented as circles in Fig. 1. FGD interviews bring to-
growing population, an increase of farming in flood risk ar-       gether a group of persons from a similar background guided
eas, and difficulties for the population to receive warnings       by a facilitator. We made sure that at least four persons in
due to a lack of access to communication. Large-scale dam-         the FGD were above 50 years old, with at least one partic-
aging events can occur in the district of Karonga, like the        ipant having spent more than 50 years in the community in
floods of 12–16 April 2018, affecting 4069 people, destroy-        each group. These were conducted and recorded in the local
ing 433 houses, and killing 4, as reported by the Depart-          languages, Nkhonde and Chichewa, and subsequently tran-
ment of Disaster Management Affairs of Malawi (DoDMA).             scribed and translated into English. A community drawing
Smaller-scale and isolated flash floods have also impacted         exercise was held in each village, resulting in a map gath-
the district, like the event of the 1 February 2018, affecting     ering information about historical flash flood frequency, im-

https://doi.org/10.5194/nhess-22-461-2022                                    Nat. Hazards Earth Syst. Sci., 22, 461–480, 2022
464                                                                        A. Bucherie et al.: Flash flood warnings in context

Figure 1. Karonga District location on (a) Malawi flood recurrence map based on observed flood frequency in the period 2000–2013
generated by DoDMA (ICA, 2014). (b) Topography map showing the rift escarpment, the main rivers, and the six visited villages where
focus group discussions were conducted for the research.

pacts, and perceptions of flash flood risk in different areas       18 events are reported to affect the six communities of in-
of the community. This was followed by a transect walk              terest, covering the period 2004–2018.
through the most affected part of the community. In addi-
tion, information about historical flash flood occurrence and       3.2   Mapping flash flood susceptibility based on
their impacts was collected from each community. From all                 scientific data
KII and FGD interview transcripts, local knowledge was ex-
tracted through quotes and coded into thematic analysis fol-        The susceptibility of an area to be affected by flash floods
lowing five themes: (i) flash flood definition, (ii) occurrence     depends on the geomorphometric and surface characteristics
of flash flood events, (iii) impacts of flash floods, (iv) risk     (Horton, 1945; Patton and Baker, 1976), which have a strong
perception, and (v) the signs leading to flash floods. These        influence on catchment hydrologic response to heavy rains
themes were identified partly based on deductive coding (lit-       and therefore on runoff generation. Here we map the relative
erature study) inspired by the dimensions of local knowledge        susceptibility to flash flooding of the 12 communities identi-
of the flood risk management cycle identified by Šakić Tro-        fied to have the highest flash flood risk in Karonga District.
grlić et al. (2019) and partly based on inductive coding of the    For each of the 12 communities, hydrological catchments
transcripts.                                                        are delineated, using the global SRTM (Shuttle Radar To-
   We complement these primary data with secondary data             pography Mission) v4.1 90 m digital elevation model (DEM)
on historical flash flood events with their location, date, and     (Jarvis et al., 2008). Geomorphological indicators related to
recorded impacts. These were extracted manually from five           surface and morphometric characteristics known to charac-
different sources of information: disaster reports from hu-         terise flash flood risk are identified (Bajabaa et al., 2013;
manitarian actors (IFRC-GO, 2018; UNICEF, 2019), exist-             Farhan et al., 2016; Rogelis and Werner, 2014), with some
ing global disaster data (EM-DAT, 2018; Munich RE, 2004),           linked to the local knowledge (such as indicators related to
government data, online news briefs (FloodList, 2018; Re-           slope, soil type, and land or vegetation cover). The identified
liefWeb, 2019), and national online media (Nyasa Times,             indicators and references are described in Table 1.
2019; The Nation, 2019). All datasets were filtered and con-           For each catchment, geomorphological indicators are cal-
solidated into an event database at three levels of spatial         culated and classified according to four categories character-
granularity: Karonga District, traditional authority (TA), and      ising the geometry, the hypsometry, the drainage network,
community levels (GVH). A total of 142 records of flash             and the surface of the catchments (Table A1). While the first
flood events affecting the district from 2000 to 2018 were          three categories of catchment indicators are extracted from
gathered (Bucherie, 2021). This included 48 events reported         the DEM analysis only, the surface characteristic indicators
at the district level and 38 events at the TA level. Only           are derived from the Malawian government soil type and
                                                                    land-use–land-cover (LULC) data and the normalised differ-

Nat. Hazards Earth Syst. Sci., 22, 461–480, 2022                                    https://doi.org/10.5194/nhess-22-461-2022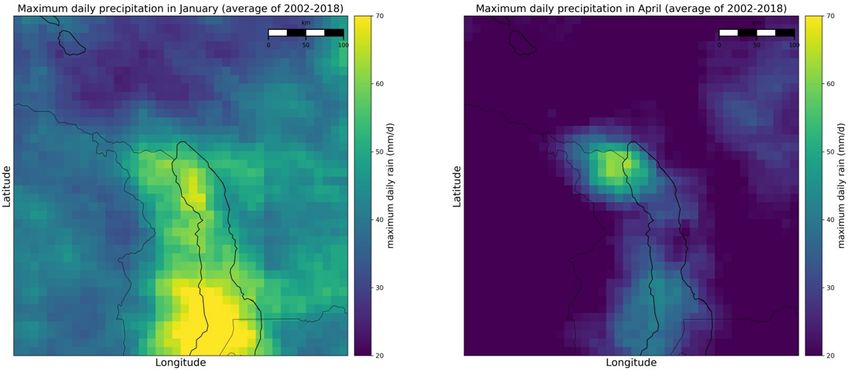
Table 1. Identified geomorphological and surface indicators related to flash flood susceptibility.

                                                                             Index                               Description                                                                             Source
                                                    Catchment geometry       Area [km2 ]                         The area of a catchment is correlated with its discharge. Bigger catchments have        Gray (1961)
                                                                                                                 a lower flash flood potential.
                                                                             Length to width (LtoW) [–]          The length-to-width ratio is a shape indicator of a catchment, inversely propor-        Schumm (1956)
                                                                                                                 tional to the flash flood potential of a catchment.
                                                                             Basin circularity (Bc) [–]          The circularity ratio (4 × π × A/P 2 ) is related to flow peak and debris flow          Miller (1953)
                                                                                                                 occurrence. The more circular the basin is, the more flash flood prone it is con-
                                                                                                                 sidered to be.
                                                                             Time of concentration (Tc ) [min]   Flash flood potential increases in basins with a lower time of concentration.           Kirpich (1940)
                                                                                                                 It is computed using Kirpich’s formula, where L is the longest flow path to the
                                                                                                                 remotest point altitude H from the outlet at elevation h: Tc = 0.01947×L0.77 ×

                                                                                                                   H −L −0.385 .
                                                                                                                      L

https://doi.org/10.5194/nhess-22-461-2022
                                                    Hypsometry               Average slope [◦ ]                  The average slope is an indication of the flashiness of a watershed, proportional       Linsey et al. (1982)
                                                                                                                 to flood susceptibility. The slope is computed in degrees from the DEM us-
                                                                                                                 ing second-degree polynomial adjustment algorithm (Zevenbergen and Thorne,
                                                                                                                                                                                                                                             A. Bucherie et al.: Flash flood warnings in context

                                                                                                                 1987).
                                                                             Rel_Relief [–]                      The relief (H ) is the difference between the highest and the lowest elevation          Melton (1957)
                                                                                                                 point of the catchment. The relative relief is the relief (H ) divided by the basin
                                                                                                                 perimeter (P ). It is related to the event magnitude.
                                                                             Elv_RR [–]                          The elevation relief ratio is defined as the relief (H ) divided by the length of the   Oruonye (2016)
                                                                                                                 catchment.
                                                    Drainage network         Drainage relief ratio (D_RR) [–]    The drainage relief ratio corresponds to the drainage relief (maximum elevation         Schumm (1956)
                                                                                                                 of the drainage system minus the outlet elevation) divided by the longest stream
                                                                                                                 length.
                                                                             Drainage density (Dd) [km−1 ]       The cumulative river length over the area. This has a direct correlation with           Patton and Baker (1976)
                                                                                                                 flood potential.
                                                                             Bifurcation ratio (Rb) [–]          The
                                                                                                                 P bifurcation ratio of a basin is inversely linked to the flash flood risk: Rb =        Strahler (1957), Schumm (1956)
                                                                                                                    N u/N u+1, where N u is the total number of stream segments of order u and
                                                                                                                 N u + 1 is the number of segments of the next higher order.
                                                    Surface properties       Soil type                           Soil type data are ranked according to the clay content and reclassified from 0         Smith (2003), Tincu et al. (2018)
                                                                                                                 to 10. The infiltration rate decreases with the clay content, increasing runoff and
                                                                                                                 flash flood susceptibility.
                                                                             LULC                                Land-use–land-cover data are reclassified into classes from 0 to 10 depending           Smith (2003), Tincu et al. (2018)
                                                                                                                 on their susceptibility to increased flash flood risk.
                                                                             NDVI                                The normalised difference vegetation index is used as an indicator of the green-        Smith (2003), Tincu et al. (2018)
                                                                                                                 ness of the vegetation. Data are extracted for two periods, at the beginning (21 to
                                                                                                                 31 December 2017) and at the end (21 to 31 March 2018) of the wet season.
                                                                                                                 High NDVI values represent dense vegetation, while low NDVI values indicate
                                                                                                                 bare soils and increasing flash flood risk.

Nat. Hazards Earth Syst. Sci., 22, 461–480, 2022
                                                                                                                                                                                                                                             465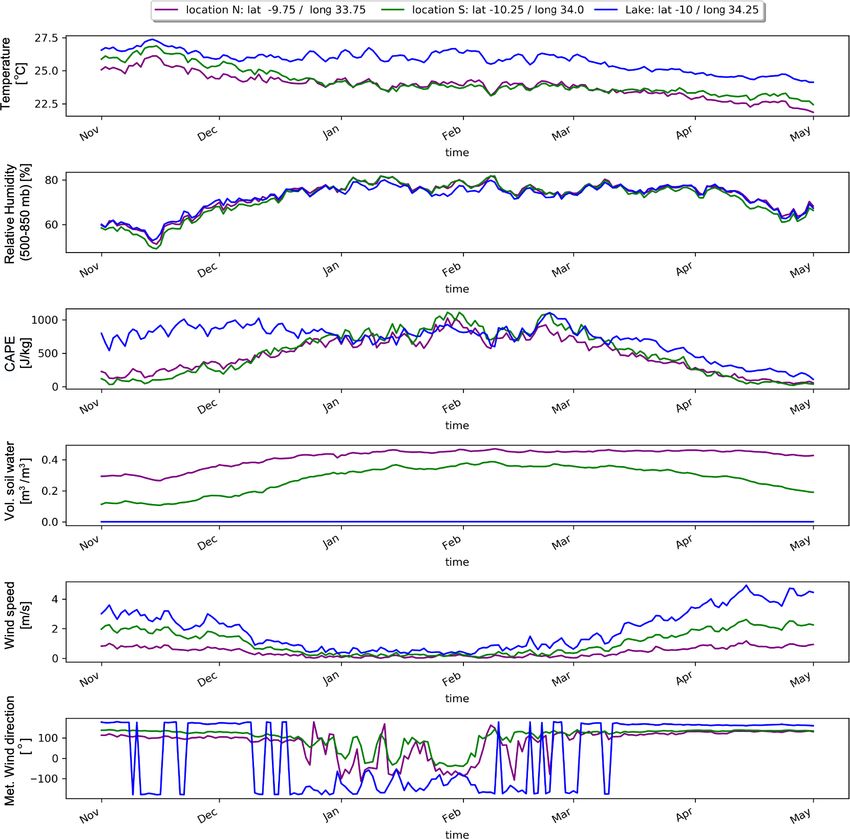
466                                                                         A. Bucherie et al.: Flash flood warnings in context

ence vegetation index (NDVI) Copernicus Global Land Ser-           season for computational reasons, as well as due to flash
vice 300 m product (Roujean et al., 2018). All geomorpho-          flood events occurring in the wet season. GSMaP was se-
logical indicators are normalised from 0 to 1 according to         lected given the high spatial (0.05◦ ) and temporal (hourly)
their contribution to the susceptibility of flash flooding.        resolution, as well as relatively low latency. Historical ex-
   Different methods of weighting the influence of each geo-       treme rainfall patterns are explored spatially and temporally
morphological parameter can be used depending on the con-          over the district. In addition, maximum daily 1 and 3 h rain-
text and the scale of each case study (Azmeri et al., 2016).       fall totals are extracted to characterise precipitation intensity
Some studies use equal weighting (Zogg and Deitsch, 2013)          associated with the 18 catalogued flash flood events affect-
or weighting based on the indicator ranking (Karmokar and          ing the six communities for the 2004–2018 period. Moving
De, 2020). Here we apply a weighted method based on prin-          windows of 6 h, 1, and 3 d cumulative rainfall are extracted
cipal component analysis (PCA) to reduce the dimensions in         as indicators of antecedent cumulative precipitation. These
each class (Chao and Wu, 2017; Rogelis and Werner, 2014).          precipitation indicators and associate statistics are extracted
Based on the four principal component results, a ranking of        from the GSMaP data at locations corresponding to the cen-
flash flood susceptibility of the 12 catchments is calculated,     troids of the catchments of interest. Time series are analysed
following Eq. (1), representing the inherent potential of each     visually for each flash flood event.
catchment to generate a flash flood in the case of heavy rain.        Large-scale hydro-meteorological conditions are derived
PC[name] refers to principal components related to the ge-         from the ECMWF ERA5 climate reanalysis dataset (Hers-
ometry, hypsometry, surface, and drainage network. The lin-        bach et al., 2020) provided through the Copernicus Climate
ear coefficients a, b, c, and d are the weights applied to each    Change Service (C3S, 2019). This dataset is selected given
of these classes.                                                  its availability and as it provides the same parameters and
                                                                   at similar temporal and spatial scales as the forcing data
FFSuscept = a × PC[geom] + b × PC[hypsom]
                                                                   used in global hydro-meteorological forecast models such as
         + c × PC[drain] + d × PC[surf]                     (1)    GLOFAS (Global Flood Awareness System; Alfieri et al.,
   Validating a map of flash flood susceptibility is a challenge   2013). Daily data are extracted for the 2000–2018 period
where there is little historical data (Alam et al., 2020). For     from ERA5 over a geographical box that encompasses the
data-rich catchments, machine learning techniques use his-         study area (8–12◦ S, 32–36◦ E). Variables considered include
torical flash flood data to calibrate the flash flood suscepti-    the 2 m surface air temperature, the 2 m dew point tempera-
bility map (integrating morphometric and precipitation indi-       ture, the volumetric soil water content of the first 7 cm of the
cators) and have been tested on the catchment-specific study       land surface, the relative humidity of the deep troposphere,
scale (Arabameri et al., 2020; Pham et al., 2020). Here we es-     the CAPE indicator (surface-based convective available po-
timate the weight (a, b, c, and d) of each class by calibrating    tential energy), and the surface u and v wind vectors.
them against the estimated relative flash flood frequency for         These variables are extracted from the ERA5 data at three
each catchment as indicated by the communities interviewed.        locations (see Fig. 2), one in the northern part of the dis-
The best fit is defined by minimising the root mean square         trict (N), one in the southern part (S), and one in Lake
error (RMSE) between the modelled flash flood susceptibil-         Malawi (L). Daily averages of the selected ERA5 variables
ity (FFSuscept ) and the normalised observations of flash flood    are extracted for the period 2000–2018 to analyse seasonal
frequency.                                                         variations. To study the larger-scale hydro-meteorological
                                                                   patterns and conditions associated with historical flash flood
3.3   Identifying hydro-meteorological conditions                  events, the same ERA5 hydro-meteorological variables are
      associated with flash flooding                               extracted and averaged over four regions (see Fig. 2), for up
                                                                   to 3 d before each of the catalogued flash flood events. These
Precipitation and large-scale hydro-meteorological indicator       regions are selected based on the precursor signs reported by
datasets are selected, guided by the knowledge gained from         communities interviewed and include Karonga (region W),
communities on the signs and triggers they consider pre-           Lake Malawi (region S), and the areas to the north-west and
cursors to flash floods. The spatial and seasonal distribu-        north-east of Karonga (region NW and region NE, respec-
tion of indicators derived from the datasets are analysed to       tively).
understand if these corroborate with the reported signs and
particularly if these reflect conditions associated with flash
floods during and prior to the catalogued historical flash flood   4     Results
events.
   Precipitation is derived from the GSMaP (Global Satellite       4.1    Building knowledge about flash flooding
Mapping of Precipitation) satellite-based precipitation prod-
ucts (Aonashi et al., 2009; Okamoto et al., 2005; Kubota           Local knowledge about flash flooding in Karonga District has
et al., 2007) and extracted for the wet seasons of the 2002–       been compiled from all KIIs, FGDs, transect walks, and com-
2018 period. We limit the extraction of these data to the wet      munity drawings, through the extraction of quotes from inter-

Nat. Hazards Earth Syst. Sci., 22, 461–480, 2022                                    https://doi.org/10.5194/nhess-22-461-2022
A. Bucherie et al.: Flash flood warnings in context                                                                                 467

Table 2. Monthly flood event frequency based on 2000–2018 secondary data collection (43 recorded events) and associated proportion of
short-duration (≤ 3 d) and local (affecting only 1 TA) recorded flood events.

                                                                      December   January    February    March    April
                  Number of recorded events                                  6        15           4         7     11
                  Percentage of short-duration floods (≤ 3 d)               83         80        100        86      55
                  Percentage of local events (affecting only 1 TA)        66.6       61.5         50      38.5    33.3

                                                                             addition, fast-onset floods are known sometimes to co-
                                                                             incide with slow-onset riverine floods in communities in
                                                                             the north of Karonga, a scenario described as resulting
                                                                             in larger-scale, longer-duration, and more severe disas-
                                                                             ters.

                                                                          ii. Occurrence of flash flood events. The analysis of the
                                                                              data from the KIIs and FGDs, supported by the analysis
                                                                              of the secondary data on the spatial and temporal oc-
                                                                              currence of flash floods, reveals that flash floods happen
                                                                              between one and eight times per year in Karonga Dis-
                                                                              trict, mostly in January and in March–April, and gen-
                                                                              erally overnight. In addition, shorter-duration and more
                                                                              localised flash flood events are reported to occur in Jan-
                                                                              uary, while longer-duration floods affecting larger ar-
                                                                              eas are observed in April (Table 2). The frequency of
                                                                              flash floods is found to be higher in the northern part of
                                                                              the district, in Kyungu and Kilipula TA (see Fig. 3). In
                                                                              addition, April events affect mainly catchments in the
                                                                              northern TAs, while January events may affect any of
Figure 2. ERA5 grid resolution; x, y point locations (yellow dots);           the catchments in the entire district.
and four regions (NW: north-west, NE: north-east, W: west, and
S: south) used for large-scale hydro-meteorological pattern analy-       iii. Impacts of flash floods. Information about the impact
sis.                                                                          of flash floods in Karonga is extracted from the inter-
                                                                              views and the analysis of historical impact datasets. The
view transcripts. We reported the knowledge extracted here,                   main impact of flash floods experienced by Karonga’s
structured along the five themes identified in the collection                 communities is on agriculture, as flash flood events
and analysis of the data. Additionally, the risk knowledge es-                are reported to systematically sweep away several
tablished in the themes about the (ii) occurrence of flash flood              hectares (ha) of crops (either recently planted or fully
events and (iii) impact of flash floods is based on the integra-              grown) and sometimes livestock. In addition, communi-
tion and corroboration of the FGDs and KIIs (primary data)                    ties mentioned that flash floods can destroy parts of vil-
with the flash flood occurrence and impact analysis derived                   lages, irrespective of the type of buildings. Communi-
from the secondary data.                                                      ties report an increase in flood impact since 2007. Based
                                                                              on our historical data, we estimate that when a flood oc-
  i. Flash flood description. Communities report that they                    curs in the district it has a 50 % chance of affecting at
     experience sudden floods, induced by intense and short                   least 300 households and 200 ha of crops and killing at
     rainfall events, and that these form the main type of                    least one person. The communities also indicated that
     weather-induced disasters in northern Malawi. All com-                   the impact of floods is higher in April and also higher in
     munities describe these flood events as unexpected                       the north of Karonga. This is attributed to the combina-
     and occurring “without notice”, associated with intense                  tion of flash floods with riverine floods in the Songwe,
     power of river flows, erosion of river banks, and rivers                 Kyungu, Lufira, and North Rukuru rivers, as well as
     bursting their banks. Participants identified that the to-               the higher population density in the north. These pro-
     pography is known to govern the occurrence of flash                      longed and larger-scale flood events are reported to trig-
     floods in Karonga and that the most affected areas are                   ger cholera outbreaks in the region. Flash flood events
     on the flat rift valley floor close to the escarpment. In                occurring in January can, however, affect the entire dis-

https://doi.org/10.5194/nhess-22-461-2022                                        Nat. Hazards Earth Syst. Sci., 22, 461–480, 2022
468 A. Bucherie et al.: Flash flood warnings in context
Figure 3. Number of recorded flood events per 100 km2 for every TA (collected for the period 2000–2018), with the total number of events
recorded for each TA indicated as labels.
trict. Their impacts on communities are more spatially Malawi. Charcoal production, and the use of wood
contained but may be more severe at that small scale. to build stronger burnt brick structures have risen:
“Bushfires and overgrazing animals are leaving the
iv. Perceived drivers of flash flood risk. Extracted from the soil bare and prone to flood.” In addition, the inten-
KII and FGD interview transcripts, a summary of six sification of agriculture along the river banks is re-
factors perceived to increase flash flood risks in Karonga ported to reduce the natural control of the water ve-
District is presented below. Quotes made by different locity, increasing the spread of water on farmland.
community members are provided, where relevant.
– Climate change. A shift toward shorter and more
– River sediments. Karonga has mostly ephemeral intense rainy seasons (December to March instead
rivers with heavily silted river beds, which are dry of November to April) is observed by communities,
from the months of August to December. Increasing leading to more frequent and devastating events. An
sedimentation of the river beds and changes in river intensification of rain events and a change in me-
behaviour are reported by elderly people. High sed- teorological patterns is described by elderly peo-
imentation in rivers is recognised to have increased ple, making the indigenous prediction more diffi-
flood occurrence and the exposure of people liv- cult than before.
ing along these rivers. “Before, water would swell
within its course and go back to normal without – Geomorphology. Fast-running water is experienced
any damage. Today, rivers are full of sand, block- to come from the steep slopes of the mountains of
ing culverts and preventing water from flowing in the escarpment and affects villages in the low land
its original course.” River profiles where these cross areas, making the proximity to the hills a factor of
the lake-shore plain are very flat, and their channels increasing risk.
were observed during our transect walks to not be – Soil type. The relation between flash floods and soil
deep enough to accommodate peak discharges. type is expressed in terms of erodibility of the soil:
– Land use. The sedimentation in the river courses “The soil, easily swept away during flood, is dis-
is identified by all communities to be the result persed in agricultural fields and lowers soil fertil-
of deforestation in the upstream catchments, which ity.” In the northern communities, a relation be-
started in the 1970s, after the independence of tween the flood duration and the clay content in the
Nat. Hazards Earth Syst. Sci., 22, 461–480, 2022 https://doi.org/10.5194/nhess-22-461-2022A. Bucherie et al.: Flash flood warnings in context 469
soil, lowering the infiltration capacity in the lake b, c, and d) for the final flash flood susceptibility ranking
margin plains, is observed. of the selected catchments. The thick solid line shows the
– Socio-economic vulnerability. The rapid increase normalised flash flood susceptibility indicators, found from
of population and poverty, associated with poor the weighted contributing factors: geometry (0.5), hypsome-
settlement and farming practices, is perceived to try (0.1), drainage (0.2), and surface (0.2), where the values
have exacerbated the vulnerability of communities in brackets are the weights in Eq. (1) with the best fit (RMSE
in the district. of 0.31). The resulting indices are mapped in Fig. 5.
The increased flash flood susceptibility of catchments ap-
pears to be mostly driven by catchment geometry and is in-
v. The signs leading to flash floods. The local knowledge versely proportional to the area and the time of concentra-
of the signs experienced prior to flash floods are cate- tion (Tc) of the catchment, together explaining 63 % of the
gorised into two types of observations. variance of the geometric class. While the high frequency of
– Meteorological signs. Community knowledge re- flash floods experienced by the communities of Iponga and
vealed that flash floods are associated with strong Nkhomi are explained mainly by their small upstream catch-
south-easterly winds at the end of the wet season. ments size (lower than 10 km2 ) and Tc of about 40 min, the
In addition, communities in the south of Karonga lowest flash flood frequency observed in the Sabi community
District described flash floods to be associated with can be explained by the largest contributing area (335 km2 )
highly localised storm events and thunder, black and associated Tc (∼ 4 h).
and slow-moving convective clouds, and change- The derived weights attribute an equally important influ-
able wind direction. In addition, a rise in temper- ence to both the drainage characteristics (controlled essen-
ature before flash floods was reported by all com- tially by the drainage relief ratio) and the surface charac-
munities. teristics. While the higher flash flood susceptibility of the
– Hydrological signs. When water velocity and vol- Iponga and Nkhomi catchments is also explained by the high
ume increase in the rivers, the amount of debris car- drainage relief ratio, spatial variation of the susceptibility re-
ried as well as the colour of the water changes (turn- lated to surface characteristics is mainly driven by the soil
ing brown, black, milky, or red), announcing that a types and the vegetation cover. A strong variability in the
major flood is coming. In addition, at the lake mar- NDVI is observed between the north and the south, par-
gin, the soil moisture and water table are known to ticularly at the beginning of the wet season, exposing the
be high at the end of the wet season, increasing the south (with more bare soils) to a higher susceptibility to
duration of floods and consequent impacts. When flash floods. The high susceptibility of the Iponga catchment
the soil is dry, water from the flash floods will infil- is additionally explained by the presence of clayey soils in
trate faster in the farmlands. the north, decreasing the infiltration capacity. Finally, catch-
ment hypsometry results do not correlate well with field ob-
4.2 Geomorphological analysis of flash flood servations. The resulting low relative flash flood susceptibil-
susceptibility in Karonga District ity of the Kyungu, Kibwe, and Kasantha catchments in the
north of Karonga, which were not visited, confirms these
All catchments that drain the escarpment are reported to be being ranked as less dangerous by Karonga experts through
susceptible to flash flooding in Karonga District, although the KIIs.
the level of susceptibility may vary between catchments. The
results from the flash flood frequency estimation from each 4.3 Hydro-meteorological conditions associated with
community was fundamental to understanding the spatial dif- flash flooding
ference in flash flood susceptibility from the geomorphol-
ogy and surface characteristics of the upstream catchments Guided by local knowledge about the hydro-meteorological
upstream. The normalised indicator values and PCA com- signs associated with flash flood events and the temporal dis-
posite results calculated for each catchment are presented in tribution of flash flood events through the wet season, we
Sect. 4.2 in the Supplement; the PCA component loadings analysed the characteristics of extreme rainfall and large-
are found in Table A1. scale spatial and intra-seasonal hydro-meteorological pat-
The relative catchment susceptibility results for the four terns that could lead to flash floods in Karonga.
geomorphological classes – geometry, hypsometry, drainage The analysis of historical precipitation indicates that heavy
system, and surface characteristics – reveal differences from rainfall events are not homogeneously distributed spatially
north to south, as shown in Fig. 4. The dashed coloured lines and are distinctly different at the beginning and at the end of
show the results from the PCA for each of the four categories the wet season.
of catchment characteristics. Black triangles show the nor- Figure 6 shows the maximum daily precipitation found
malised frequency of flash floods as reported by the commu- with the GSMaP data, averaged over the time period 2002–
nities visited, which were used to estimate the weights (a, 2018 for the months of January and April, the months in
https://doi.org/10.5194/nhess-22-461-2022 Nat. Hazards Earth Syst. Sci., 22, 461–480, 2022470 A. Bucherie et al.: Flash flood warnings in context
Figure 4. Results from the PCA of the four catchment characteristic categories and weighted flash flood catchment susceptibility. The black
dots correspond to the normalised estimation of the flash flood frequency of the communities visited (OBS: observed). Catchments are
ordered from north to south (left to right).
reveals that extreme rainfall events are more frequent in Jan-
uary than in April, though the maximum hourly precipitation
rates are comparable in both months (see Sect. 4.3.1 in the
Supplement). All rainfall events associated with the 18 his-
torical flash flood events were detected by GSMaP. It con-
firms that extreme rainfall peaks of at least 30 mm h−1 are as-
sociated with events localised in the north of Karonga, either
at the beginning or at the end of the wet season. In addition,
flash flood events that correspond to low GSMaP rainfall sig-
nals (peak rain below 10 mm h−1 ) are observed mainly in the
south of Karonga, in January and February (see Sect. 4.3.2 in
the Supplement).
4.3.1 The large-scale hydro-meteorological analysis
The large-scale hydro-meteorological analysis on seasonal
patterns and conditions associated with flash floods in north-
ern Malawi helps to explain the extreme rainfall patterns in
northern Karonga. Figure 7 presents the standard daily aver-
ages for the selected variables spanning the 2000–2018 pe-
riod, derived from ERA5 hourly reanalysis and sampled at
three locations (Fig. 2).
The relative humidity, which provides an indication of the
water saturation of the deep troposphere, strongly increases
during the first part of the wet season, from mid-November
to end of December. The average relative humidity is at its
maximum from January to mid-February, approaching 80 %,
and is slightly lower from mid-February to the end of March.
Figure 5. Relative flash flood susceptibility of the catchments in The relative humidity of the troposphere then drops signifi-
Karonga District. cantly in April.
The soil moisture is generally lower in the south than in
the north of Karonga. It gradually rises from November to
which flash floods are reported by communities to occur. February, then drops at the end of the wet season in the south
This reveals that extreme rainfall rates are constrained to while remaining high in the north. These results confirm the
the northern part of Karonga at the end of the wet season precipitation observations, showing a prolonged rainy season
in April, while these are distributed more homogeneously in in April in the north of Karonga, but could also be attributed
January. A more detailed analysis of the hourly rainfall rate to differences in soil characteristics and vegetation.
Nat. Hazards Earth Syst. Sci., 22, 461–480, 2022 https://doi.org/10.5194/nhess-22-461-2022A. Bucherie et al.: Flash flood warnings in context 471
Figure 6. Maximum daily rainfall over 2 different months of the wet season (January and April), averaged for 15 wet seasons (2002/03
to 2017/18). Yellow colours indicate areas with higher maximum daily rainfall (mm d−1 ) recorded on average for the month. The maps are
centred on northern Malawi; black lines represent the boundaries between countries and Lake Malawi.
The convective available potential energy (CAPE) is between two different regimes, can lead to either orograph-
highly variable within the wet season. It shows a rising trend ically enhanced rainfall in the north or more scattered con-
at the beginning of the wet season and a falling trend at the vective conditions in the south.
end of the wet season, with averaged maximum standard val-
ues of 1000 J km−1 at the end of January revealing a maxi- 4.3.3 The late wet season
mum atmospheric instability. In addition, the daily variability
of CAPE is higher in January. The late wet season is driven by an extra-tropical climate
The wind is generally stronger before December, becom- regime associated with the Mozambique Current coming
ing weaker at the beginning of the wet season. It reaches its from the Indian Ocean. This is consistent with the strong
minimum intensity in January and February and increases winds from the south observed along Lake Malawi. When
again towards the end of the wet season. We observe that this pattern forms, clouds converge toward the northern part
winds are stronger over the lake and in the south than in of Karonga, where rainfall is orographically enhanced. The
the north of Karonga at the end of the wet season. Dur- north of Karonga experiences a longer rainy season as a con-
ing November–December and March–April, the wind is uni- sequence, with frequent, intense, and continuous rainfall un-
formly south-easterly over land and southerly over the lake. til the end of April, while flash flood risk is considerably re-
During the months of January and February, wind direction is duced in April in the south of Karonga.
more erratic, characterised by an alternation between north- While orographic effects in Karonga have been docu-
westerly and north-easterly winds over Karonga and, respec- mented (Nicholson et al., 2014), the differences between the
tively, north-westerlies and southerlies over Lake Malawi. orographic events of the late wet season and the predomi-
Our analysis of these variables confirms our hypothesis nantly convective events of the early wet season as a trig-
of two large-scale hydro-meteorological patterns in northern ger for flash floods have not been previously studied. These
Malawi, characteristic of the early and late wet season, re- distinct patterns do, however, corroborate the differences ob-
spectively. served by local communities as reported in the FGDs held.
4.3.2 The early wet season 4.4 Linking local and scientific knowledge about flash
flooding in Karonga District
The early wet season is characterised by a maximum atmo-
spheric instability in January, with high temperatures and rel- The local knowledge of the communities in Karonga Dis-
ative humidity. This is when the Intertropical Convergence trict about the conditions that lead to flash floods, which we
Zone (ITCZ) is positioned over Malawi. This suggests that obtained through the FGDs and supported by the KIIs, was
the convective storm risk associated with the tropical climate used to guide the diagnosis of scientific data in the explo-
regime is higher at the beginning of the wet season. During ration of the factors contributing to flash flood risk in north-
this period, extreme rainfall events are more frequent, more ern Malawi. In this section we synthesise this local knowl-
localised, and of shorter duration. Such convective events oc- edge and explain how the scientific diagnosis corroborates
cur evenly distributed over the district. The wind, alternating local knowledge. Table 3 shows the results for the three main
https://doi.org/10.5194/nhess-22-461-2022 Nat. Hazards Earth Syst. Sci., 22, 461–480, 2022472 A. Bucherie et al.: Flash flood warnings in context
Figure 7. ERA5 standard daily averaged variables over the period 2000–2018 for the three locations as introduced in Fig. 3 representing
the north and the south of Karonga and Lake Malawi. Six hydro-meteorological variables are shown: the surface temperature, the relative
humidity of the troposphere, the CAPE factor, the volumetric soil water, the wind speed, and the meteorological wind direction.
themes of analysis (left column), linking the local to scien- els these use are too coarse to provide reliable hydrological
tific knowledge (middle and right columns, respectively). predictions of flash floods at the scale of catchments suscep-
tible to flash flooding (Emerton et al., 2016; Gründemann
et al., 2018), or there are insufficient in situ data to correct
5 Discussion bias in forecasts derived from such global systems (Bischin-
iotis et al., 2018; Lavers et al., 2019). Despite this, our re-
5.1 Validating local knowledge in predictions of flash sults show that larger-scale patterns that are identified to be
floods linked to the occurrence of flash floods in Karonga District
based on local knowledge can be discerned in the coarser
Karonga District, as well as more generally most countries global-scale models and remote sensing datasets. This high-
in southern Africa, lacks the availability of high-resolution lights the opportunity of local knowledge in helping bridge
quantitative precipitation forecasts and high-resolution hy- the temporal- and spatial-scale gap (Plotz et al., 2017) and
drological models that provide plausible prediction of flash in deriving flash flood warnings by interpreting forecasts of
floods (Hapuarachchi et al., 2011; Braud et al., 2018). larger-scale patterns associated with flash floods in the dis-
Global- and continental-scale flood forecasting systems trict using indicators that reflect local knowledge. Plotz et al.
(Emerton et al., 2016; Alfieri et al., 2018) potentially fill this (2017) propose two approaches to combining local and sci-
gap, but the current meteorological and hydrological mod-
Nat. Hazards Earth Syst. Sci., 22, 461–480, 2022 https://doi.org/10.5194/nhess-22-461-2022A. Bucherie et al.: Flash flood warnings in context 473
Table 3. Synthesis of the local and scientific knowledge on flash flooding in northern Malawi. FF: flash flood. LK: local knowledge.
Local knowledge Scientific knowledge
Spatial–temporal occurrence of flash floods
Spatial Communities experience differences in FF Geomorphological features, surface characteristics, and
occurrence and frequency in the different catchments in precipitation patterns explain spatial differences in FF
annual frequency Karonga, from one event every 3 years to susceptibility and impacts.
three events per year.
Seasonal trend FFs are experienced mostly in March–April, the The intra-seasonal hydro-meteorological analysis reveals
months receiving the most rain, and sometimes different hydro-meteorological conditions between the
January, related to the first precipitation events start (January) and the end of the wet season (April), potentially
of the wet season. leading to two types of flash flood conditions.
Diurnal trend FFs are observed mostly at night. Historical GSMaP precipitation events associated with flash
flood events mainly occur during the evenings from 18:00–
21:00 LT (local time) until the early morning at 02:00–
04:00 LT in Malawian local time. In addition, a diurnal hydro-
meteorological cycle is observed between the land and the lake.
Geomorphology and surface characteristics
Soils Communities describe clayey soils as an Karonga soil type analysis reveals a large fraction of sandy soils
aggravating factor, increasing flood duration, in the district. More clayey soils are present in the north,
while they experience that sandy erodible soils potentially linking up with the longer flood durations reported
have negative impacts when transported on in the north.
crops and grass fields.
Vegetation All communities see vegetation degradation in NDVI analysis shows a lower vegetation greenness in the south
the upstream catchment forest as a factor that of Karonga at the beginning of the wet season, exposing the
increases flash flood risk. south of Karonga to higher flash flood risks. This either is due
to a more intense deforestation rate in the south, more visible
during the dry season, or reflects the natural variability of
vegetation between the north and the south of Karonga.
Catchment Communities relate the proximity of the The analysis of the catchment time of concentration (40 min for
geometry escarpment and hills from their village to small catchments to 4 h for bigger catchments), an indicator of
increased flash flood risk. catchment geometry, shows the highest correlation with local
spatial observation on flash flood frequency.
Hydro-meteorological knowledge
Precipitation Short and intense precipitation events are Short and intense precipitation events are indicated as the main
indicated as the main trigger of flash floods for trigger of flash floods for all communities.
all communities.
Temperature An increase in temperature is experienced Daily temperatures from ERA5 do not reveal any specific
before flash flood events. increase before FF events. However, a rise in humidity is
observed in ERA5 data before flash flood events, potentially
linked to an increase in ambient temperature.
Soil moisture The higher soil water saturation in the flat plain ERA5 volumetric soil water data confirm higher values during
along Lake Malawi in April is responsible for the late wet season and in the north.
an increased flood duration.
Wind Change in wind direction and strength are ERA5 wind data reveals two different regimes at the beginning
associated with flash flooding. Some and at the end of the wet season, with higher instability during
communities reported strong winds from the the early wet season potentially linked to LK observation.
lake as a precondition to flash floods.
Storms Localised storms, with rotating black clouds ERA5 CAPE and relative humidity are good indicators of
and thunder, are described as conditions the susceptibility of convective events developing. These show
associated with flash floods. promising signals of FF potential during the early wet season.
https://doi.org/10.5194/nhess-22-461-2022 Nat. Hazards Earth Syst. Sci., 22, 461–480, 2022474 A. Bucherie et al.: Flash flood warnings in context entific knowledge in forecasts: a consensus forecast approach catchments based on local knowledge, corroborated by the and a science integration approach that validates the accuracy scientific assessment of catchment flash flood susceptibility. of forecasts based on local knowledge using scientific data. We argue that this contributes to more effective dissemina- Following the second approach, we extract the identified in- tion of guidance on the potential occurrence of flash floods, dicators of the critical hydro-meteorological conditions as- as it considers the knowledge and perceptions of the recipi- sociated with the 18 flash flood events recorded in Karonga ents. and use a simple model to test the predictability of the binary Although our sample size of 14 KIIs and 6 guided FGDs occurrence of flash floods in the Karonga District. The two with 7 to 11 persons allowed us to capture the diversity of indicators derived from ERA5 found to be the best predictors local knowledge in the area, we cannot say data saturation of conditions that may lead to a flash flood are the maximum was fully reached. Most likely a larger sample size of FGDs hourly peak in the CAPE in the 3 d before an event and the would have allowed for a further in-depth spatial charac- maximum hourly relative humidity of the troposphere 1 d be- terisation of local knowledge and shed light on minor dis- fore the flash flood. The latter indicator was found to be a crepancies such as why communities considered the Kasisi good predictor in the early wet season only, confirming that catchment to be more susceptible than the Sabi catchment, in this period flash floods are primarily induced by convective despite the contrary being suggested by the geomorpholog- storms. Conversely, antecedent rainfall conditions are found ical characteristics. Nevertheless, the validation of the local to have more predictive potential during the late wet sea- knowledge obtained through the FGDs and KIIs evidences son, particularly for the catchments in the north. We explore the complementarity of local and scientific knowledge, even the predictability of the binary occurrence of the observed with the coarse-scale global datasets explored here, imply- flash flood events with these simple indicators at three spa- ing the potential of blending these to provide effective early tial scales: (i) at the scale of predicting the flash flood events warning of flash floods. in each catchment, (ii) at the scale of predicting a flash occur- ring in the north and or in the south of Karonga District, and 5.2 Combining local and scientific knowledge toward (iii) at the scale of predicting the occurrence of flash flood people-centred early warning systems events in the district as a whole. Clearly the sample size is small, particularly for predictions of flash floods occurring None of the communities we interviewed in Karonga District in individual catchments. Our results show there is little skill had access to a formal warning before recent events, based on in the prediction of flash floods at the scale of the individ- their knowledge of neither the hydro-meteorological condi- ual catchments, as the reasonably high probability of detec- tions they recognise as possible precursors to flash floods nor tion (POD) is complemented by a high probability of false guidance from SARFFG issued through the DCCMS. Given detection (POFD). However, skill improved markedly in pre- the knowledge of the communities of the catchments most dicting the binary occurrence of flash floods when pooling susceptible to flash floods and the hydro-meteorological con- warnings for either the northern or southern catchments and ditions that may lead to flash flood events and that these con- further still at the scale of the district as a whole (see Sect. 5.1 ditions can be identified in large-scale hydro meteorological in the Supplement). These results underscore the complex- datasets such as ERA5, there is clear potential in combining ity of predicting the occurrence of flash floods in triggering this information into a form of a consensus warning (Plotz warnings at the local scale, particularly using coarser global et al., 2017) of elevated flash flood risk in the district. Devel- datasets in the absence of available high-resolution observa- oping warning messages that visualise the indicators that are tional data and numerical weather predictions. Despite this understood by the recipients of the warnings can contribute difficulty of providing predictions at the very local scale, to the credibility of these warnings, helping close the “usabil- the results do highlight the potential these datasets have in ity” gap (Vincent et al., 2020) and foster two-way communi- providing guidance on the occurrence of flash floods in the cation between observations of the communities and warning district. Predictions of the likely occurrence of a flash flood provision (O’Sullivan et al., 2012; Basher, 2006). The taking event, either differentiated to the north or south of the district of protective action by recipients of warning messages, if in- or in the district as a whole, could be translated to flash flood deed these are received, depends on several factors, includ- guidance in the individual catchments based on the knowl- ing understanding, trust in the provider of warnings, own- edge of the communities of the relative susceptibility of each ership, and personal and contextual relevance (Parker et al., of the catchments in the district and predicted large-scale me- 2009; Molinari and Handmer, 2011; Salit et al., 2013). Shah teorological conditions. This approach is in principle similar et al. (2012) found that confirmation of the warning content to differentiated rainfall thresholds derived to support flash through the observation of visual cues in their environment flood guidance statements such as those used in the South- that confirmed the warning content contributes to the tak- ern Africa Region Flash Flood Guidance (SARFFG) system ing of protective actions by recipients. Additional research developed in collaboration with the Malawian Department is needed on how to combine local knowledge and commu- of Climate Change and Meteorological Services (DCCMS) nity observations with the scientific forecast information in (Jubach and Sezin Tokar, 2016) but differs as it differentiates the provision of warnings to communities such as those in Nat. Hazards Earth Syst. Sci., 22, 461–480, 2022 https://doi.org/10.5194/nhess-22-461-2022
You can also read