Impact of dust addition on the metabolism of Mediterranean plankton communities and carbon export under present and future conditions of pH and ...
←
→
Page content transcription
If your browser does not render page correctly, please read the page content below
Biogeosciences, 18, 5423–5446, 2021
https://doi.org/10.5194/bg-18-5423-2021
© Author(s) 2021. This work is distributed under
the Creative Commons Attribution 4.0 License.

Impact of dust addition on the metabolism of Mediterranean
plankton communities and carbon export under present and
future conditions of pH and temperature
Frédéric Gazeau1 , France Van Wambeke2 , Emilio Marañón3 , Maria Pérez-Lorenzo3 , Samir Alliouane1 ,
Christian Stolpe1 , Thierry Blasco1 , Nathalie Leblond4 , Birthe Zäncker5,6 , Anja Engel6 , Barbara Marie7 ,
Julie Dinasquet7,8 , and Cécile Guieu1
1 Sorbonne  Université, CNRS, Laboratoire d’Océanographie de Villefranche, LOV, 06230 Villefranche-sur-Mer, France
2 Aix-Marseille  Université, Université de Toulon, CNRS/INSU, IRD, Mediterranean Institute of Oceanography (MIO),
UM 110, 13288, Marseille, France
3 Department of Ecology and Animal Biology, Universidade de Vigo, 36310 Vigo, Spain
4 Sorbonne Université, CNRS, Institut de la Mer de Villefranche, IMEV, 06230 Villefranche-sur-Mer, France
5 The Marine Biological Association of the UK, PL1 2PB Plymouth, United Kingdom
6 GEOMAR Helmholtz Centre for Ocean Research, Kiel, Germany
7 CNRS, Sorbonne Université, Laboratoire d’Océanographie Microbienne, LOMIC, 66650 Banyuls-sur-Mer, France
8 Scripps Institution of Oceanography, University of California San Diego, La Jolla, CA 92037, USA

Correspondence: Frédéric Gazeau (frederic.gazeau@imev-mer.fr)

Received: 2 March 2021 – Discussion started: 30 March 2021
Revised: 16 August 2021 – Accepted: 7 September 2021 – Published: 6 October 2021

Abstract. Although atmospheric dust fluxes from arid as          rates of primary production and a metabolic balance towards
well as human-impacted areas represent a significant source      net heterotrophy. The release of nutrients after dust seeding
of nutrients to surface waters of the Mediterranean Sea, stud-   had very contrasting impacts on the metabolism of the com-
ies focusing on the evolution of the metabolic balance of the    munities, depending on the station investigated. At TYR, the
plankton community following a dust deposition event are         release of new nutrients was followed by a negative impact
scarce, and none were conducted in the context of projected      on both particulate and dissolved 14 C-based production rates,
future levels of temperature and pH. Moreover, most of the       while heterotrophic bacterial production strongly increased,
experiments took place in coastal areas. In the framework        driving the community to an even more heterotrophic state.
of the PEACETIME project, three dust-addition perturba-          At ION and FAST, the efficiency of organic matter export
tion experiments were conducted in 300 L tanks filled with       due to mineral/organic aggregation processes was lower than
surface seawater collected in the Tyrrhenian Sea (TYR), Io-      at TYR and likely related to a lower quantity/age of dissolved
nian Sea (ION) and Algerian basin (FAST) on board the R/V        organic matter present at the time of the seeding and a smaller
Pourquoi Pas? in late spring 2017. For each experiment, six      production of DOM following dust addition. This was also
tanks were used to follow the evolution of chemical and bi-      reflected by lower initial concentrations in transparent ex-
ological stocks, biological activity and particle export. The    opolymer particles (TEPs) and a lower increase in TEP con-
impacts of a dust deposition event simulated at their sur-       centrations following the dust addition, as compared to TYR.
face were followed under present environmental conditions        At ION and FAST, both the autotrophic and heterotrophic
and under a realistic climate change scenario for 2100 (ca.      community benefited from dust addition, with a stronger rel-
+3 ◦ C and −0.3 pH units). The tested waters were all typ-       ative increase in autotrophic processes observed at FAST.
ical of stratified oligotrophic conditions encountered in the    Our study showed that the potential positive impact of dust
open Mediterranean Sea at this period of the year, with low      deposition on primary production depends on the initial com-

Published by Copernicus Publications on behalf of the European Geosciences Union.
5424               F. Gazeau et al.: Impact of dust addition on the metabolism of Mediterranean plankton communities

position and metabolic state of the investigated community.       Kouvarakis et al., 2001; Markaki et al., 2003; Ridame and
This impact is constrained by the quantity of nutrients added     Guieu, 2002) to the surface waters with fluxes that are of the
in order to sustain both the fast response of heterotrophic       same order of magnitude as riverine inputs (Powley et al.,
prokaryotes and the delayed one of primary producers. Fi-         2017). These significant nutrient enrichments likely support
nally, under future environmental conditions, heterotrophic       primary production especially during the stratification period
metabolism was overall more impacted than primary produc-         (Bonnet et al., 2005; Ridame and Guieu, 2002). However, no
tion, with the consequence that all integrated net community      clear correlation between dust and ocean color have been ev-
production rates decreased with no detectable impact on car-      idenced from long series of satellite observations (Guieu and
bon export, therefore reducing the capacity of surface waters     Ridame, 2020). This raises the question of which compart-
to sequester anthropogenic CO2 .                                  ment (autotrophic or heterotrophic) benefits the most from
                                                                  this transient relief in nutrient (N, P) limitation.
                                                                     In response to ocean warming and increased stratification,
                                                                  LNLC areas are expected to expand in the future (Irwin and
1   Introduction                                                  Oliver, 2009; Polovina et al., 2008) due to lower nutrient sup-
                                                                  ply from sub-surface waters (Behrenfeld et al., 2006). Fur-
Low-nutrient low-chlorophyll (LNLC) areas represent 60 %          thermore, dust deposition could increase in the future due to
of the global ocean surface area (Longhurst et al., 1995; Mc-     desertification (Moulin and Chiapello, 2006), although so far
Clain et al., 2004). Although phytoplankton production in         the trend for deposition remains uncertain because the drying
these areas is limited by the availability of nitrogen, phos-     of the Mediterranean basin might also induce less wet de-
phorus and iron, it accounts for 50 % of global carbon ex-        position over the basin (Laurent et al., 2021). Nevertheless,
port (Emerson et al., 1997; Roshan and DeVries, 2017). At-        whether the fluxes increase or not in the coming decades and
mospheric dust fluxes represent a significant source of these     centuries, new nutrients from atmospheric sources will play
nutrients to surface waters in LNLC regions and as such           an important role in a surface mixed layer even more strat-
could play a significant role in stimulating primary produc-      ified and isolated from the deeper nutrient-rich layer. The
tion (e.g., Bishop et al., 2002; Guieu et al., 2014a; Jickells    question remains of how plankton metabolism and carbon
and Moore, 2015), potentially increasing the efficiency of the    export would respond in a warmer and more acidified ocean.
biological pump in the sequestration of atmospheric CO2 .         Indeed, with an average annual anthropogenic CO2 uptake,
However, as heterotrophic prokaryotes have been shown to          during the period 2010 to 2019, of 2.5 ± 0.6 Gt C (∼ 22.9 %
outcompete phytoplankton during nutrient addition experi-         of anthropogenic emissions; Friedlingstein et al., 2020), the
ments (e.g., Guieu et al., 2014b; Mills et al., 2008; Thingstad   oceans substantially contribute towards slowing down the in-
et al., 2005), dust deposition could induce even stronger en-     crease in atmospheric CO2 concentrations, and therefore to-
hancements of heterotrophic bacterial production and/or res-      wards limiting terrestrial and ocean warming. However, this
piration rates, thereby reducing net atmospheric CO2 draw-        massive CO2 input induces global changes in seawater chem-
down and the potential for carbon export outside the eu-          istry referred to as “ocean acidification” because increased
photic zone (Guieu et al., 2014a). Indeed, several experi-        CO2 concentration lowers seawater pH (i.e., increases its
ments conducted in the Atlantic Ocean and in the Mediter-         acidity).
ranean Sea have shown a fast and dominant effect of dust ad-         Although the response of plankton metabolism to ocean
ditions on heterotrophic bacterioplankton metabolism (Herut       warming has been shown to be highly dependent on re-
et al., 2005, 2016; Lekunberri et al., 2010; Marañón et al.,      source availability (Lewandowska et al., 2014), both for het-
2010; Pulido-Villena et al., 2008, 2014). However, to the best    erotrophic bacteria (Lopez-Urrutia and Moran, 2007) and
of our knowledge, no study focused on the evolution of the        phytoplankton (Marañón et al., 2018), it has been suggested
metabolic balance of the plankton community after such a          that ocean warming will substantially weaken the ocean bio-
dust event in the open sea. The metabolic balance (or net         logical CO2 sink in the future as a consequence of stronger
community production, NCP) is defined as the difference be-       increases in remineralization than in photosynthesis pro-
tween gross primary production (GPP) of autotrophic organ-        cesses, following the metabolic theory of ecology (MTE;
isms and community respiration (CR) of both autotrophic           Brown et al., 2004; Gillooly et al., 2001). Ocean acidification
and heterotrophic organisms, revealing the capacity of sur-       alone has been shown to exert no or very limited influence
face waters to absorb atmospheric CO2 .                           on plankton metabolism in the Mediterranean Sea (Maugen-
   The Mediterranean Sea is a perfect example of LNLC re-         dre et al., 2017a; Mercado et al., 2014). To the best of our
gions and receives anthropogenic aerosols originating from        knowledge, only Maugendre et al. (2015) studied the com-
industrial and domestic activities from all around the basin      bined impact of ocean warming and acidification on plank-
and other parts of Europe and pulses of natural inputs from       ton metabolism in the Mediterranean Sea. They found a very
the Sahara (Desboeufs, 2021). These atmospheric deposi-           limited impact of ocean acidification on the plankton com-
tions, mostly in the form of pulsed inputs (Loÿe-Pilot and        munity and a positive impact of warming on small phyto-
Martin, 1996), provide new nutrients (Guieu et al., 2010;         plankton species (e.g., Cyanobacteria) with a potential de-

Biogeosciences, 18, 5423–5446, 2021                                                 https://doi.org/10.5194/bg-18-5423-2021
F. Gazeau et al.: Impact of dust addition on the metabolism of Mediterranean plankton communities                              5425

crease in the export and energy transfer to higher trophic lev-     irradiance spectrum and intensity can be finely controlled
els. Their study was conducted under nutrient-depleted con-         and in which future ocean acidification and warming condi-
ditions (Maugendre et al., 2017b). Hence, there is still a need     tions can be fully reproduced. The tanks were made of high-
to assess the combined impact of warming and acidification          density polyethylene (HDPE) and were trace-metal-free in
on the metabolic balance of plankton communities in this re-        order to avoid contaminations, with a height of 1.09 m, a di-
gion, following a transient relief in nutrient availability.        ameter of 0.68 m, a surface area of 0.36 m2 and a volume of
   So far there has been no attempt to evaluate the evolu-          0.28 m3 . The conical base of the tanks was equipped with a
tion of plankton metabolism and carbon export following             sediment trap that was left open during the duration of the ex-
atmospheric deposition in the context of future levels of           periments and removed at the end. The experimental protocol
temperature and pH. Such experiments were conducted in              comprised two unmodified control tanks (C1 and C2), two
the frame of the PEACETIME project (ProcEss studies at              tanks enriched with Saharan dust (D1 and D2), and two tanks
the Air-sEa Interface after dust deposition in the MEditer-         enriched with Saharan dust and maintained simultaneously
ranean Sea; http://peacetime-project.org/, last access: 4 Oc-       under warmer (+3 ◦ C) and acidified (−0.3 pH unit) condi-
tober 2021) during the cruise on board the R/V Pourquoi             tions (G1 and G2). At the three stations, tanks were always
Pas? in May–June 2017 (Guieu et al., 2020a, b). The project         filled at the end of the day before the start of the experiments:
aimed at extensively studying and parameterizing the chain          TYR (17 May 2017), ION (25 May 2017) and FAST (2 June
of processes occurring in the Mediterranean Sea after atmo-         2017). The tanks were filled by means of a large peristaltic
spheric deposition, especially of Saharan dust, and to put          pump (Verder© VF40 with EPDM hose, flow of 1200 L h−1 )
them in perspective of ongoing environmental changes. Dur-          collecting seawater below the base of the boat (depth of
ing this cruise, three perturbation experiments were con-           ∼ 5 m), used to continuously supply surface seawater to a
ducted in 300 L tanks filled with surface seawater collected        series of instruments during the entire campaign. While fill-
in the Tyrrhenian Sea (TYR), Ionian Sea (ION) and Alge-             ing the tanks, seawater was sampled for the measurements
rian basin (FAST; Fig. 1). Six tanks were used to follow the        of selected parameters (sampling time = t − 12 h). After fill-
evolution of chemical and biological stocks, biological activ-      ing the tanks, seawater was slowly warmed overnight using
ity, and export, following a wet dust deposition event simu-        500 W heaters, controlled by temperature-regulation units
lated at their surface, both under present environmental con-       (COREMA©), in G1 and G2 to reach an offset of +3 ◦ C.
ditions and following a realistic climate change scenario for       13 C bicarbonate was added to all tanks at 04:00 LT (all times

2100 (ca. +3 ◦ C and −0.3 pH units; IPCC, 2013). A compan-          in local time), and G1 and G2 were acidified by addition of
ion paper presents the general setup of the experiments and         CO2 -saturated filtered (0.2 µm) seawater (∼ 1.5 L in 300 L;
the impacts of dust under present and future environmental          collected when filling the tanks at each station) at 04:30 LT
conditions on nutrients and biological stocks (Gazeau et al.,       to reach a pH offset of −0.3. Sampling for many parame-
2021). In this paper, we show that the effects of dust depo-        ters took place prior to dust seeding (sampling time = t0).
sition on biological stocks were highly different between the       Dust seeding was performed between 07:00 and 09:00 LT in
three investigated stations and could not be attributed to dif-     tanks D1, D2, G1 and G2. The same dust analog was used
ferences in their degree of oligotrophy but rather to the initial   and the same dust flux was simulated as for the DUNE 2009
metabolic state of the community. We further demonstrated           experiments described in Desboeufs et al. (2014). Briefly, the
that ocean acidification and warming did not drastically mod-       fine fraction (< 20 µm) of Saharan soils collected in southern
ify the composition of the autotrophic assemblage, with all         Tunisia, which is a major source of dust deposition over the
groups positively impacted by warming and acidification.            northwestern Mediterranean basin, was used in the seeding
Here, we focus on the impacts of dust seeding on plankton           experiments. The particle size distribution showed that 99 %
metabolism (e.g., primary production, heterotrophic prokary-        of particles had a size smaller than 0.1 µm, and that particles
ote production) and carbon export.                                  were mostly made of quartz (40 %), calcite (30 %) and clay
                                                                    (25 %; Desboeufs et al., 2014). This collected dust under-
                                                                    went an artificial chemical aging process by addition of nitric
2     Material and methods                                          and sulfuric acid (HNO3 and H2 SO4 , respectively) to mimic
                                                                    cloud processes during atmospheric transport of aerosol with
2.1    General setup                                                anthropogenic acid gases (Guieu et al., 2010, and references
                                                                    therein). To mimic a wet flux event of 10 g m−2 , 3.6 g of this
The general setup of the experiments is fully detailed in           analog dust was quickly diluted into 2 L of ultrahigh-purity
Gazeau et al. (2021). Briefly, three experiments were per-          water (UHP water; 18.2 M cm−1 resistivity) and sprayed at
formed at the long-duration stations TYR, ION and FAST              the surface of the tanks using an all-plastic garden sprayer
during the PEACETIME cruise on board R/V Pourquoi Pas?              (duration = 30 min). The intensity of this simulated wet de-
(Fig. 1). During these experiments (3 to 4 d each), seawater        position event (i.e., 10 g m−2 ) represents a high but realistic
was incubated in 300 L tanks (Fig. S1 in the Supplement)            scenario, as several studies reported even higher short wet de-
installed in a temperature-controlled container, in which the       position events in this area of the Mediterranean Sea (Bonnet

https://doi.org/10.5194/bg-18-5423-2021                                                    Biogeosciences, 18, 5423–5446, 2021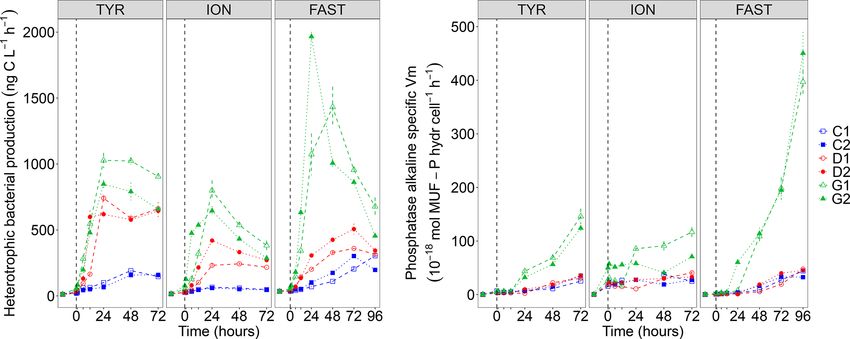
5426 F. Gazeau et al.: Impact of dust addition on the metabolism of Mediterranean plankton communities
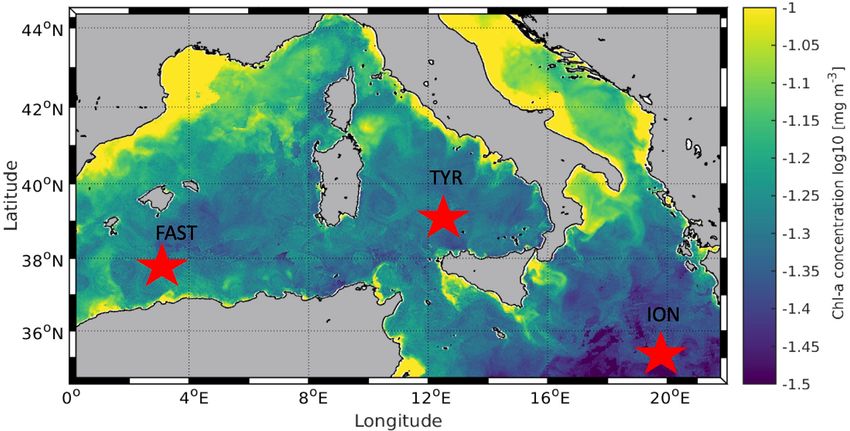
Figure 1. Location of the sampling stations in the Mediterranean Sea on board the R/V Pourquoi Pas? during the PEACETIME cruise (10
May to 11 June 2017). Background shows satellite-derived surface chlorophyll a concentration averaged over the entire duration of the cruise
(courtesy of Louise Rousselet).
and Guieu, 2006; Loÿe-Pilot and Martin, 1996; Ternon et al., 100, Elementar©). A caffeine standard (IAEA-600) was used
2010). to calibrate the EA-IRMS.
Depending on the considered parameter or process, seawa-
ter sampling was conducted 1 (t1 h), 6 (t6 h), 12 (t12 h), 24 2.2.2 Total hydrolysable carbohydrates and amino
(t24 h), 48 (t48 h) and 72 h (t72 h) after dust additions in all acids
three experiments with an additional sample after 96 h (t96 h)
at FAST). Acid-washed silicone tubes were used for transfer- For total hydrolysable carbohydrates and amino acids, sam-
ring the water collected from the tanks to the different vials ples were taken at t0, t6 h, t24 h, t48 h and t72 h at all
or containers. stations. For total hydrolysable carbohydrates (TCHO) >
1 kDa, samples (20 mL) were filled into pre-combusted glass
2.2 Stocks vials (8 h, 500 ◦ C) and stored at −20 ◦ C pending analysis.
Prior to analysis, samples were desalted with membrane dial-
2.2.1 Dissolved and particulate organic carbon ysis (1 kDa MWCO, Spectra Por) at 1 ◦ C for 5 h. Sam-
ples were subsequently hydrolyzed for 20 h at 100 ◦ C with
The concentration of dissolved organic carbon (DOC) was 0.8 M HCl final concentration followed by neutralization us-
determined from duplicate 10 mL GF/F (pre-combusted, ing acid evaporation (N2 , for 5 h at 50 ◦ C). TCHO were
Whatman©) filtered subsamples that were transferred to pre- analyzed at GEOMAR using high-performance anion ex-
combusted glass ampoules, acidified with H3 PO4 (final pH = change chromatography with pulsed amperometric detection
2) and sealed. The sealed glass ampoules were stored in (HPAEC-PAD), on a Dionex© ICS 3000 ion chromatogra-
the dark at room temperature until analysis at the Labora- phy system following the procedure of Engel and Händel
toire d’Océanographie Microbienne (LOMIC). DOC mea- (2011). Two replicates per TCHO sample were analyzed. The
surements were performed on a Shimadzu© TOC-V-CSH variation coefficient between duplicate measurements was
(Benner and Strom, 1993). Prior to injection, DOC samples 7 % on average.
were sparged with CO2 -free air for 6 min to remove inorganic For total hydrolysable amino acids (TAAs), samples
carbon. Sample (100 µL) were injected in triplicate, and the (5 mL) were filled into pre-combusted glass vials (8 h,
analytical precision was 2 %. Standards were prepared with 500 ◦ C) and stored at −20 ◦ C. Samples were hydrolyzed at
acetanilid. 100 ◦ C for 20 h with 1 mL 30 % HCl (Suprapur®, Merck),
Seawater samples for measurements of particulate organic added to 1 mL of sample, and neutralized by acid evaporation
carbon concentrations (POC; 2 L) were taken at t − 12 h, t0, in a vacuum at 60 ◦ C in a microwave. Samples were analyzed
t12 h, t24 h, t48 h and t72 h (or t96 h for station FAST), fil- by high-performance liquid chromatography (HPLC) using
tered on pre-combusted GF/F membranes, dried at 60 ◦ C and an Agilent 1260 HPLC system following a modified version
analyzed at the Laboratoire d’Océanographie de Villefranche of established methods (Dittmar et al., 2009; Lindroth and
(LOV, France) following decarbonatation with a drop of HCl Mopper, 1979). Separation of 13 amino acids with a C18
2N, on an elemental analyzer coupled with an isotope ra- column (Phenomenex Kinetex, 2.6 µm, 150 × 4.6 mm) was
tio mass spectrometer (EA-IRMS; Vario Pyrocube-Isoprime obtained after in-line derivatization with o-phthaldialdehyde
Biogeosciences, 18, 5423–5446, 2021 https://doi.org/10.5194/bg-18-5423-2021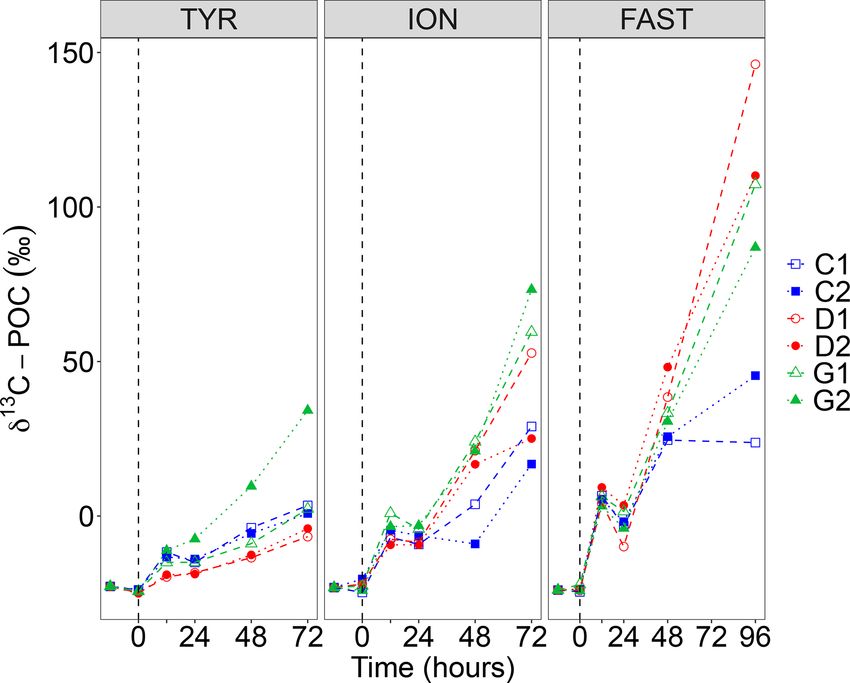
F. Gazeau et al.: Impact of dust addition on the metabolism of Mediterranean plankton communities                           5427

and mercaptoethanol. A gradient with solvent A containing         amended with 40 µCi of NaH14 CO3 . Bottles were incubated
5 % acetonitrile (LiChrosolv, Merck, HPLC gradient grade)         for 8 h in two extra 300 L tanks maintained under similar
in sodium dihydrogen phosphate (Suprapur®, Merck) buffer          light and temperature regimes to those in the experimental
(pH 7.0) and solvent B being acetonitrile was used for anal-      tanks (ambient temperature for C1, C2, D1 and D2 and ambi-
ysis. A gradient from 100 % solvent A to 78 % solvent A           ent temperature +3 ◦ C for G1 and G2). Incubations were ter-
was produced in 50 min. Two replicates per TAA sample             minated by sequential filtration of the sample through poly-
were analyzed. The variation coefficient between duplicate        carbonate filters (pore sizes 2 and 0.2 µm, 47 mm diameter)
measurements was 8 % on average. For TCHO and TAA, in-            using a low-pressure vacuum. Filters were exposed for 12 h
strument blanks were performed with Milli-Q water. The de-        to concentrated HCl fumes to remove non-fixed, inorganic
tection limit was calculated as 3× the blank value, which is      14 C and then transferred to 4 mL plastic scintillation vials

∼ 1 nmol L−1 for both parameters.                                 to which 3.5 mL of scintillation cocktail (Ultima Gold XR,
                                                                  Perkin Elmer©) was added. For the measurement of dis-
2.2.3    Transparent exopolymer particles                         solved primary production, a 5 mL aliquot of each sampling
                                                                  bottle was filtered, at the end of incubation, through a 0.2 µm
Samples for transparent exopolymer particles (TEPs) were          polycarbonate filter (25 mm diameter). This filtration was
taken at t0, t24 h and t72 h at all stations. The abundance       conducted, in a low-pressure vacuum, in a circular filtration
and area of TEPs were microscopically measured following          manifold that allows the recovery of the filtrate into 20 mL
the procedure given in Engel (2009). Samples of 10–50 mL          scintillation vials. The filtrates were acidified with 200 µL
were directly filtered in a low vacuum (< 200 mbar) onto          of 50 % HCl and maintained in an orbital shaker for 12 h.
a 0.4 µm Nucleopore membrane (Whatman©) filter, stained           Finally, 15 mL of liquid scintillation cocktail was added to
with 1 mL Alcian Blue solution (0.2 g L−1 w/v) for 3 s and        each sample. All filter and filtrate samples were measured on
rinsed with Milli-Q water. Filters were mounted on Cyto-          board in a liquid scintillation counter (Packard© 1600 TR).
clear© slides and stored at −20 ◦ C until analysis. Two filters   14 C-based production rates (PP; in µg C L−1 h−1 ) were cal-
per sample with 30 images each were analyzed using a Zeiss        culated as follows:
Axio Scope.A1 (Zeiss©) and an AxioCam MRc (Zeiss©).
The pictures with a resolution of 1388 × 1040 pixels were                        DPMsample − DPMdark
                                                                  PP = CT ×                                ,                   (2)
saved using AxioVision LE64 Rel. 4.8 (Zeiss©). All particles                          DPMadded × t
larger than 0.2 µm2 were analyzed. ImageJ© and R were sub-
                                                                  where CT is the concentration of total dissolved inorganic
sequently used for image analysis (Schneider et al., 2012).
                                                                  carbon (µg C L−1 ), DPMsample and DPMdark are the ra-
The coefficients of variation between duplicate filters aver-
                                                                  dioactivity counts in the light and dark bottle, respectively,
aged 28 %.
                                                                  DPMadded is the radioactivity added to each sample, and t is
   Filters prepared with 10 mL Milli-Q water instead of sam-
                                                                  the incubation time (h).
ples served as a blank. Blanks were always < 1 % of sample
                                                                     The percentage extracellular release (PER%) was calcu-
values. The carbon content of TEP (TEP-C) was estimated
                                                                  lated as follows:
after Mari (1999) using the following size-dependent rela-
tionship:                                                                      PPd
                                                                  PER% =              × 100,                                  (3)
                                                                            PPd + PPp
TEP-C = a6i ni riD ,                                       (1)
                                                                  where PPd refers to 14 C-based dissolved production and PPp
with ni being the number of TEPs in the size class i and ri       refers to 14 C-based particulate production (sum of < 2 and
being the mean equivalent spherical radius of the size class.     > 2 µm size fractions).
The constant a = 0.25 × 10⁻⁶ (µg C) and the fractal dimen-
sion of aggregates D = 2.55 were used as proposed by Mari         2.3.2   Integrated 13 C incorporation
(1999). To relate to organic carbon concentration in seawater,
                                                                  Addition of 13 C bicarbonate (NaH13 CO3 99 %; Sigma-
data for TEP-C are given in µmol L−1 .
                                                                  Aldrich©) was performed in each tank before t0 in order to
2.3     Processes                                                 increase the isotopic level (δ 13 C signature) of the dissolved
                                                                  inorganic carbon pool to ca. 350 ‰. We followed the time
2.3.1    Dissolved and particulate 14 C incorporation rates       evolution of the δ 13 C signature in dissolved inorganic carbon
                                                                  (δ 13 C CT ), dissolved organic carbon (δ 13 C DOC) and partic-
The photosynthetic production of particulate (< 0.2–2 µm          ulate organic carbon pools (δ 13 C POC). For the analysis of
and > 2 µm size fractions) and dissolved organic matter           the actual δ 13 C CT , 60 mL of sampled seawater (at t − 12 h,
was determined from samples taken at t0, t24 h, t48 h and         t0, t12 h, t24 h, t48 h and t72 h; +t96 h at station FAST) was
t72 h (or t96 h at station FAST) with the 14 C-uptake tech-       gently transferred to glass vials, avoiding bubbles. Vials were
nique. From each tank, four polystyrene bottles (70 mL; three     sealed after being poisoned with 12 µL saturated HgCl2 and
light and one dark) were filled with sampled seawater and         stored upside-down at room temperature in the dark pending

https://doi.org/10.5194/bg-18-5423-2021                                                  Biogeosciences, 18, 5423–5446, 2021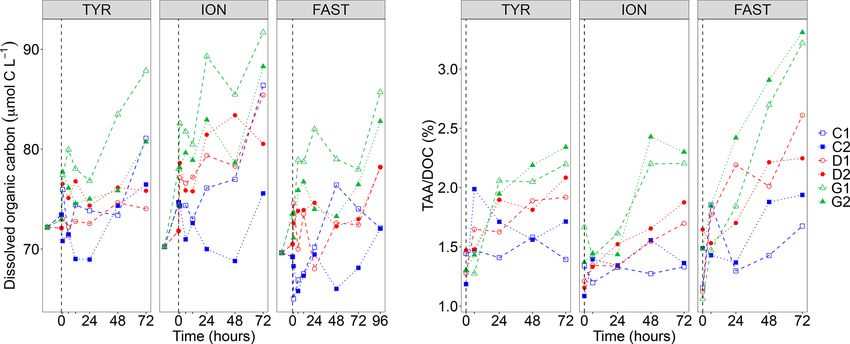
5428                F. Gazeau et al.: Impact of dust addition on the metabolism of Mediterranean plankton communities

analysis. At the University of Leuven, a helium headspace               Gross primary production (GPP) was calculated as the dif-
(5 mL) was created in the vials and samples were acidified           ference between NCP and CR. The combined standard errors
with 2 mL of phosphoric acid (H3 PO4 , 99 %). Samples were           were calculated as follows:
left to equilibrate overnight to transfer all CT to gaseous CO2 .            q
Samples were injected in the carrier gas stream of an EA-            SExy = SE2x + SE2y .                                     (5)
IRMS (Thermo© EA1110 and Delta V Advantage), and data
were calibrated with NBS-19 and LSVEC standards (Gillikin            2.3.4   Heterotrophic prokaryotic production and
and Bouillon, 2007).                                                         ectoenzymatic activities
   At the same frequency as for δ 13 C CT , samples for δ 13 C
DOC were filtered online (see above), transferred to 40 mL           At all sampling times, heterotrophic bacterial production
pre-cleaned borosilicate amber EPA vials with septa caps             (BP, sensus stricto referring to heterotrophic prokaryotic
(PTFE-lined silicone) and stored in the dark pending anal-           production) was determined on board using the microcen-
ysis at the Ján Veizer Stable Isotope Laboratory (Ottawa,            trifuge method with the 3 H-leucine (3 H-Leu) incorporation
Canada).                                                             technique to measure protein production (Smith and Azam,
   At t −12 h, t0, t12 h, t24 h, t48 h and t72 h (or t96 h at sta-   1992). The detailed protocol is in Van Wambeke et al. (2021).
tion FAST), the δ 13 C POC was obtained based on the same            Briefly, triplicate 1.5 mL samples and one blank were incu-
measurements as described above for POC, on an elemen-               bated in the dark for 1–2 h in two thermostated incubators
tal analyzer coupled with an isotope ratio mass spectrometer         maintained respectively at ambient temperature for C1, C2,
(EA-IRMS; Vario Pyrocube-Isoprime 100, Elementar©).                  D1 and D2 and at ambient temperature +3 ◦ C for G1 and
   Carbon isotope data are expressed in the delta notation (δ)       G2. Incubations were ended by the addition of TCA to a fi-
relative to the Vienna Pee Dee Belemnite (VPDB) standard             nal concentration of 5 %, followed by three runs of centrifu-
(Schimmelmann et al., 2016). The carbon isotope ratio was            gation at 16 000 g for 10 min. Pellets were rinsed with TCA
calculated as follows:                                               5 % and ethanol 80 %. A factor of 1.5 kg C mol per leucine
                              !                                      was used to convert the incorporation of leucine to carbon
              δ 13 Csample                                           equivalents, assuming no isotopic dilution (Kirchman et al.,
Rsample =                  + 1 × RVPDB ,                       (4)
                  1000                                               1993).
                                                                        Ectoenzymatic activities were measured fluorometri-
with RVPDB = 0.011237.                                               cally, using fluorogenic model substrates that were L-
                                                                     leucine-7-amido-4-methyl-coumarin (Leu-MCA) and 4-
2.3.3   Community metabolism (oxygen light–dark                      methylumbelliferyl-phosphate (MUF-P) to track aminopep-
        method)                                                      tidase activity (LAP) and alkaline phosphatase activity (AP),
                                                                     respectively (Hoppe, 1983). Stock solutions (5 mM) were
At the same frequency as for 14 C incorporation, from each           prepared in methylcellosolve and stored at −20 ◦ C. Release
tank, a volume of 2 L was sampled in plastic bottles and             of the products of LAP and AP activities, MCA and MUF,
distributed in 15 biological oxygen demand (BOD; 60 mL)              was followed by measuring the increase in fluorescence
borosilicate bottles. Five BOD bottles were immediately              (exc/em 380/440 nm for MCA and 365/450 nm for MUF,
fixed with Winkler reagents (initial O2 concentrations) and          wavelength width 5 nm) in a VARIOSCAN LUXmicroplate
were incubated in the dark for the measurement of commu-             reader calibrated with standards of MCA and MUF solu-
nity respiration (CR) in two incubators maintained respec-           tions. For measurements, 2 mL of unfiltered samples from the
tively at ambient temperature for C1, C2, D1 and D2 and              tanks was supplemented with 100 µL of a fluorogenic sub-
at ambient temperature +3 ◦ C for G1 and G2. Additionally,           strate solution diluted so that different concentrations were
five BOD bottles were incubated for the measurement of net           dispatched in a black 24-well polystyrene plate in duplicate
community production (NCP) in the same tanks as described            (0.025, 0.05, 0.1, 0.25, 0.5, 1 µM for MUF-P; 0.5, 1, 5, 10,
above for 14 C incorporation. Upon completion of the incu-           25 µM for MCA-leu). Incubations were carried out in the
bations (24 h), samples were fixed with Winkler reagents.            same thermostatically controlled incubators than those used
Within one day, O2 concentrations were measured using an             for BP and reproducing temperature levels in the experimen-
automated Winkler titration technique with potentiometric            tal tanks. Incubations lasted up to 12 h with a reading of
endpoint detection. Analyses were performed on board with            fluorescence every 1 to 2 h, depending on the intended ac-
a Metrohm© Titrando 888 and a redox electrode (Metrohm©              tivities. The rate was calculated from the linear part of the
Au electrode). Reagents and standardizations were similar to         fluorescence-versus-time relationship. Boiled-water blanks
those described by Knap et al. (1996). NCP and CR were es-           were run to check for abiotic activity. From varying ve-
timated by regressing O2 values against time, and CR was             locities obtained, we determined the parameters Vm (maxi-
expressed as negative values. Since CR is estimated from the         mum hydrolysis velocity) and Km (Michaelis–Menten con-
oxygen evolution (consumption) in bottles (negative sign),           stant which reflects enzyme affinity for the substrate) by fit-
GPP corresponds to and was calculated as GPP = NCP−CR.               ting the data using a non-linear regression on the following

Biogeosciences, 18, 5423–5446, 2021                                                    https://doi.org/10.5194/bg-18-5423-2021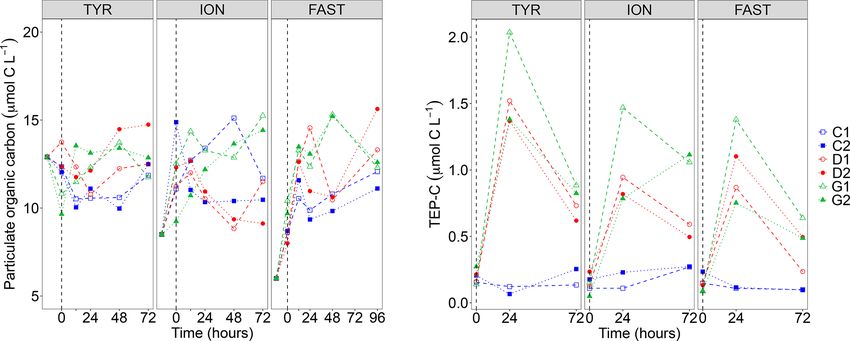
F. Gazeau et al.: Impact of dust addition on the metabolism of Mediterranean plankton communities                           5429

equation:                                                           2.4    Data processing
              S                                                     All metabolic rates were integrated over the duration of the
V = Vm ×           ,                                         (6)
            Km + S                                                  experiments using trapezoidal integrations, and the relative
                                                                    changes (in %) in tanks D and G as compared to the controls
where V is the hydrolysis rate and S is the fluorogenic sub-        (average between C1 and C2) were computed as follows:
strate concentration added.

                                                                                         RateTreatment − RateControls
2.3.5   Inorganic and organic material export                       Relative change =                                   ×100, (7)
                                                                                                 RateControls
At the end of each experiment (t72 h for TYR and ION
                                                                    where RateTreatment is the integrated rate measured in treat-
and t96 h for FAST, after artificial dust seeding), the sedi-
                                                                    ments D and G (D1, D2, G1 or G2) and RateControls is the av-
ment traps were removed, closed and stored in 4 % formalde-
                                                                    eraged integrated rates between the duplicate controls (treat-
hyde. Back in the laboratory, after the swimmers were re-
                                                                    ment C). Daily rates of 14 C-based production were computed
moved, the samples were rinsed by centrifugation in Milli-
                                                                    from hourly rates assuming a 14 h daylight period. As incu-
Q water (3 times) to remove sea salt and then freeze-dried.
                                                                    bations performed from samples taken at t0 (before dust ad-
The total amount of material collected was first weighted to
                                                                    dition) do not represent what happened in the tanks between
measure the total exported flux. Several aliquots were then
                                                                    t0 and t24 h, as a first assumption, we considered a linear
weighted to measure the following components: total carbon
                                                                    evolution between these rates and those measured from sam-
and organic carbon, lithogenic and biogenic silicates, and
                                                                    ples at t24 h and recomputed an average value for the time
calcium. Total carbon was measured on an elemental ana-
                                                                    interval t0 − t24 h. At FAST, no incubations were performed
lyzer coupled with an isotope ratio mass spectrometer (EA-
                                                                    for 14 C incorporation and oxygen metabolism between t72 h
IRMS; Vario Pyrocube-Isoprime 100, Elementar©). Partic-
                                                                    and t96 h; again an average rate between rates measured from
ulate organic carbon (POC) was measured in the same way
                                                                    samples taken at t48 h and t96 h was used for this time in-
after removing inorganic carbon by acidification with HCl
                                                                    terval. Since bacterial respiration rates were not measured,
2N. Particulate inorganic carbon (PIC) was obtained by sub-
                                                                    bacterial growth efficiency (BGE, expressed as a percentage)
tracting particulate organic carbon from particulate total car-
                                                                    was estimated based on BP (carbon units) and community
bon. Calcium concentrations were measured by ICP-OES
                                                                    respiration (CR, oxygen units). As BP was determined more
(Inductively Coupled Plasma–Optic Emission Spectrometry;
                                                                    often than CR during the first 48 h, hourly BP rates were in-
Perkin–Elmer© Optima 8000) on acid-digested samples (the
                                                                    tegrated using trapezoidal integrations during the time pe-
organic matrix was removed by HNO3 while the mineral alu-
                                                                    riod when CR was measured. We assumed that heterotrophic
minosilicate matrix was eliminated with HF). Biogenic silica
                                                                    prokaryotes were responsible for 70 % of CR (BR/CR ratio;
(BSi) and lithogenic silica (LSi) were measured by colorime-
                                                                    Lemée et al., 2002) and used a respiratory quotient (RQ) of
try (Analytikjena© Specor 250 plus spectrophotometer) after
                                                                    0.8 (del Giorgio and Williams, 2005), following this equa-
a NaOH/HF digestion, respectively (Mosseri et al., 2005).
                                                                    tion:
The carbonate fraction of the exported material was deter-
                                                                                                          !
mined from particulate calcium concentrations %CaCO3 =                                     BP
5/2 × (%Ca). The organic matter fraction was calculated as          BGE =                                   × 100.             (8)
                                                                               CR × BR
                                                                                     CR ratio × RQ + BP
2 × %POC (Klaas and Archer, 2002) The lithogenic fraction
was calculated as [total mass − (organic matter + CaCO3 +
                                                                    When BP varied following an exponential growth, we calcu-
opal)] and was very comparable to the lithogenic fraction
                                                                    lated growth rates (µBP ) from linear least square regression
calculated from LSi (taking Si concentration in dust analog
                                                                    of the natural logarithm of BP rates versus time.
used for seeding from Desboeufs et al., 2014; ca. 11.9 %).
In the controls, the amount of material exported was low and
the entire content of the traps was filtered in order to measure    3     Results
total mass and organic matter mass fluxes. Measured concen-
trations on blank filters were 1.1 % of the average concentra-      3.1    Initial conditions
tion of the sample (thus negligible). For all analyses, replicate
agreement was on average 0.3 %–2.3 %. No standard devia-            Initial conditions in terms of the chemical and biological
tion was estimated as we analyze only two aliquots over the         standing stocks measured while filling the tanks at the three
three when the two first measurements agree (< 5 % differ-          stations are fully described in Gazeau et al. (2021). Briefly,
ence) and that was the case for all the samples analyzed in         the three experiments were conducted with surface seawa-
this study.                                                         ter collected during stratified oligotrophic conditions typi-
                                                                    cal of the open Mediterranean Sea at this period of the year
                                                                    (Table 1). Nevertheless, a dust event took place nine days
                                                                    before sampling at station TYR as evidenced from the par-

https://doi.org/10.5194/bg-18-5423-2021                                                    Biogeosciences, 18, 5423–5446, 2021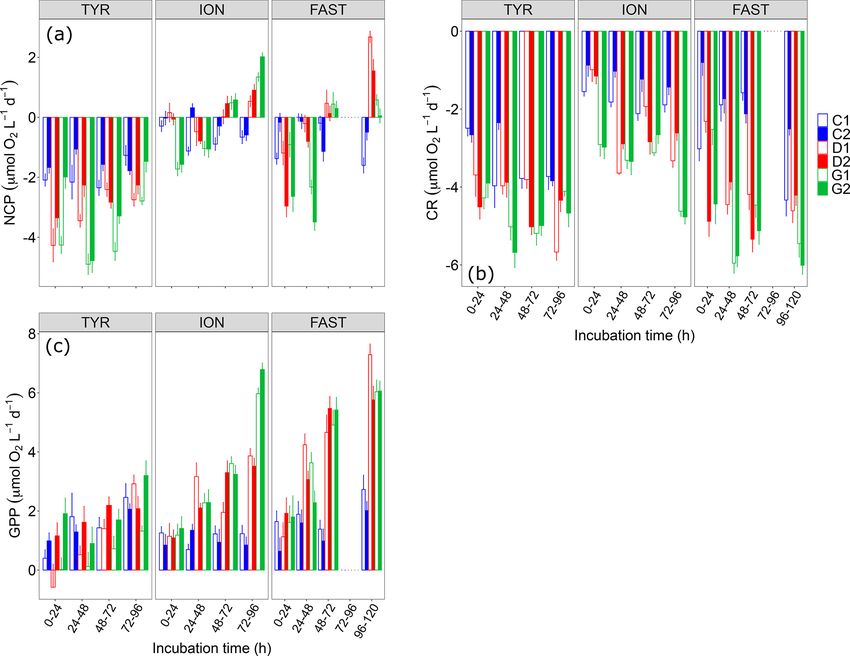
5430                F. Gazeau et al.: Impact of dust addition on the metabolism of Mediterranean plankton communities

ticulate inventory of lithogenic proxies (Al, Fe) in the wa-        ter dust seeding (t1 h) while the range of variation at t0 (be-
ter column (Bressac et al., 2021), likely stimulating phyto-        fore dust seeding) was rather moderate (difference between
plankton growth before the start of the experiment. Nitrate         minimal and maximal values in all tanks of 1.3, 6.2 and
and nitrite (NOx ) concentrations were maximal at station           4.3 µmol C L−1 at station TYR, ION and FAST, respectively).
FAST with a NOx to dissolved inorganic phosphate (DIP)              As a consequence of this variability, no clear impact of dust
molar ratio of ∼ 4.6. Very low NOx concentrations were ob-          seeding (D) could be highlighted at station TYR and FAST.
served at stations TYR and ION (14 and 18 nmol L−1 , re-            Indeed, DOC concentrations in the two duplicates (D1 and
spectively). DIP concentrations were the highest at station         D2) were higher than values in the controls (C1 and C2) in
TYR (17 nmol L−1 ) and the lowest at the most eastern sta-          only 33 % of the samples along the experiments (after dust
tion (ION, 7 nmol L−1 ). Consequently, the lowest NOx : DIP         seeding). In contrast, at station ION, DOC concentrations
ratio was measured at TYR (0.8), compared to ION and                appeared impacted by dust seeding as higher concentrations
FAST (2.8 and 4.6, respectively). Silicate (Si(OH4 )) con-          were almost systematically (83 % of the time after dust seed-
centrations were similar at TYR and ION (∼ 1 µmol L−1 )             ing) measured for this treatment as compared to control tanks
and the lowest at FAST (∼ 0.6 µmol L−1 ). Both POC and              at the same time. At all stations, this impact was somewhat
DOC concentrations were the highest at station TYR (12.9            exacerbated under conditions of temperature and pH pro-
and 72.2 µmol L−1 , respectively) and the lowest at FAST (6.0       jected for 2100 (G1 and G2) as DOC concentrations were
and 69.6 µmol L−1 , respectively). Very low and similar con-        higher almost all the time in these tanks than in control tanks
centrations of chlorophyll a were measured at the three sta-        (83 %–100 % of the samples after dust seeding, depending
tions (0.063–0.072 µg L−1 ). Phytoplankton communities at           on the station).
stations TYR and ION were dominated by prymnesiophytes                 Total hydrolysable carbohydrates and amino acid concen-
followed by cyanobacteria, while, at station FAST, the phyto-       trations along the three experiments are shown in Fig. S2 in
planktonic community was clearly dominated by photosyn-             the Supplement. TCHO concentrations were quite variable
thetic prokaryotes. At all three stations, the proportion of pig-   between tanks before dust seeding (t0; 649–954, 569–660
ments representative of larger species was very small (< 5 %;       and 600–744 nmol L−1 at station TYR, ION and FAST, re-
Gazeau et al., 2021). Heterotrophic prokaryotes were the            spectively), and no visible impact of the treatments was vis-
most abundant at station FAST (6.15 × 10⁵ cells mL−1 ) and          ible at station TYR (TCHO tended to decrease everywhere).
the least abundant at station ION (2.14 × 10⁵ cells mL−1 ).         In contrast, at station ION and FAST, values in dust-amended
   Relatively similar 14 C-based particulate production rates       tanks increased and appeared higher than in control tanks to-
were measured at the start of the experiments (t0) in the           wards the end of the experiments, although the large vari-
control tanks (C1 and C2) at station ION and FAST (ca.              ability between duplicates tended to mask this potential ef-
0.014–0.015 µg C L−1 h−1 ). At both stations, ca. 80 % of           fect. An impact of dust seeding was much clearer for TAA
the production was attributed to larger (> 2 µm) cells and          concentrations that showed larger increases throughout the
the percentage of extracellular release (%PER) did not ex-          three experiments in tanks D1 and D2 as compared to control
ceed 45 %. Lower rates were estimated at station TYR (to-           tanks, this effect being exacerbated for warmer and acidified
tal particulate production of 0.08 µg C L−1 h−1 ) from which        tanks (G1 and G2). The ratio between TAA and DOC con-
87.5 % was due to large cells > 2 µm. A larger amount of            centrations (Fig. 2) showed positive trends in tanks D and G
14 C incorporation was released as dissolved organic matter         during all three experiments with a clear distinction between
at station TYR compared to the two other stations (PER              treatments at the end of the experiments (G > D > C). The
ca. 60 %). Metabolic balance derived from oxygen mea-               strongest increase was observed at station FAST in tanks G
surements showed that, at all three stations, the commu-            where final TAA/DOC ratios were above 3 %.
nity was net heterotrophic with a higher degree of het-                Particulate organic carbon (POC) concentrations strongly
erotrophy at station TYR (NCPs were −1.9, −0.2 and                  decreased at all stations between t − 12 h and t0, this de-
−0.8 µmol O2 L−1 d−1 at TYR, ION and FAST, respectively,            crease being the largest at station TYR where concentrations
as measured in the controls from seawater sampled at t0). CR        dropped from 25.7 to 9.6–13.2 µmol C L−1 (Fig. 3). After
and GPP rates were respectively the highest and the lowest at       dust seeding, POC concentrations did not show clear tem-
station TYR compared to the other two stations. Finally, BP         poral trends for the three experiments although a slight gen-
rates were the highest at station FAST (35.8 ng C L−1 h−1 ),        eral increase could be observed at station FAST. Further-
intermediate at ION (26.1 ng C L−1 h−1 ) and the lowest at          more, no impact of dust seeding and warming/acidification
TYR (21.3 ng C L−1 h−1 ).                                           could be observed on POC dynamics. While concentrations
                                                                    of TEP-C were rather constant through time in control tanks
3.2    Changes in biological stocks                                 at the three stations, a large increase was observed in dust-
                                                                    amended tanks (D and G) with TEP-C reaching values up
DOC concentrations showed a general positive trend during           to ∼ 2 µmol C L−1 in tank G1 at station TYR after 24 h (i.e.,
the three experiments and a large variability between dupli-        ∼ 17 % of POC concentration, Fig. 3). In all cases except for
cates (Fig. 2). This variability appeared as soon as 1 h af-        tank G2 at station ION, TEP-C further decreased towards the

Biogeosciences, 18, 5423–5446, 2021                                                   https://doi.org/10.5194/bg-18-5423-2021
F. Gazeau et al.: Impact of dust addition on the metabolism of Mediterranean plankton communities 5431
Table 1. Initial chemical and biological stocks as measured while filling the tanks (initial conditions in pumped surface water; sampling
time: t − 12 h). NOx : nitrate and nitrite, DIP: dissolved inorganic phosphorus, Si(OH)4 : silicate, POC: particulate organic carbon, DOC:
dissolved organic carbon, TEPs: transparent exopolymer particles, TChl a: total chlorophyll a. Values shown for 14 C incorporation rates
and percentages of extracellular release (%PER) as well as for net community production (NCP), community respiration (CR) and gross
primary production (GPP) were estimated from samples taken at t0 in the control tanks. For heterotrophic bacterial production (BP), rates
were estimated from seawater sampled at t − 12 h.
Sampling station TYR ION FAST
Coordinates (decimal) 39.34◦ N, 12.60◦ E 35.49◦ N, 19.78◦ E 37.95◦ N, 2.90◦ E
Bottom depth (m) 3395 3054 2775
Day and time of pumping (local time) 17 May 2017 17:00 25 May 2017 17:00 02 Jun 2017 21:00
Temperature (◦ C) 20.6 21.2 21.5
Salinity 37.96 39.02 37.07
Stocks NOx (nmol L−1 ) 14.0 18.0 59.0
DIP (nmol L−1 ) 17.1 6.5 12.9
Si(OH)4 (µmol L−1 ) 1.0 0.96 0.64
POC (µmol L−1 ) 12.9 8.5 6.0
DOC (µmol L−1 ) 72.2 70.2 69.6
TEPs (×106 L−1 ) 6.8 3.8 3.7
TChl a (µg L−1 ) 0.063 0.066 0.072
Heterotrophic prokaryotes abundance (×105 cell mL−1 ) 4.79 2.14 6.15
Processes 14 C-based total particulate production (µg C L−1 h−1 ) 0.08 ± 0.03 0.14 ± 0.04 0.15 ± 0.04
14 C-based > 2 µm particulate production (µg C L−1 h−1 ) 0.07 ± 0.02 0.11 ± 0.02 0.11 ± 0.02
14 C-based < 2 µm particulate production (µg C L−1 h−1 ) 0.01 ± 0.01 0.04 ± 0.02 0.05 ± 0.01
%PER 60 ± 20 45 ± 3 32 ± 23
NCP (µmol O2 L−1 d−1 ) −1.9 ± 0.3 −0.2 ± 0.2 −0.8 ± 0.9
CR (µmol O2 L−1 d−1 ) −2.6 ± 0.1 −1.2 ± 0.5 −1.9 ± 1.6
GPP (µmol O2 L−1 d−1 ) 0.7 ± 0.4 1.1 ± 0.3 1.1 ± 0.7
BP (ng C L−1 h−1 ) 11.6 15.2 34.6
Figure 2. Dissolved organic carbon (DOC) concentrations and ratio between total hydrolysable amino acids (TAA) and DOC concentrations
measured in the six tanks (controls: C1, C2; dust addition under present conditions of temperature and pH: D1, D2; dust addition under future
conditions of temperature and pH: G1 and G2) during the three experiments (TYR, ION and FAST). The dashed vertical line indicates the
time of seeding (after t0).
end of the experiments, although concentrations remained 3.3 Changes in metabolic rates
well above those observed in the controls. As the variabil-
ity between duplicated tanks G was rather high, no impact 14 C-based particulate production rates as measured during
of warming/acidification on TEP dynamics could be high- the different time intervals at the three stations were low
lighted at the three stations. in control tanks (maximal total particulate production of
0.34 µg L−1 h−1 at station FAST) and did not show any par-
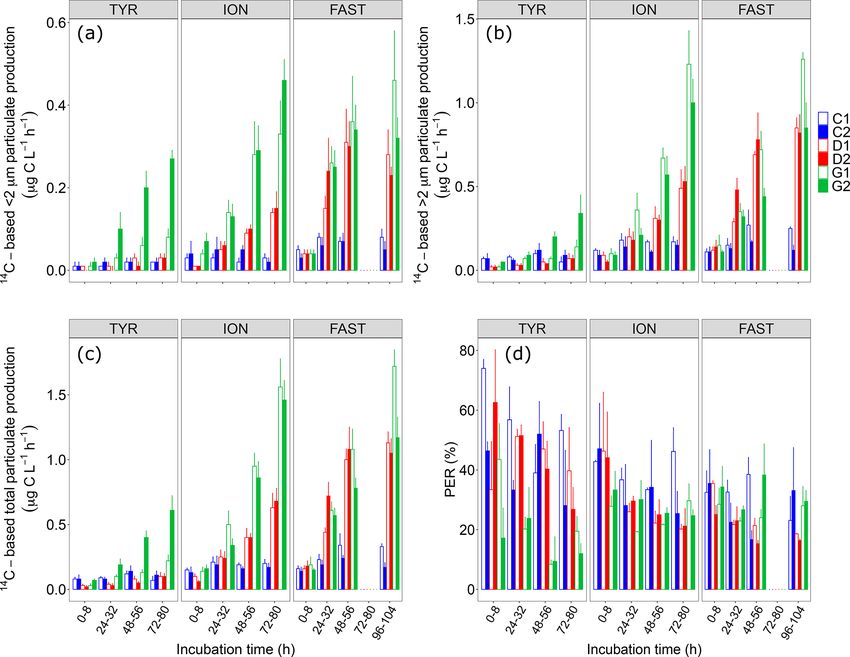
https://doi.org/10.5194/bg-18-5423-2021 Biogeosciences, 18, 5423–5446, 20215432 F. Gazeau et al.: Impact of dust addition on the metabolism of Mediterranean plankton communities Figure 3. Particulate organic carbon (POC) concentrations and transparent exopolymer particle carbon content (TEP-C) measured in the six tanks (controls: C1, C2; dust addition under present conditions of temperature and pH: D1, D2; dust addition under future conditions of temperature and pH: G1 and G2) during the three experiments (TYR, ION and FAST). The dashed vertical line indicates the time of seeding (after t0). ticular temporal dynamics (Fig. 4). In these tanks, the vast tions of temperature and pH (1.5–1.6 µg L−1 h−1 ). Dust seed- majority of particulate production was attributed to cells ing under warmer and acidified conditions had a slight im- above 2 µm (65 %–89 %). The percentage of extracellular re- pact on the partitioning of particulate production at station lease (%PER) was overall maximal at station TYR and min- ION, with smaller cells benefiting the most from these con- imal at station FAST with a tendency to decrease with time ditions. %PER remained between 20 % and 30 %. at the three stations, although large variations were observed At station FAST, similarly to station ION, total particu- between duplicates. late production rates were clearly enhanced by dust addi- Dust addition alone did not have any clear positive impact tion (tanks D), reaching maximal values during the incuba- on all 14 C-based rates at station TYR, with even an observ- tion time interval t48–56 h. No clear increase was observed able decrease in production rates from larger cells (> 2 µm) for total particulate production on the next incubation (t96– compared to the controls. In contrast, at this station, dust 120 h) while production rates of cells larger than 2 µm in- seeding under warmer and acidified conditions (tanks G) had creased and rates of smaller cells decreased. However, in a positive effect on particulate production rates, this effect contrast to station ION, there was much less impact of warm- being particularly visible for cells < 2 µm and to a lesser ing/acidification on all measured rates at station FAST, al- extent on dissolved production with a general decrease in though rates measured on smaller cells (< 2 µm) did not de- %PER. An important discrepancy between the duplicates of crease at the end of the experiment as observed under present treatment G was observable at the end of the experiment with environmental conditions. %PER under both present condi- much larger rates measured in tank G2. tions of temperature and pH (tanks D) decreased during this In contrast to station TYR, an enhancement effect of dust experiment, reaching values lower than in the controls and in addition was clearly visible at station ION where all rates in- tanks G. creased towards the end of this experiment reaching a max- The initial enrichment of the tanks in 13 C bicarbonate led imal total particulate production of 0.6–0.7 µg L−1 h−1 in to an increase in the 13 C signature of dissolved inorganic car- tanks D1 and D2. Since this positive effect was similar be- bon (δ 13 C CT ) of above 300 ‰, with generally lower values tween small and larger cells, dust addition alone had no ef- measured in warmer and acidified tanks (G; Fig. S3 in the fect on the partitioning of production at this station, with Supplement). After this initial enrichment, δ 13 C CT levels cells > 2 µm representing ∼ 80 % of total production. Al- decreased linearly in all tanks. At stations TYR and ION, the though it was also positively impacted and increasing with isotopic signature of dissolved organic carbon (δ 13 C DOC; time, dissolved production appeared less sensitive than par- Fig. S3) increased with time, although these increases were ticulate production leading to an overall decrease in %PER rather low and limited to ∼ 4 ‰ over the course of the ex- at station ION following dust addition. These positive im- periments. In contrast to station TYR, at ION, an enhanced pacts of dust seeding on 14 C-based particulate production incorporation of 13 C into DOC was visible after 24 h in tanks rates were even more visible at this station under warmer and D and G in comparison to control tanks. A similar observa- acidified conditions (tanks G), with maximal rates more than tion was done at station FAST, especially at the end of the doubled compared to those measured under present condi- Biogeosciences, 18, 5423–5446, 2021 https://doi.org/10.5194/bg-18-5423-2021
F. Gazeau et al.: Impact of dust addition on the metabolism of Mediterranean plankton communities                                     5433

Figure 4. 14 C-based production rates ((a) < 2 µm and (b) > 2 µm size fractions, (c) total particulate) estimated from 8 h incubations on
samples taken in the six tanks (controls: C1, C2; dust addition under present conditions of temperature and pH: D1, D2; dust addition under
future conditions of temperature and pH: G1 and G2) during the three experiments (TYR, ION and FAST). The percentage of extracellular
release (d, %PER) is also shown.

experiment, although much more variability was observed at
this station.
    The incorporation of 13 C into particulate organic carbon
(δ C POC) is shown in Fig. 5. At all stations, δ 13 C POC
   13

increased with time but reached lower enrichment levels at
station TYR as compared to ION and FAST. At station TYR,
incorporation rates appeared smaller in dust-amended tanks
under present environmental conditions (tanks D). As for
14 C-based production rates, an important discrepancy was

observed between duplicates under future conditions of tem-
perature and pH (tanks G) with much higher final δ 13 C POC
at the end of the experiment in tank G2. At station ION, en-
richment levels obtained at the end of the experiment were
more important in dust-amended tanks reaching maximal
levels of 73 ‰ in tank G2 at t72 h. This enhancement effect
was even more visible at station FAST with maximal enrich-
ment levels of 146 ‰ (tank D2 at t96 h). Since no sampling
occurred at t72 h, these enrichment levels cannot be directly
compared to what was measured at station TYR and ION.
However, by interpolating values at t72 h assuming a linear             Figure 5. Incorporation of 13 C into particulate organic carbon
increase between these time intervals, enrichment levels ap-            (δ 13 C POC) in the six tanks (controls: C1, C2; dust addition under
peared similar although slightly higher for tanks D between             present conditions of temperature and pH: D1, D2; dust addition
station ION and FAST.                                                   under future conditions of temperature and pH: G1 and G2) during
                                                                        the three experiments (TYR, ION and FAST). The dashed vertical
    NCP rates as measured using the O2 light–dark method
                                                                        line indicates the time of seeding (after t0).
showed that, under control conditions, the communities re-
mained in a net heterotrophic state (NCP < 0; Fig. 6) the vast

https://doi.org/10.5194/bg-18-5423-2021                                                          Biogeosciences, 18, 5423–5446, 2021
5434 F. Gazeau et al.: Impact of dust addition on the metabolism of Mediterranean plankton communities Figure 6. (a) Net community production (NCP), (b) community respiration (CR) and (c) gross primary production (GPP) rates estimated using the oxygen light–dark method (24 h incubations) on samples taken in the six tanks (C1, C2, D1, D2, G1 and G2) during the three experiments (TYR, ION and FAST). majority of the time throughout the three experiments. This While BP remained constant or gradually increased in con- was especially true at station TYR where the lowest NCP trol tanks depending on the station, a clear and quick fertil- rates were measured. At this station, dust addition whether ization effect was observable following dust addition (treat- under present or future conditions of temperature and pH did ment D and G) at all stations (Fig. 7). At station TYR, BP not switch the community towards net autotrophy but even rates sharply increased to reach maximal values at t24 h, with drove the community towards a stronger heterotrophy. This an even stronger increase observed under warmer and acid- was related to the fact that while gross primary production ified conditions (tanks G). After this initial increase, rates rates were not positively impacted, community respiration slightly decreased towards the end of the experiment. This increased in tanks D and G. At station ION, dust addition fertilization effect appeared less important at station ION alone (tanks D) led to a switch from net heterotrophy to net where lower maximal rates were obtained after 24 h as com- autotrophy after two days of incubation due to a stronger pos- pared to station TYR. Nevertheless, the same observations itive effect of dust on GPP than on CR. Under future environ- can be made, namely, (1) higher rates were measured un- mental conditions (tanks G), the same observation was made der future temperature and pH levels and (2) after this ini- with higher NCP and GPP rates than in tanks D. CR rates tial sharp increase, rates gradually decreased towards the end reacted quickly to these forcing factors in tanks G and ini- of the experiment especially in tanks G. At station FAST, a tially (first incubation) drove the community towards a much much stronger effect of warming/acidification was observed stronger heterotrophy as compared to the other tanks. Finally, with an important increase in BP in tanks G until 24 or 48 h at station FAST, similarly to what was observed at ION, the post-seeding, depending on the duplicate. A sharp decline community became autotrophic after two days of incubation was observed for this treatment until the end of the experi- in dust-amended tanks as, although both GPP and CR were ment although rates remained higher than those measured in positively impacted by dust addition, this impact was less im- tanks C and D. The impact of dust addition under present portant for CR. Warming and acidification had a limiting im- environmental conditions (tanks D) was somehow more lim- pact on this enhancement, with a lower final NCP in tanks G ited than at the other stations with a gradual increase until compared to tanks D, a difference that can be related to an t72 h with maximal rates ∼ 40–100 % higher than rates mea- absence of effects of these environmental stressors on GPP sured in the controls. However, BP increased exponentially while CR clearly increased at higher temperature and lower between t0 and t12 h in all tanks including controls, and in pH. all experiments (Table 2). The growth rate of BP (µBP ) in Biogeosciences, 18, 5423–5446, 2021 https://doi.org/10.5194/bg-18-5423-2021
You can also read


