Flood-induced economic loss and damage to the textile industry in Surat City, India - Asian Cities Climate Resilience
←
→
Page content transcription
If your browser does not render page correctly, please read the page content below
Asian Cities Climate Resilience
Working Paper Series 26: 2015

Flood-induced economic loss
and damage to the textile
industry in Surat City, India
by Chandra Sekhar Bahinipati, Umamaheshwaran Rajasekar, Akash
Acharya, Mehul Patel

Flood-induced economic loss and damage to the
textile industry in Surat City, India

Asian Cities Climate Resilience Working Paper Series
This working paper series aims to present research outputs around the common theme of urban climate
resilience in Asia. It serves as a forum for dialogue and to encourage strong intellectual debate over concepts
relating to urban resilience, results from the ground, and future directions. The series is also intended to
encourage the development of local research capacity and to ensure local ownership of outputs.
The series has arisen out of the Asian Cities Climate Change Resilience Network
(ACCCRN, www.acccrn.org), an initiative funded by the Rockefeller Foundation.
The series is intended to present research in a preliminary form for feedback and discussion. Readers are
encouraged to provide comments to the authors whose contact details are included in each publication.
Published by IIED September, 2015

IIED order no: 10749IIED
http://pubs.iied.org/10749IIED.html
ISBN 978-1-78431-254-1

80-86 Gray’s Inn Road, London WC1X 8NH, UK
Tel: +44 (0)20 3463 7399
Fax: +44 (0)20 3514 9055
email: humans@iied.org
www.iied.org
2   Asian Cities Climate Resilience

    About the authors
    Chandra Sekhar Bahinipati is assistant professor at the Gujarat Institute of Development Research (GIDR), Ahmedabad,
    India. His research interests include climate change economics, risk and vulnerability, loss and damage, environmental
    economics and development economics.

    Umamaheshwaran Rajasekar is director at TARU Leading Edge, New Delhi, India. His interests include hazard-risk
    modelling, climate variability impact analysis, strategy formulation and developing social systems for transformation.
    Email: mrajasekar@taru.org

    Akash Acharya is associate professor at the Centre for Social Studies (CSS), Surat, India. His current research pertains to
    health implications of climate change and health systems resilience.

    Mehul Patel is a senior associate with TARU Leading Edge, Surat, India. He has considerable experience in researching
    climate change adaptation and disaster risk reduction for more than five years.

    Acknowledgements
    We would like thank IIED for their support in conducting this study. In addition, we would also like to thank Surat
    Municipal Corporation (SMC), Textile Associations, the Southern Gujarat Chamber of Commerce and Industry (SGCCI)
    for helping us in the data collection, and engaging with us in meaningful discussions during the survey and also during the
    post-survey workshop for scoping the coping measures. We are also grateful to Dr Diane Archer and Anne Tadgell of IIED
    for their comments and suggestions.
Asian Cities Climate Resilience 3
Contents
About the authors 2
List of figures and tables 4
Acronyms5
Abstract6
1 Introduction 7
1.1 History of loss from floods in Surat 8
1.2 Rationale for the study 11
2 Loss and damage: review and conceptual framework 12
3 Surat: a brief overview 14
4 Methods 16
5 Results and discussion 19
5.1 Impacts of floods in Surat City 19
5.2 Brief overview of surveyed textile businesses 22
5.3 Perceptions of non-economic loss and damages of textile businesses 24
5.4 Perceptions of economic loss and damages of textile businesses 26
5.5 Coping measures 29
5.6 Respondents’ risk perceptions of future floods 29
6 Concluding observations and ways forward 31
References33
Appendix 1. Total reported economic loss in Gujarat (INR in million) 36
Appendix 2. Economic damages caused by 2006 flood in Surat City 37
Appendix 3. Average direct L&D of various components of textile businesses, Surat (INR million, 2013 prices) 38
Appendix 4. Structured interview schedule for textile industry 394 Asian Cities Climate Resilience
List of figures and tables
Figure 1. Location map of Surat City in the state of Gujarat 9
Figure 2. Method adopted for the study 16
Figure 3. Observed precipitation for different time periods (1901–2008) 19
Figure 4. Annual rainfall trend (1901–2008) 20
Figure 5. Rainfall scenario (2021–2050) 21
Figure 6. Rainfall scenario (2046–2065) 21
Figure 7. Riverine flood inundation map, 2006 22
Figure 8. Average annual operational breakdown of costs for a typical weaving unit in Surat 23
Figure 9. Perceptions of 2006 flood impacts on weaving businesses in Surat (% of respondents) 25
Figure 10. Loss and damage to weaving businesses in Surat caused by 2006 flood (in INR millions) 28
Figure 11. Area-wide loss and damage to weaving businesses in Surat caused by the 2006 flood (in INR millions) 28
Table 1. Types of economic and non-economic loss and damage 13
Table 2. Growth in the city of Surat 15
Table 3. Average figures for a typical weaving unit in Surat 23
Table 4. Experienced flood risks and respondents’ perceptions of 2006 flood impact 24
Table 5. Non-economic impacts of flood on textile businesses in 2006 26
Table 6. Respondents’ perceptions of major ex-post problems following 2006 flood (%) 26
Table 7. Average economic L&D to textile businesses in Surat in 2006 (INR millions, 2013 prices) 27
Table 8. Coping mechanisms adopted by textile businesses in Surat City (in %) 29
Table 9. Respondents’ perceptions of future floods risks in Surat City 30Asian Cities Climate Resilience 5 Acronyms AAL Average annual losses ACCCRN Asian Cities Climate Change Resilience Network AMRUT Atal Mission for Rejuvenation and Urban Transformation (formerly JNNURM) CoP UNFCCC Conference of the Parties CSAG Climate Systems Analysis Group CSS Centre for Social Studies EM-DAT Emergency Events Database GCM General circulation model (type of climate model) GDP Gross domestic product GIS Geographic information system GHCN Global Historical Climate Network GoI Government of India IIED International Institute for Environment and Development IITM Indian Institute of Tropical Meteorology IMD Indian Meteorological Department INR Indian rupee IPCC Intergovernmental Panel on Climate Change JNNURM Jawaharlal Nehru National Urban Renewal Mission (now AMRUT) L&D Loss and damage NIDM National Institute of Disaster Management, India OECD Organisation for Economic Cooperation and Development SCCT Surat Climate Change Trust SGCCI Southern Gujarat Chamber of Commerce and Industry SLR Sea-level rise SMC Surat Municipal Corporation TARU Taru Leading Edge Private Limited UHCRC Urban Health and Climate Resilience Center UNFCCC United Nations Framework Convention on Climate Change
6   Asian Cities Climate Resilience

    Abstract
    Indian coastal cities are susceptible to climate-induced rapid and slow-onset disasters,
    like cyclonic storms, floods and sea-level rise, all while existing urbanisation challenges
    amplify vulnerability. Enhancing a city’s resilience capacity is, therefore, a pertinent
    issue for policymakers when there are plans to redevelop several of India’s cities
    into ‘climate-smart’ cities – this needs a comprehensive city-wide loss and damage
    assessment. For empirical purposes, this study attempts a loss and damage assessment
    of Surat City in western India to floods. Surat is an industrial hub for both the textile
    and diamond industries. Interviews with workers from 145 textile-weaving businesses
    were completed, including focus group discussions and shared learning dialogues.

    This study finds five conclusions:

    ■■ All the sample businesses were severely affected by floods in 2006, and on an
       average, each unit required 49 days to return to normal.
    ■■ Most of the labourers out-migrated during the post-flood scenario, and hence, a
       shortage of labour was reported as a major issue.
    ■■ The mean loss and damage for each unit was approximately INR1.51 million
       where, INR 0.98 million was towards direct losses, INR 1 million was towards
       indirect losses and compensation accounted for INR 0.47 million (at 2013 prices).
       This reinforces the need for indirect losses to be factored into the disaster’s impact
       cost assessment.
    ■■ All of the surveyed businesses are unable to access insurance as insurers are reluctant
       to provide cover for businesses located in risk-prone areas.
    ■■ The textile-weaving businesses’ risk perception about potential impacts of future
       floods is moderate, which may lead to a lack of investment in planned adaptation
       measures.
Asian Cities Climate Resilience 7
1 Introduction
The impacts of climate extremes like floods and cyclonic storms have increased over the years and are likely to be
enhanced in the foreseeable future, even without climate change (IPCC, 2012). Climate change could also aggravate
the frequency and intensity of such extreme events in the near future (IPCC, 2012). As per Stern (2007), extreme events
caused US$ 83 billion in damage globally during the 1970s and increased to US$ 440 billion during 1990s. Between those
decades, the frequency of ‘great natural catastrophe’1 events increased from 29 to 74 globally, and the potential impacts
from climatic extreme events would cost in the range of 5–20 per cent of global GDP (gross domestic product) now and in
the future (Stern, 2007). Further, Bouwer et al. (2007) report that the average economic losses (inflation adjusted) globally
increased from US$ 8.9 billion during 1977–86 to US$ 45.1 billion between 1997 and 2006.
In terms of spatial impact, developing nations are the worst affected (Mirza, 2003; Botzen and van den Bergh, 2009;
IPCC, 2012). For instance, the impacts from climatic extremes were costing 1 per cent of GDP for developing nations in
2001–6, which was 0.3 per cent of GDP for low-income nations and less than 0.1 per cent of GDP for high-income nations
(IPCC, 2012). According to Mirza (2003), the cost of damage from natural disasters to developing nations was US$ 35
billion during the 1990s – eight times higher than in the 1960s.
Based on the international Emergency Events Database (EM-DAT) of disasters, the damage costs from a range of natural
disasters in India totalled US$55.62 billion between 1964 and 20122 (Bahinipati et al., 2015). Out of the total damages,
floods and cyclonic storms caused an economic loss of US$ 36.05 billion (65 per cent) and US$ 11.43 billion (21 per cent)
respectively. This reveals that both types of extreme events are the major causes of disasters in India (Bahinipati et al.,
2015). Among the flood-prone states in India, Gujarat state ranks the seventh highest in terms of total people affected and
eleventh for total economic damages during 1953–2011. A total of 92.2 million people have been affected and there was
an economic loss of INR 56,120.3 million (Bahinipati et al., 2015).3 In fact, the reported impact cost in the state was larger
in the last decade than in the previous decades (see Appendix 1).
It is well known that Indian cities are susceptible to climate change-induced rapid- and slow-onset disasters, such as
cyclonic storms, flooding and sea-level rise (SLR) (Sharma and Tomar, 2010; Karanth and Archer, 2014) and the present
urbanisation challenges make these cities more vulnerable (Revi, 2008; Revi et al., 2014). However, less attention has
been paid so far to the context of risk reduction and adaptation to climate change, which is imperative in the present
context as the Government of India (GoI) recently launched three major urban development initiatives: the Atal Mission
for Rejuvenation and Urban Transformation (AMRUT), Smart Cities Mission, and Housing for All.4 In the meantime,
some effort has been made to reduce emissions of greenhouse gases (GHGs) at the city level in India (Sharma and
Tomar, 2010).
1 In line with the United Nations, this includes those events that over-stretch the ability of the affected regions. As a rule, this is the
case when there are thousands of fatalities, when hundreds of thousands of people are made homeless or when the overall losses and/
or insured losses reach exceptional orders of magnitude (Stern, 2007: 100).
2 This reported value is not adjusted for inflation, and it is the sum of reported damage costs each year during the reference period.
3 INR or Indian Rupee (US$1 = INR61.03 as of July 2015).
4 These schemes were launched 25 June 2015. Under these, 500 cities will be developed under the AMRUT scheme, 100 smart cities
will be constructed in the next five years, and housing plans for all schemes aim to build 20 million houses in urban areas in the next
seven years. The GoI proposes to invest around INR40 trillion in these schemes in the next six years (The Hindu, 2015).8 Asian Cities Climate Resilience
Based on various scientific studies, it is expected that the average temperature in India could increase between 2–4OC,
with a related increase of 7–20 per cent in annual precipitation, riverine flooding, cyclones, storm surges and SLR with
increased intensity (Revi, 2008). A study on low elevation coastal zones estimates that about 3 per cent of India’s national
area is at risk of SLR (McGranahan et al., 2007). Further, it is expected that the occurrence of extreme precipitation events
like the one in Mumbai in 2005 could be increased over the west coast and in central India (Sharma and Tomar, 2010).
Meanwhile, Indian cities are also grappling with problems related to pollution, health, population, infrastructure and
services (Revi, 2008; Sidhwani, 2015).
According to the Census of India website (2011), the urban population of India has increased from 285 million in 2001
to 377.1 million in 2011 – representing 31.15 per cent of the country’s total population (Karanth and Archer, 2014).
In addition, it is also expected that there will be approximately 500 million people living within 7,000–12,000 urban
settlements by the 2060s (Revi, 2008; see also Revi et al., 2014). Similar to the cities in low- and middle-income nations,
Indian cities are already facing inadequate provision of water, sewerage systems, drainage and solid-waste management
facilities, and many cities even lack a proper road infrastructure and efficient public transport facilities (Sharma and
Tomar, 2010; Sidhwani, 2015; see also Revi et al., 2014). Apart from this, around 50 per cent of the people living in slums
in cities in India are highly susceptible to various disasters (Karanth and Archer, 2014). Thus, climate change impacts in
Indian cities need to be considered along with significant demographic, health and environmental transitions (Revi, 2008),
and with an understanding of the potential damage costs.
1.1 History of loss from floods in Surat
Among the various cities in Gujarat state, Surat is the ninth largest city and geographically situated in western India (see
Figure 1). It is a major industrial hub for textiles and diamonds, is extensively vulnerable to floods and other slow-onset
disasters like SLR, increasing monsoonal precipitation and related health risks (Revi, 2008; ACCRN, 2011; Bhat et al.,
2013; Karanth and Archer, 2014). The hazard, risk and vulnerability analysis map carried out in 2005 found that Surat is
prone to hydro-meteorological hazard risks: around 90 per cent of Surat’s geographical area could be potentially affected
by climate-induced events like floods, cyclonic storms or SLR (Bhat et al., 2013; Karanth and Archer, 2014).
A recent study by Santha et al. (2015) find that households (especially migrant households) in Surat perceived flooding
and waterlogging followed by heavy rains and flood-induced displacement as serious threats. The floods in Surat are due
to heavy precipitation, either in the city or the upper catchment area of the Tapi river. These floods are also known as
‘Ukai floods’ as they happen due to the release of water from the upstream Ukai Dam 94km away5, and can be rapid and
severe. Floods can also be caused by seawater intrusion through different creeks which are also known as ‘Khadi6 floods’.
These are less devastating, but still significantly affect vulnerable households living around these creeks (Bhat et al.,
2013; Karanth and Archer, 2014). On the basis of GIS-based vulnerability analysis, Bhat et al. (2013) report that around
71,000 households are prone to Khadi floods and approximately 4,50,000 households are susceptible to flooding due to
Ukai floods. It is also reported that a one-metre SLR would swamp 40 per cent of the land area in Surat (Karanth and
Archer, 2014).
5 This multi-purpose dam was constructed in 1972 and is 94km upstream of Surat – the objective is to control floods by providing water
to irrigate the coastal plains of Gujarat and to generate electricity. One of the major constraints for flood prevention is the inability
to manage this dam around competing demands. For instance, the reservoir needs to be filled by the end of the monsoon season for a
smooth flow of irrigation water in the other seasons. If there is unexpected heavy rainfall during monsoon season, it becomes difficult
to prevent flooding in Surat – this was the major reason for the flood in 2006 (Bhat et al., 2013: 4).
6 Khadi in Gujarati means creek.Asian Cities Climate Resilience 9 Figure 1. Location map of Surat City in the state of Gujarat Source: Authors’ figure Between 1882 and 2006, Surat experienced flooding in 24 of those years, mostly during the months of August and September (Patel, 2012). Moreover, there were five major floods after 1979 (in 1979, 1990, 1994, 1998 and 2006) (Bhat et al., 2013). In fact, floods in the year 1998 and 2006 were due to emergency discharges of water from the Ukai Dam, followed by heavy rainfall in the Tapi River’s upper catchment area, in the neighbouring states of Maharashtra and Madhya Pradesh (Bhat et al., 2013). In 2006, a severe flood hit the city which inundated around 75 per cent of city’s total area, causing a loss of 150 human lives and total economic damages of INR 160 billion (around US$ 3.5 billion). The textile and diamond industries suffered losses of INR 20 billion and INR 26 billion respectively (Bhat et al., 2013; Karanth and Archer, 2014; see also Appendix 2). Further, around 77 per cent of the working population lost 15–30 working days (Bhat et al., 2013). In 2013, Surat City experienced a Khadi flood, which had less devastating impacts compared to the flood in 2006. Anthropogenic changes, including building of bridges and embankments, have reportedly increased the siltation and reduced the carrying capacity of the river, as evidenced by increasing flood levels for similar amounts of discharge over last few decades (CSS, 2010).
10   Asian Cities Climate Resilience

     As per Hallegatte et al. (2013), the average annual losses (AAL) from floods in Surat are estimated for 2005 at US$
     30 million per year with protection, which amounts to 0.25 per cent of the city’s GDP, ranking seventeenth among the
     136 coastal cities around the world and third among the coastal cities in India, after Mumbai and Kolkata. With socio-
     economic change alone (based on Organisation for Economic Cooperation and Development (OECD) and United Nations
     scenarios), AAL in Surat would be around US$ 905 million per year in 2050 (a 30-fold increase in absolute terms). If
     additional subsidence (40cm by 2050 in areas of the city prone to subsidence) and SLR scenario (20cm increase) are
     factored in, as well as loss in investments which were made towards flood adaptation, the AAL would increase to US$928
     million per year by 2050, amounting to 0.26 per cent of the city’s GDP (Hallegatte et al., 2013). Further, Nicholls et al.
     (2008) find that approximately 418,000 people will be exposed to extreme climatic events (ranked twenty-fourth highest
     in the world) in Surat City by 2070 (100-year return period), and almost US$6.93 billion worth of assets will be at risk if
     one considers the city’s situation as of 2005. In case of any future changes in socio-economic situation, change in current
     climatic conditions and natural/ human-induced subsidence, approximately 2.02 million people would be exposed in Surat
     City and US$282.8 billion worth of assets would be at risk.

     In addition, the city’s industrial base attracts a large number of migrant workers from various parts of India, especially
     from Odisha, Uttar Pradesh and Bihar, and these people mostly live in under-provisioned slums across the city. There were
     406 slums in Surat as of 2006, and most slums are located in the high risk prone regions in Surat (Bhat et al., 2013). It is
     found that around 0.5 million slum dwellers across the city face both flood risk and vector-borne diseases (Anguelovski
     et al., 2014). Because of this, the city experiences various environmental, social, economic and health vulnerabilities,
     making the city, and the urban poor specifically, more susceptible to challenges posed by climate change (Karanth and
     Archer, 2014).

     Given the susceptibility of various cities in India, including Surat, to climate change risks, it is surprising to find that
     there is no existing sub-component under JNNURM (Jawaharlal Nehru National Urban Renewal Mission)7 for climate
     adaptation, risk mitigation or vulnerability assessment for urban areas (Revi, 2008; Sharma and Tomar, 2010). Moreover,
     Surat joined the ACCCRN (Asian Cities Climate Change Resilience) Network in 2008 to develop activities related to
     city resilience (see Anguelovski et al., 2014; Karanth and Archer, 2014; Chu et al., 2015). Various programmes under
     ACCCRN, including the end-to-end early warning system for Ukai and Khadi floods, the Surat Climate Change Trust
     (SCCT) and the Urban Health and Climate Resilience Centre (UHCRC) (see Bhat et al., 2013; Karanth and Archer, 2014;
     Chu et al., 2015), could play a major role in reducing potential damages from floods. While the end-to-end early warning
     system, for instance, assists the textile businesses to take precautionary action, the UHCRC could reduce the post-flood
     impact on the health of labourers, especially those living in informal settlements. The objective of SCCT is to engage
     stakeholders to address issues associated with climate change (Chu et al., 2015). The ACCCRN process revealed that
     Surat City does not have enough resources to cope with recent flood impacts, which warrants an estimation of loss and
     damage (L&D) from floods. Recently, Surat City has also been selected under the Smart Cities Mission recently launched
     by the GoI, and a large amount of investment is likely to happen in the near future.

     7   JNNURM was initiated in 2005 under Ministry of Urban Development covering 65 cities in India – the main objective was to
         target urban development and urban renewal, mainly focusing on infrastructure development, urban poverty and urban governance
         (Sharma and Tomar, 2010).
Asian Cities Climate Resilience 11 1.2 Rationale for the study In the recent years, few studies (mostly concentrated in South Asia and Africa) have estimated L&D due to natural disasters for different sectors, with predominant focus on agriculture (Rabbani et al., 2013; Bauer, 2013; Brida and Owiyo, 2013; Yaffa, 2013; Traore and Owiyo, 2013; see Warner and van der Geest, 2013). Within these studies, some have estimated L&D in terms of people and assets at risk, while none of these studies have estimated the total L&D in monetary terms. Government agencies around the world tend to calculate post-disaster direct L&D to seek financial aid from various donor agencies. A large number of indicators related to direct non-economic and indirect economic/ non-economic L&D are left out by the government in their L&D estimation. The EM-DAT international disaster database also records country- wise L&D indicators from various disasters, which are mostly dominated by direct economic L&D indicators. Birkmann and Welle (2015) outline that there is still a controversy in the definition and assessment methodology for assessing L&D from various disasters – a comprehensive method for assessing L&D is yet to be developed. Moreover, there is also limited knowledge of how L&D estimation can be undertaken in urban centres, particularly in developing nations, where insurance products are still at their nascent stage and most sectors are informal in nature (Dodman and Archer, 2014). To the best of our knowledge, there is no such study that estimates L&D of Indian cities from various natural disasters, which is also more complicated given the dynamics of urbanisation in India. Most existing L&D assessments concentrate on calculating household level L&D; none of the studies so far are urban-centric or assess L&D from the industry perspective. The L&D assessment initiative could provide inputs for the three ambitious national urban missions, outlined in the previous section, launched recently which aim to transform urban cities and provide better services and infrastructure. Since Surat City is a hub for textile businesses on which a large number of households’ livelihoods depend, it is imperative to assess L&D of these industries to enhance their resilience, so that the forward linkage impact on vulnerable households, especially migrant labourers, could be reduced in the near future. The present study, therefore, aims to answer the following key questions, which will contribute to the understanding of extreme weather event induced L&D to textile-weaving businesses in urban areas. The specific objectives of this study are: ■■ To estimate the extent of economic and non-economic (direct and indirect) L&D to textile-weaving businesses in Surat due to the 2006 riverine flooding event, and ■■ To understand what measures were undertaken by weavers and textile associations post-2006 to build their resilience to flooding. The advantage of this study is that it estimates both direct and indirect economic L&D costs from floods to textile businesses. In addition, it also captures a few non-economic L&D indicators, e.g. labour migration and health impacts. But a large number of other indicators related to non-economic L&D (e.g. social conflict due to loss of wages and remittances, impact on social capital); direct economic L&D (direct impacts of flood on industrial workers, such as damage to homes and property, which could have an indirect economic impact on the industries in terms of availability of labour after the flood); and indirect economic L&D (impact on remittances) are not captured. Further, this study also has not estimated the spill-over impacts of L&D on textile businesses, such as impacts on the livelihoods of industrial workers and on the regional economy. Given these shortcomings, this study makes an attempt to highlight the importance of L&D assessment to building resilient cities – this has larger policy implication in the immediate near future given the GoI’s recently launched urban missions. The next section outlines a review and conceptual framework for L&D assessment, while the third section provides a brief description of Surat City. The fourth section outlines methods, the fifth discusses the empirical results and the final section provides a conclusion with ways forward.
12   Asian Cities Climate Resilience

     2 Loss and damage: review
       and conceptual framework
     Both the Fourth Assessment Report and the special report on extreme events (SREX) of the IPCC confirm that we are
     already committed to certain impacts of climate change now and in the foreseeable future, even if we adopt a stringent
     mitigation policy now (Pielke et al., 2007; Roberts and Huq, forthcoming; see Parry et al., 2007; IPCC, 2012). These
     reports also highlight the limits of adaptation where some communities would not be able to adapt beyond a certain
     threshold level (Dow et al., 2013; Roberts and Huq, forthcoming). This reveals the fact that neither mitigation nor
     adaptation is sufficient to prevent L&D from climate change-induced events (Roberts and Huq, forthcoming), which
     warrants an urgent need to identify the limits that are likely to occur, to enhance the adaptive capacity of the social actors
     (Dow et al., 2013). As per the Economic Commission for Latin America and the Caribbean (ECLAC), the prime goal of
     L&D is to assess the impact of disasters on the society, economy and environment of the affected entity (Birkmann and
     Welle, 2015), though there are limitations to valuing non-monetary losses. As mentioned above, governments have been
     estimating L&D immediately after disasters, though the indicators vary across countries.

     L&D refers to the negative effects of climate variability and climate change that people have not been able to cope with
     or adapt to, which are the residual impacts (Warner and van der Geest, 2013). Further, the United Nations Framework
     Convention on Climate Change (UNFCCC) defines L&D as the actual and/or potential manifestation of impacts associated
     with climate change in developing countries that negatively affect human and natural systems (UNFCCC, 2012). ‘Loss’
     means irreversible impacts: negative impacts in relation to which reparation or restoration is impossible, such as loss of
     ecosystem services. ‘Damages’ can be recovered, meaning negative impacts for which reparation or restoration is possible,
     such as damage to houses and coastal mangroves (UNFCCC, 2012). Table 1 reports definitions and indicators of the
     various types of economic and non-economic L&D.

     The notion of L&D in the context of climate change has gained momentum in the UNFCCC arena in recent years,
     particularly after the Bali action plan at the UNFCCC’s Thirteenth Conference of the Parties (CoP 13) in 2007 (UNFCCC,
     2012; see Roberts and Huq, forthcoming). It is an important topic for the international community especially in the
     context of climate change negotiations and disaster-risk reduction. At this meeting, developing nations raised the need
     for adaptation including the consideration of disaster-risk reduction strategies and means to address L&D associated
     with the impacts of climate change (Roberts and Huq, forthcoming). At CoP 16 in Cancun in 2010, a work programme
     on L&D was formally launched to address L&D associated with climate change, especially in developing nations. L&D
     arrived in the global policy arena at CoP 18 in Doha in 2012, with a relevant policy forum for L&D, the advancement
     of understanding and expertise on L&D, the acknowledgement of the necessity to enhance support for L&D initiatives,
     and the decision to establish an institutional arrangement for L&D. At CoP 19 in Warsaw in 2013, L&D was formally
     institutionalised, through the establishment of the Warsaw International Mechanism for Loss and Damage associated
Asian Cities Climate Resilience 13
with climate change impacts (Roberts and Huq, forthcoming). This recognises the fact that climate change has negative
impacts on society that will not be avoided by mitigation and adaptation (Roberts and Huq, forthcoming). Two major
decisions were taken at this convention: a range of actions were highlighted to (i) assist vulnerable nations to withstand
climate change impacts, and (ii) improve the understanding of L&D, including non-economic L&D (Roberts and
Huq, forthcoming).
Table 1. Types of economic and non-economic loss
and damage
Types of L&D Definition and example References
Direct L&D L&D occurring immediately after a disaster Hallegatte and Przyluski
(2010)
Direct economic/market L&D of goods and services that are traded in markets e.g. Hallegatte and Przyluski
L&D damage to houses, public properties, agricultural crops or (2010); UNFCCC (2013)
loss of livestock
Direct non-economic/ L&D to goods and services for which a market does not exist Hallegatte and Przyluski
non-market L&D e.g. loss of life; people affected; damage to cultural heritage, (2010); UNFCCC (2013)
biodiversity and ecosystem services
Indirect L&D L&D which is not provoked by the disaster itself, but by its Hallegatte and Przyluski
consequences (2010)
Indirect economic/ Includes loss of ‘net revenue’ by different sectors during Prabhakar et al. (2015)
market L&D recovery period, loss of wages, reduction in tourism revenue,
and loss to human capital
Indirect non-economic/ Examples include migration; impact on social capital, crime, Prabhakar et al. (2015)
non-market L&D conflicts and disputes; loss of indigenous knowledge; social
welfare loss due to water stress and violence against women
In the context of India, the state governments generally do a post-disaster impact assessment to seek financial aid from
the national government and various donor agencies. This estimation consists of direct economic damage (to various
sectors like housing, agriculture, public property or livestock/cattle) as well as non-economic damages (loss of life, people
affected) (see Prabhakar et al., 2015). From the government side, the Revenue and Disaster Management Department
is the nodal agency for the L&D estimation. In addition, a few research studies have also emerged to estimate various
L&D indicators, but most of them are location specific (Prabhakar et al., 2015). In addition, in recent years the National
Institute of Disaster Management (NIDM) has implemented a post-disaster needs assessment study for India to provide an
accurate picture of the economic devastation caused by disasters, as a part of the World Bank-assisted National Cyclone
Risk Mitigation Project (Kumar, undated). While it is widely known that an L&D assessment is a prerequisite for building
smart cities across India, the government’s L&D assessment captures direct economic and a few non-economic L&D
indicators, which means that the present L&D figures could have been underestimating the actual impact. There is a need
to capture various other L&D indicators to develop smart cities. At the same time, because of the underestimated figure,
developing countries and less-developed countries (LDCs) are less able to demand adaptation funding in international
climate change negotiation processes.14 Asian Cities Climate Resilience
3 Surat: a brief overview
The city of Surat is an industrial hub for textile and diamond industries located in the western Indian state of Gujarat (see
Figure 1), with an average elevation of 13 metres. The city is situated on the banks of the River Tapi and the Arabian Sea
through its port, so Surat has had well-established international trade links for centuries. The British took control of the
city from the Portuguese in the early 1600s, marking the beginning of textile production in India with the expansion of the
East India Company.
Today, although Surat is not a metro city8, it is considered one of the fastest-growing cities of the world with a population
of almost five million (Table 2). It also ranks as one of the highest per capita income cities in India (City Mayors, 2008),
and its economic base consists of textile manufacturing, trade, diamond-cutting and polishing industries, intricate zari
embroidery,9 and chemical industries. Petrochemical and natural gas-based heavy engineering industries at Hazira
(near Surat), established by leading industry houses (public, private and multinational companies) such as the Oil and
Natural Gas Corporation (ONGC), Reliance, Essar, and Larsen and Toubro-Shell are also a part of Surat’s economy
(ACCCRN, 2011).
Surat is known as the ‘silk city’ for its man-made fibre production and as the ‘diamond city’ for its diamond-cutting and
polishing businesses. For both industries, Surat is the biggest national hub. As per the baseline survey of the power-loom
sector, conducted by the Ministry of Textiles in 2014, out of 0.49 million power looms in Gujarat, Surat has 0.47 million
(i.e. 96 per cent). The annual polyester-yarn consumption by the power-loom businesses in Surat has been pegged at
4,061 million kilograms and annual fabric production is 9,187.1 million metres (Times of India, 2015). In terms of daily
production, nearly 30 million metres of raw fabric and 25 million metres of processed fabric are produced in Surat daily.
Around 90 per cent of the polyester used in India comes from Surat (ACCCRN, 2011). Apart from the power looms, the
textile industry in Surat is also comprised of various dying and printing houses (around 400 in number) and around 50,000
embroidery businesses (SMC, undated). There are 150 multi-storied textile markets and trade is routed through 50,000
merchant manufacturers/traders (ACCCRN, 2011).
8 The government of India classifies Indian cities in three categories (X, Y and Z), on the basis of their population. ‘Metro cities’ like
Mumbai, Delhi, Kolkata, Chennai, Bangalore and Hyderabad are in the X category. Surat is in the Y category. It is important to note
that in the urban literature, non-metro cities lie at the lower end of scholarly attention.
9 Zari is a type of embroidery for traditional Indian garments using gold or silver threads.Asian Cities Climate Resilience 15
Table 2. Growth in the city of Surat
1961 1971 1981 1991 2001 2011
Area (in sq. km) 8.18 33.85 55.56 111.16 112.27 326.5
Population (in millions) 0.29 0.47 0.78 1.50 2.81 4.46
Decadal growth (%) 29.05 63.75 64.65 93 62.4 58.71
Source: Census of India (2011) and SMC (2011)
Surat’s industries, being largely manufacturing driven, are labour intensive and attract workers from Gujarat as well as
other Indian states like Odisha, Uttar Pradesh and Bihar.10 The entire textile sector of the city provides employment to
more than 0.7 million workers (SMC, undated). The industry still remains traditional and mostly functions from micro-,
small- and medium-scale (MSME) enterprises. Power-loom workers live in informal settlements with six to eight people
per room, face job insecurity and work long hours (mostly 12 hour shifts) in standing and leaning positions with high
decibel noise levels. This could lead to partial or full deafness in the long run. In dyeing and printing businesses the dust,
heat, noise, contact with dangerous chemicals and high frequency of accidents are the most common occupational hazards.
Dermatological and respiratory problems are also potential health hazards in this industry. Single male migrants in both
industries are exposed to sexually transmitted disease including HIV/AIDS and are also found to be consuming tobacco
and alcohol to a considerable extent (SMC, undated).
Surat has long been exposed to natural disasters, being in a Seismic Zone 3 (the scale is from 1 to 5, in order of increasing
vulnerability to earthquakes). The construction of Surat’s castle started in the year 1664 as a flood protection structure with
gates that were closed in the event of a flood. From 1869 to 1884, on average, the city was flooded every two and a half
years followed by a fall in frequency by 1914. During 1949 to 1979, the average natural flood occurrence was once every
four years. The 1968 flood was the biggest flood in Surat’s history and had a peak flow of approximately 42,475 cubic
metres per second (1.5 million cubic feet per second), while the water level at Hope Bridge in Surat reached 12.01m. The
Ukai Dam was completed in 1972. Heavy rainfall in the catchment area upstream of Ukai Dam (mainly in Maharashtra)
often results in a heavy discharge of water, causing several floods in Surat in the past 20 years. This is largely caused by
the competing objectives of the Ukai Dam, which is designed mainly for irrigation and power generation with partial
flood control. To meet the first two objectives, the dam has to be able to hold as much water as possible leaving a limited
cushion for flood control, especially during the latter part of the monsoon (SMC,- 2011).
Many of the slums in the city, where migrant labourers live, face a higher risk of flooding because they are located along
tidal creeks, the river, other drainage lines, or between embankments. Floods combined with social, health and economic
challenges increase their level of vulnerability, especially for migrant labourers. For example, in 1994, a combination of
heavy rains and blocked drains led to flooding in the city. Dead animals and public waste were not removed in time and
a pneumonic plague epidemic spread through the city. Most of the migrant workers left the city and it took a couple of
months before the city’s economic activities returned to its normal situation. Such occurrences contribute immensely to
indirect economic and non-economic L&D.
10 In fact, the proportion of migrants in Surat is more than 55 per cent (CRS 2011) making migrants the majority of the population.16 Asian Cities Climate Resilience
4 Methods
As outlined above, this study aims to estimate direct and indirect economic L&D to textile weaving businesses in Surat
during the 2006 flood, and to understand the coping measures undertaken by these affected businesses. Due to limited
information on the extent of L&D incurred by the small-and medium-scale enterprises in Surat, the framework for this
study has been largely based on the city-wide vulnerability assessment in Surat conducted by TARU (see ACCCRN,
2011). The L&D indicators were selected based on- previous studies and stakeholder consultation meetings held before
conducting the primary survey; the stakeholders included weaving-unit owners, textile-association presidents, the Surat
Municipal Corporation (SMC), and the Southern Gujarat Chamber of Commerce and Industry (SGCCI). An attempt was
made to capture the problems faced by the industry, during and after the 2006 flood. Various indicators were selected to
quantify the L&D and summarise several adaptation measures which were taken in the aftermath of the event to prevent
similar occurrences. Figure 2 highlights the steps followed to conduct this research.
To estimate L&D, data was collected on weaving businesses within the city, along with historical weather data, and
information from the businesses on the type and extent of L&D experienced. A detailed stakeholder analysis was
conducted through one-to-one interviews to ensure the indicators used and data collected as a part of this research
reflected their experiential knowledge and was also of use to improve upon their existing resilience strategies. To verify
the findings, a shared learning dialogue was conducted as part of the consultation workshop with the owners of the
surveyed businesses where the final findings were also disseminated and 19 weaving-unit owners including the president
of the textile association attended this event.11
Figure 2. Method adopted for the study
1 2 3 4
Flood-risk data Stratified
Geo spatial sampling
Consultation
Collation of data
Worskshop
Structured survey
Census, in industrial area
City municipality, Policy
Analysis
District administration, recommendations
Chamber of Commerce Interviews with
urban managers
and engineers
11 In the survey, respondents were asked about their willingness to participate in the dissemination workshop which was planned to be
conducted after the survey. Those people who had shown willingness to participate were invited, and out of which, 19 weaving-unit
owners attended.Asian Cities Climate Resilience 17
Climate data was also used to identify the possibility of similar flood events occurring over the next 30 years. Specifically,
data collected included daily rainfall data for the period between 1901 and 2010 from Indian Meteorological Department
(IMD); climate data (past and future) from Climate Systems Analysis Group (CSAG), Indian Institute of Tropical
Meteorology (IITM), IMD and Global Historical Climate Network (GHCN) for 1970 to 2100 were used for analysis; and
the names and locations of weaving businesses were provided by SGCCI. A flood inundation map of 2006 was developed
by TARU based on the high flood-level markings which were done by SMC post the event. Since there was no information
on the Khadi floods, the area as depicted by SMC and the irrigation department of the state was used for the analysis.
To capture the extent of L&D within textile-weaving businesses due to the floods in Surat, a stratified random sampling
approach was adopted to conduct the primary survey. Based on the vulnerability analysis and discussion with the local
stakeholders, an industry survey was conducted in three industrial clusters, e.g. Ved Road, Pandol; Gujarat Industrial
Development Corporation (GIDC), Katargam; and LH Road, Khatodara (see Figure 1). These areas are predominantly
comprised of textile weavers and almost all were affected by the 2006 flood. Before the survey began, the total list of
weaving businesses in these regions was procured from the SGCCI, which assisted the study in following a stratified
random sampling method to cover small-, medium- and large-scale enterprises. A total of 145 weaving businesses were
surveyed in these three industrial areas between January and February 2015. In the dense localities, care was taken so
that only one in every 3–4 business premises was surveyed to avoid survey bias. The survey was conducted using mobile
tablets to record the survey information and other associated information, such as location information, digital images of
the businesses and audio recordings of descriptions of various adaptation measures undertaken by the businesses. Once
collected, these data sets were verified for erroneous errors before analysis.
A structured questionnaire was designed to collect information related to L&D of the textile businesses in Surat, and it was
also revised based on responses received through a pilot survey and stakeholder consultations (see Appendix 4 for the final
questionnaire). The final questionnaire includes various sections:
■■ About the business: this includes information to create a general business profile; production details (raw materials and
finished products); number and cost of machines used; employee details (for 2014 and 2006); production and energy
consumption details; operational information; and expenses.
■■ About L&D: this includes the number of times a business has experienced floods in the last 10 years; perceptions of
the impact of the 2006 flood; and specific L&D data of 2006 flood, e.g. extent of inundation, direct L&D (damage
to buildings, machinery and vehicles; loss of life, raw materials, finished goods and documents; physical injury to
people), indirect L&D (number of days businesses were closed, number of days that minimum labour was unavailable,
recovery period, time taken to access raw materials), a few non-economic L&D indicators (e.g. impact on health of
industrial workers, migration) and any major problems faced by these businesses immediately after the flood event.
■■ Adaptation: measures undertaken since the 2006 flood and unit owners’ perceptions of flood impacts likely to occur in
the near future
In this study, the direct economic L&D includes: cost of repairs to buildings and machinery; loss of raw materials, finished
goods, furniture and IT equipment; and damage to documents, vehicles and other damage (e.g. repairing electricity
connection). The indirect economic loss is estimated based on the number of recovery days for each business multiplied
by its net revenue per day – this is the amount of income each business could have earned, if the flood had not occurred.
Since these values were reported for the year 2006, a GDP deflator12 was used to convert these values for the year 2013.
Quick-Bird satellite images (resolution 0.6m) of the city and other GIS were used to analyse locational information of the
businesses and their proximity to water bodies.
12 The GDP deflator is a measure of the level of prices of all new, domestically produced, final goods and services in an economy. Since
GDP for Surat city is not available, the state GDP values were used to calculate the GDP deflator.18 Asian Cities Climate Resilience
There are three major limitations to the study:
■■ Intangible losses from the flood were omitted from calculations (such as social impacts, trust between business owners
and labourers, social welfare impact on family members of industrial workers due to loss of wages),
■■ The sample used was small (in relation to the number of weaving businesses in Surat), so there was the possibility of
sampling bias, and
■■ Reporting bias was likely for stating L&D figures from the 2006 flood.Asian Cities Climate Resilience 19
5 Results and discussion
5.1 Impacts of floods in Surat City
Surat has a tropical climate, meaning the rainy season starts in June and extends to September. Even though the mean
annual rainfall is over 1,000mm, the variation between the years is high, around ± 40 per cent. Since the 1950s, there are
recorded instances (almost once every decade) of total annual rainfall exceeding 2,000mm. Figure 4 shows the total annual
precipitation between 1901 and 2008. The results indicate that even though the total annual rainfall has not changed much
over the decades the deviation in precipitation has increased considerably, particularly in the last few decades. Figure 3
illustrates this variation in rainfall patterns in different months in 1901–2008, and Figure 4 shows annual rainfall trend in
1901–2008. From 1960 to 1990, the deviation in annual rainfall is found to be over 900mm. This infers that the current
level of uncertainty in rainfall is over 90 per cent from the average 40 per cent.
Figure 3. Observed precipitation for different time
periods (1901–2008)
500
450
400
350
Precipitation (mm)
300
250
200
150
100
50
0
Source: CRS (2011)20 Asian Cities Climate Resilience
Figures 5 and 6 illustrate rainfall scenarios for 2021–50 and 2046–65, respectively. A total of 12 models were analysed,
of which 9 were from statistically downscaled general circulation models (GCMs)13 as provided by CSAG, and the others
were results from the PRECIS regional climate model (RCM).14 Most models have a dry bias correlation, and a visual
trend analysis was carried out to identify the models that are close to the observed data. Out of the 12 models, three GCM
scenarios and three RCM scenarios were selected for further analysis. The future precipitation data indicates a possibility
of increased precipitation. While the A1B scenario (2021 to 2050) indicates a possible increase during the second half of
the rainy season, other scenarios, namely A1, A2 and B2, indicate that during the latter part of this century (2046–2100)
the total amount of precipitation may increase, distributing rainy days across the season.
Figure 4. Annual rainfall trend (1901–2008)
2500
2250
2000
1750
Rainfall (mm)
1500
1250
1000
750
500
250
1901
1904
1907
1910
1913
1916
1919
1922
1925
1928
1931
1934
1937
1940
1943
1946
1949
1952
1955
1958
1961
1964
1967
1970
1973
1976
1979
1982
1985
1988
1991
1994
1997
2000
2003
2006
Year
Source: CRS (2011)
Note: the orange line (solid) in the median and the dotted lines represent the first standard deviations.
Upon analysis of daily precipitation there is evidence of a decrease in the number of rainy days. From this, combined with
the increasing rainfall trend, one can infer that the increase in rainfall will be experienced as a single day extreme event
of high intensity rainfall. July and August are also months during which the coastal areas of Surat generally experience
the highest high tides, so the increase in rainfall during this time, combined with high tides, may increase the chances of
Khadi floods in the city. Also, extreme rainfall within the catchment area of Tapi river basin, especially during tail end of
the monsoon season (post-August) when the reservoirs have usually reached their carrying capacity, forces the irrigation
authorities to release water from dam with limited warning leading to flooding along downstream. In addition, problems of
sedimentation in the river channels and encroachment along its embankments increases the risk to people and property.
13 General circulation models (GCMs) are a type of climate model that simulate the response of the global climate system to increasing
greenhouse gas concentrations. See: www.ipcc-data.org/guidelines/pages/gcm_guide.html
14 PRECIS (providing regional climates for impact studies) was developed by Hadley Centre, UK. PRECIS has been run by Indian
Institute of Tropical Meteorology (IITM) for the South Asian domain at 50 km resolution. See: http://www.icimod.org/?q=11138Asian Cities Climate Resilience 21
Figure 5. Rainfall scenario (2021–2050)
700
600
500
Precipitation in mm
400
300
200
100
0
Jan Feb Mar Apr May Jun Jul Aug Sep Oct Nov Dec
Observed A1B
Source: CRS (2011)
Figure 6. Rainfall scenario (2046–2065)
700
600
500
Precipitation in mm
400
300
200
100
0
Jan Feb Mar Apr May Jun Jul Aug Sep Oct Nov Dec
Observed MPI CGCM3 CNRM
Key to regional climate models: MPI – Max Planck Institute. CGCM3 – Canadian Global Climate Model Version 3.
CNRM – French National Centre for Meteorological Research (Centre National de Recherches Météorologiques).
Source: CRS (2011)22 Asian Cities Climate Resilience
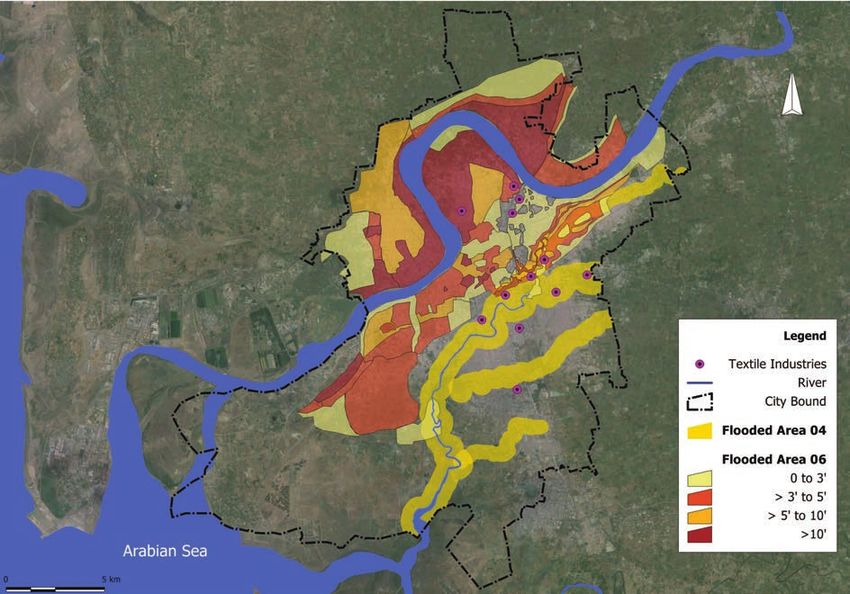
Figure 7 indicates the extent and magnitude of flooding within the city in 2006. From the results, it can be inferred that
the majority of the city was flooded, including eight of the 12 areas that house weaving businesses. The 2006 floods
occurred due to the release of excess water from the Ukai Dam and not due to local rainfall. Therefore, there is a strong
correlation between the businesses, their proximity to the river (increasing the likelihood of Khadi floods), and the extent
and frequency of flooding they experienced.
Figure 7. Riverine flood inundation map, 2006
Source: Authors’ figure
5.2 Brief overview of surveyed textile businesses
A typical surveyed weaving unit occupies around 1,600 square feet and has two floors for power looms (see Table 3). Most
of the businesses were established during the 1980s and 1990s. For an average weaving unit in business, approximately
eight people are required to operate the power-loom machines. The businesses surveyed own an average of 36 power
looms, with one typical business unit (locally known as ‘Khatu’) operates 12 power loom machines managed by two
people (one in charge of six power looms) working in 12-hour shifts. On average, weaving businesses operate for 325
days a year. One time investment in machineries (power looms) ranges from INR0.1 million to INR4.14 million; the
average investment in the power looms among the businesses surveyed is around INR3 million (see Table 3). The average
annual turnover of surveyed businesses is 0.9 million metres of grey cloth and annual average revenue per unit is INR8.62
million. The major input material for power looms is largely yarn, nylon and polyester. Input quantity per weaving unit
ranges from 145 to 72,000 metres of yarn per day, and the average is 2,283 metres per day (see Table 3). Since nylon and
polyester are the predominant inputs, output is also that of nylon and polyester grey cloth. The daily output ranges from
120 to 10,500 metres and the average is 1,609 metres. The output price per metre ranges from INR4 to INR22 (average
INR6.77) per metre (see Table 3).Asian Cities Climate Resilience 23
Table 3. Average figures for a typical weaving unit
in Surat
Characteristics of businesses Average value
Space 1,600 square feet over two floors
Number of workers 8
Number of power looms 36
Number of annual business days 325
Daily working hours 12
Investment in machinery (power looms, in million INR) 3
Annual average turnover (in million metres of fabric produced) 0.9
Annual average revenue (in million INR) 8.62
Source: authors’ computation based on primary data
The operational cost of running a weaving unit includes components such as energy charges, wages, repair costs, rent and
insurance premiums. The average annual energy charges are INR0.62 million, wages INR0.61 million and repairs and
maintenance INR0.32 million. Of the 145 businesses surveyed, 114 businesses reported having insurance (approximately
78 per cent; see Table 8) and the average annual premium is INR45,012. Thus the total average annual operational
cost of a typical weaving unit is INR1.6 million of which energy charges are 39 per cent, wages 38 per cent, repair and
maintenance 20 per cent, and insurance premiums 3 per cent. This is reflected in Figure 8.
Figure 8. Average annual operational breakdown of
costs for a typical weaving unit in Surat
Insurance, 0.03
Repairs, 0.2
Energy, 0.39
Wages, 0.38
Source: survey data24 Asian Cities Climate Resilience
5.3 Perceptions of non-economic loss and damages of
textile businesses
This section briefly discusses about the weaving-unit owners’ perceptions of past floods (particularly the 2006 flood),
and non-economic L&D of the textile businesses from the 2006 flood. In this context, Table 4 shows what percentage
of the surveyed businesses experienced floods in the past (in 2006 and 2013) and their perception of the impacts of the
2006 flood. Table 5 outlines the non-economic impacts of the 2006 flood on textile businesses. In fact, all the surveyed
businesses are located at an average distance of 0.7km from the Tapi River. The massive 2006 flood affected almost all the
surveyed businesses (see Table 4). According to the unit owners, June to November are the peak season months for their
businesses, particularly for local Hindu festivals like Dussehra and Diwali which are generally celebrated during October
and November, and these businesses receive their highest bulk orders for output during June to September every year. If a
flood event, similar to 2006 magnitude, occurs around the months of Dussehra or Diwali is likely to cause greater L&D to
textile-weaving businesses in the city. Further, around 78 per cent of the weaving businesses experienced Khadi flooding
in 2013; all businesses in the Ved Road area were affected (see Table 4). From the previous section, it is understood that
future flood events are more likely to occur between June and September, and therefore, it could be expected that the
textile businesses are likely to face a greater loss in the forthcoming decades, particularly the businesses located in the
Ved Road area. It is, therefore, imperative to enhance resilience capacity of the textile businesses in Surat to avoid large
potential damages in the near future.
As expected, around 6 per cent of sample businesses felt that the impact from the 2006 flood was very high, and 78 per
cent of sample businesses felt they were high (see Table 4 and Figure 9). This finding reveals that a majority of textile
businesses were affected during flood in the year 2006. The textile businesses located in the Ved Road area experienced
higher damages compared to those in other locations; topographically, this area is close to the Tapi River and is also in a
low-lying area.
Table 4. Experienced flood risks and respondents’
perceptions of 2006 flood impact
Khatodara & LH
Ved Road Katargam Road Total
No. % No. % No. % No. %
Experienced flood risks
Flood in 2006 99 100 27 100 18 100 144 100
Khadi flood in 2013 99 100 2 7.4 12 66.7 113 78.5
Impact of flood in 2006 (respondents’ perceptions)
Very high 5 5.05 0 0.00 3 16.67 8 5.56
High 91 91.92 18 66.67 3 16.67 112 77.78
Moderate 3 3.03 8 29.63 9 50.00 20 13.89
Low 0 0.00 1 3.70 3 16.67 4 2.77
Source: authors’ computation based on primary dataYou can also read