Fluorinated PLGA-PEG-Mannose Nanoparticles for Tumor-Associated Macrophage Detection by Optical Imaging and MRI
←
→
Page content transcription
If your browser does not render page correctly, please read the page content below
ORIGINAL RESEARCH
                                                                                                                                             published: 27 August 2021
                                                                                                                                       doi: 10.3389/fmed.2021.712367

                                              Fluorinated PLGA-PEG-Mannose
                                              Nanoparticles for Tumor-Associated
                                              Macrophage Detection by Optical
                                              Imaging and MRI
                                              Giorgia Zambito 1,2,3† , Siyuan Deng 4† , Joost Haeck 5 , Natasa Gaspar 1,2,6 ,
                                              Uwe Himmelreich 7 , Roberta Censi 4 , Clemens Löwik 1,2 , Piera Di Martino 4* and
                                              Laura Mezzanotte 1,2*
                                              1
                                               Department of Radiology and Nuclear Medicine, Erasmus Medical Center, Rotterdam, Netherlands, 2 Department of
                                              Molecular Genetics, Erasmus Medical Center, Rotterdam, Netherlands, 3 Medres Medical Research GmBH, Cologne,
                                              Germany, 4 School of Pharmacy, University of Camerino, Camerino, Italy, 5 Applied Molecular Imaging Facility of Erasmus MC
                          Edited by:          (AMIE) Core Facility, Erasmus Medical Center, Rotterdam, Netherlands, 6 Percuros B.V., Enschede, Netherlands, 7 Biomedical
                            Wu Yuan,          MR Unit, Molecular Small Animal Imaging Center (MoSAIC), University of Leuven (KU Leuven), Leuven, Belgium
       The Chinese University of Hong
                        Kong, China
                         Reviewed by:
                                              Tumor-associated macrophages (TAMs) promote cancer growth and metastasis, but
                          Sridhar Goud,       their role in tumor development needs to be fully understood due to the dynamic changes
     National Institutes of Health (NIH),     of tumor microenvironment (TME). Here, we report an approach to visualize TAMs by
                           United States
                            Ankit Saneja,     optical imaging and by Fluorine-19 (19 F) magnetic resonance imaging (MRI) that is largely
    Institute of Himalayan Bioresource        applied to track immune cells in vivo. TAMs are targeted with PLGA-PEG-mannose
               Technology (CSIR), India
                                              nanoparticles (NPs) encapsulating perfluoro-15-crown-5-ether (PFCE) as MRI contrast
                   *Correspondence:
                       Piera Di Martino
                                              agent. These particles are preferentially recognized and phagocytized by TAMs that
             piera.dimartino@unicam.it        overexpress the mannose receptor (MRC1/CD206). The PLGA-PEG-mannose NPs
                     Laura Mezzanotte         are not toxic and they were up-taken by macrophages as confirmed by in vitro
          l.mezzanotte@erasmusmc.nl
                                              confocal microscopy. At 48 h after intravenous injection of PLGA-PEG-mannose NPs,
     † These authors have contributed
                                              4T1 xenograft mice were imaged and fluorine-19 nuclear magnetic resonance confirmed
    equally to this work and share first
                            authorship        nanoparticle retention at the tumor site. Because of the lack of 19 F background in the
                                              body, observed 19 F signals are robust and exhibit an excellent degree of specificity. In
                    Specialty section:        vivo imaging of TAMs in the TME by 19 F MRI opens the possibility for detection of cancer
          This article was submitted to
                Translational Medicine,
                                              at earlier stage and for prompt therapeutic interventions in solid tumors.
                a section of the journal                                                                                                                19
                                              Keywords: cell tracking, perfluorocarbon, tumor-associated macrophage, contrast agent,                         F, magnetic
                   Frontiers in Medicine
                                              resonance imaging, breast cancer
            Received: 20 May 2021
            Accepted: 27 July 2021
          Published: 27 August 2021           INTRODUCTION
                            Citation:
         Zambito G, Deng S, Haeck J,          Inflammation is one the major effect of cancer and it plays a pivotal role in cancer progression
  Gaspar N, Himmelreich U, Censi R,           and metastasis (1). In healthy conditions, macrophages (Mφ) exert pro-inflammatory and
            Löwik C, Di Martino P and         cytotoxic effect leading the immune response against tumor development (2). In solid tumors,
      Mezzanotte L (2021) Fluorinated
                                              tumor associated-macrophages (TAMs) are generally skewed away from the classical activation
  PLGA-PEG-Mannose Nanoparticles
   for Tumor-Associated Macrophage
                                              toward an alternative tumor promoting phenotype and becoming the major constituent
     Detection by Optical Imaging and         of tumor malignancy (3, 4). Thus, presence of TAMs in the tumor microenvironment
          MRI. Front. Med. 8:712367.          (TME) is correlated with increased tumor metastasis, angiogenesis, and tumor aggressiveness
     doi: 10.3389/fmed.2021.712367            (5). In recent studies, histological sample of necrotic breast cancers have shown high

Frontiers in Medicine | www.frontiersin.org                                         1                                           August 2021 | Volume 8 | Article 712367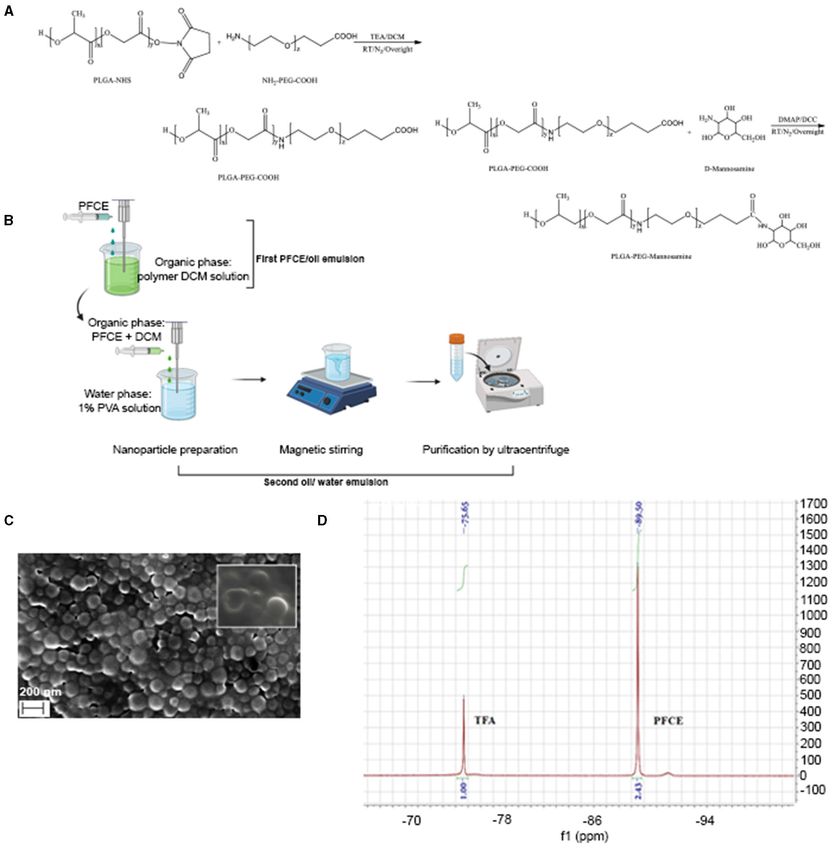
Zambito et al.                                                                                             PLGA-NPs for TAMs Detection by MRI

tumor-associated macrophage infiltration correlating with               by the mononuclear phagocyte system (MPS) for in vivo
unfortunate prognosis (6). Indeed, TAMs can efficiently enter           purposes. To actively target tumor-associated macrophages, the
the necrotic core of the breast cancer and still functioning            surface of PLGA-PEG nanoparticles has been also decorated
in hypoxic-necrotic areas. In this regard, the ability to label         with mannosamine ligand that is preferentially recognized
and observe TAMs non-invasively and over the time can                   and internalized by TAMs overexpressing mannose receptors
tremendously help to understand the temporal and spatial                (CD206) (20). In addition, fluorescein isothiocyanate (FITC) has
localization of this population in the TME (7).                         been linked to the polymeric shell of the PLGA-PEG NPs allowing
    Recently, the magnetic resonance imaging (MRI) technique            further in vitro and ex vivo validations. All in all, intravenously
has been used to image inflammation and to track immune                 injected mannose- decorated 19− F based-PLGA-PEG NPs aim to
cells in vivo with no need of radiation (8). In particular,             enhance targeting of recruited tumor-associated macrophages in
perfluorocarbons (PFCs) are emerging as promising contrast              a humanized mouse model of breast cancer by 19 F-MRI.
agents for MRI cell tracking (9, 10). This is because, fluorine-
based contrast agents are found only in traces in biological
tissue meaning that the fluorine background is minimal and              MATERIALS AND METHODS
that the signal from exogenous fluorine is highly specific in
                                                                        Materials
vivo (10). Amongst PFCs, perfluoro-15-crown-5-ether (PFCE)
                                                                        Unless stated, chemicals were purchase from Sigma Aldrich
is one of the most attractive MRI contrast agents because it
                                                                        (Stenheim, Germany) and used as received. Poly (D,L-lactide-
is FDA approved in a form of emulsion and therefore it is
                                                                        co-glycolide) (PLGA) copolymer (50/50, Resomer RG502H
not toxic (11). However, most of PFCs are not miscible with
                                                                        Mw 24,000-38,000) was purchased from Boehringer Ingelheim
hydrophilic or hydrophobic solvents due to the strong carbon-
                                                                        (Ingelheim am Rhein, Germany). Perfluoro-15-crown ether
fluorine covalent bond and strong electron withdrawing effects of
                                                                        (PFCE) was provided by Exfluor Research Corporation
fluorine. Thus, PFCs are typically prepared as lipid-based nano-
                                                                        (Texas, USA). Agilent Polystyrene calibration kit for GPC
emulsions with low toxicity and longer circulation time (12).
                                                                        characterization was obtained from Agilent Technologies
However, nano-drops of PFCs show limited stability in vivo due
                                                                        (Santa Clara, U.S.A.). Ultrapure water was produced in the
to the low affinity amongst the PFCs, the continuous phase and
                                                                        laboratory according to a Milli-Q R system (Merck Millipore,
the surfactant (7). In general, the physical structure of nano-
                                                                        Darmstadt, Germany).
emulsion may also restrict the combination with other functional
molecules such as drugs, fluorescent tracker or surface ligand
for specific targeting. To this purpose, biodegradable organic-         Proton Nuclear Magnetic Resonance
based nanocarriers like liposomes, dendrimers, micelles, and            Spectroscopy (1 H-NMR)
polymeric NPs act as protector and provide a good stability             Chemical structures and number-average molecular weight (Mn)
of the payload (13). In this context, different strategies can          of synthesized polymers were characterized by proton nuclear
be used for tumor targeting and tumor imaging (14). For                 magnetic resonance spectroscopy (1H NMR, Varian Mercury
instance, “Passively targeted” nanoparticles (NPs) exploit solely       plus 400, Crawley, UK) using CDCl3 or D2O as solvents.
the enhanced permeability and retention (EPR) effect and                Chemical shifts were referred to the solvent peak (δ = 7.26 ppm
allow to target cancer systemically. However, the circulation of        for CDCl3, δ = 4.79 ppm for D2O).
passively targeted NPs is often prevented by main physiological
barriers: the extravasation of the tumor vasculature especially
for high-EPR tumors that reduces nanocarrier accumulation;
                                                                        Gel Permeation Chromatography
                                                                        Gel permeation chromatography (GPC) was employed to
the NPs clearance by mononuclear phagocytic system (MPS),
                                                                        determine the weight average molecular weight (Mw), number
sinusoidal cells of the liver and Kupffer cells (15). On the
                                                                        average molecular weight (Mn) and the polydispersity index
contrary, “actively targeted” nanoparticles can help to overcome
                                                                        (PDI) of copolymers. GPC measurements were carried out by
such barriers and to deliver greater amount of payload to
                                                                        using a TSK gel G4000HHR column (Tosoh Bioscience, Tokyo,
the desired compartment thanks to the functionalization of
                                                                        Japan), 7.8 mm ID × 30.0 cm L, pore size 5 µm. Polystyrenes of
the polymeric surface. Amongst nanocarriers, poly-lactic-co-
                                                                        defined molecular weights ranging from 580 to 377,400 Da were
glycolic acid (PLGA) an FDA approved copolymer, is one of
                                                                        used as calibration standards. The eluent was tetrahydrofuran
the most exploited system in pre-clinical research owed to
                                                                        (THF), the elution rate was 1.0 ml/min and the column
its biodegradability, biosafety, biocompatibility, versatility in
                                                                        temperature was 35◦ C. The samples were dissolved in THF at a
formulation and functionalization and long shelf-life (16, 17).
                                                                        concentration of 5 mg/ml.
    Herein, we have focused on 19 F-based PLGA nanoparticles
(NPs) to detect TAMs accumulation in humanized mice bearing
breast cancer as tumor model (4T1 cells). To this purpose, PLGA         Fourier Transform Infrared Spectroscopy
NPs have been designed to encapsulate PFCE contrast agent               Infrared spectra of the synthesized polymer were recorded
and preserving its magnetic properties (18, 19). In addition,           by a Fourier transform infrared spectrophotometer (FT-IR,
the polymeric shell of PLGA has been functionalized with                PerkinElmer, USA) at the wavelength range of 4,000-500 cm−1 .
polyethylene glycol (PEG) chains that enhance the plasmatic             All the spectra were recorded against a background of an
half-life of PLGA NPs and prevents the rapid opsonization               air spectrum.

Frontiers in Medicine | www.frontiersin.org                         2                                    August 2021 | Volume 8 | Article 712367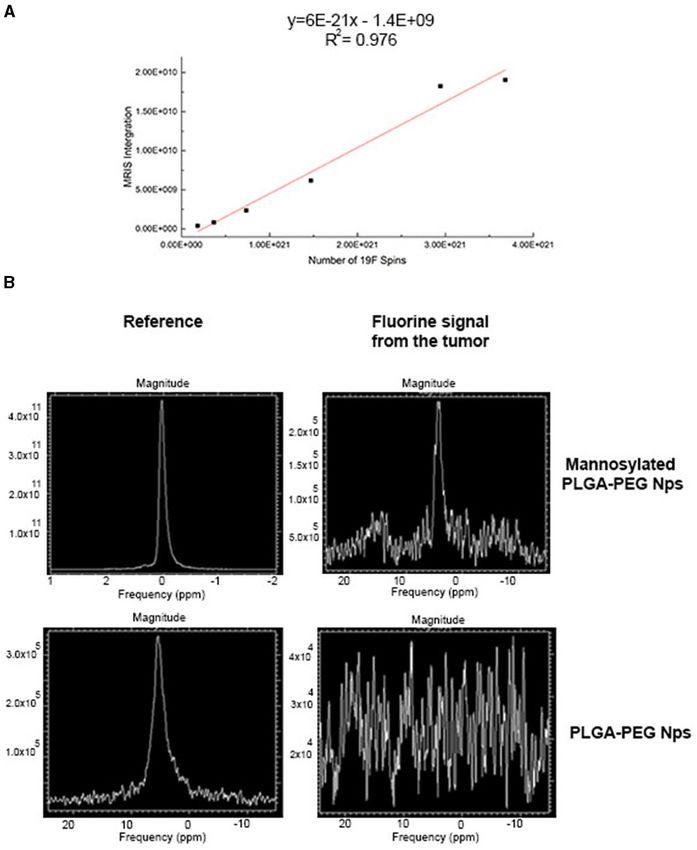
Zambito et al.                                                                                         PLGA-NPs for TAMs Detection by MRI

Synthesis and Characterization of
Polymers: PLGA-PEG-COOH,
PLGA-PEG-FITC, and
PLGA-PEG-Mannosamine
Carboxyl terminal groups of PLGA were activated and converted
to PLGA-NHS for the subsequent conjugation with polyethylene
glycol (PEG). Briefly, 2 g PLGA 503H polymer was dissolved in
10 ml anhydrous dichloromethane (DCM) followed by adding an
excess of N-hydroxy succinimide (NHS, 46.0 mg, 0.4 mmol) and
N,N’-dicyclohexylcarbodiimide (DCC, 82.5 mg, 0.4 mmol). The
reaction was stirred at room temperature overnight, under the N2
atmosphere. To purify, PLGA-NHS was precipitated in diethyl            Chemical Synthesis Scheme of PLGA-PEG-NH2
ether and washed by cold mixture of diethyl ether and methanol
three times to remove the residual NHS.                                   D-mannosamine was covalently conjugated to the acid
                                                                       terminal groups of PLGA-PEG-COOH copolymer to yield
                                                                       PLGA-PEG-mannosamine copolymer. Briefly, the synthesized
                                                                       PLGA-PEG-COOH copolymers (200 mg, 0.006 mmol) were
                                                                       dissolved in 2.5 ml D-mannosamine solution in Dimethyl
                                                                       formamide (DMF) at a concentration of 0.025M. Then, 4-
                                                                       dimethylaminopyridine (DMAP, 7.3 mg, 0.06 mmol) and DCC
Chemical Synthesis Scheme of PLGA-NHS                                  (123.8 mg, 0.6 mmol) were added stepwise. The reaction mixture
                                                                       was stirred at room temperature overnight under nitrogen
   PLGA-PEG copolymers with carboxyl terminal groups                   atmosphere. PLGA-PEG-mannosamine was precipitated in
and amino terminal groups were synthesized by conjugated               a cold mixture of diethyl ether and methanol, dried by
amino groups of NH2 -PEG-COOH and NH2-PEG-NH2                          desiccator under vacuum. Mn, Mw, and PDI were characterized
correspondingly to the N-hydroxysuccinimide esters of resulting        by GPC, and chemical structures were determined by 1 H-
PLGA-NHS. In details, PLGA-NHS (500 mg, 0.015 mmol) was                NMR spectroscopy.
dissolved in 5 ml anhydrous DCM. Then NH2 -PEG-COOH
or NH2-PEG-NH2 (44.1 mg, 0.015 mmol) was added in the
DCM solution with trimethylamine (TEA, 13.3 µl, 0.09 mmol)
as catalyst. The reaction was processed at room temperature
overnight, under N2 atmosphere. PLGA-PEG copolymer was
precipitated with a cold mixture of diethyl ether and methanol
and washed three times by the same solvents, then dried by
desiccator under vacuum. number-average molecular weight
(Mn ), the molecular weights (Mw ) and the polydispersity index
(PDI) were characterized by gel permeation chromatography
(GPC, TSK gel G4000HHR column (Tosoh Bioscience, Tokyo,
Japan). Mn and chemical structures were determined by proton
nuclear magnetic resonance spectroscopy (1 H-NMR, arian
Mercury plus 400, Crawley, UK).                                          Chemical Synthesis Scheme of PLGA-PEG-Mannosamine

                                                                          Fluorescein isothiocyanate (FITC) was conjugated to
                                                                       PLGA-PEG-NH2 to yield fluorescently labeled PLGA-PEG
                                                                       nanoparticles. FITC (4.21 mg, 0.011 mmol) and PLGA-PEG-
                                                                       NH2 (100 mg, 0.0027 mmol) were dissolved in 2.5 ml anhydrous
                                                                       dimethylsulfoxide (DMSO) at room temperature overnight. To
                                                                       purify, the reaction mixture was dialyzed against DMSO and
                                                                       water sequentially (Mw cutoff = 12-24 kDa), then isolated by
                                                                       lyophilization as a yellow powder. The FITC conjugation was
                                                                       characterized by measurement of fluorescence absorption at an
                                                                       excitation wavelength of 490 nm and an emission wavelength of
                                                                       530 nm using Spectramax (iD3, Molecular Devices, USA). The
Chemical synthesis scheme of PLGA-PEG-COOH                             FITC conjugation yield was calculated according to Formula 1.

Frontiers in Medicine | www.frontiersin.org                        3                                  August 2021 | Volume 8 | Article 712367
Zambito et al. PLGA-NPs for TAMs Detection by MRI
Nanoparticle Formulation
PFCE encapsulated PLGA-PEG NPs were formulated by PFCE encapsulated volume
PFCE encapsulation efficency % = × 100%.
PFCE/O/W double emulsion solvent evaporation method using PFCE total volume
PLGA-PEG, PLGA-PEG-mannosamine, or PLGA-PEG-FITC to (2)
obtain NPs with different surface ligands (7). PFCE loaded PLGA
or PLGA-PEG NPs formulation was described in Figure 1B.
Briefly, the first emulsion was prepared by dropwise adding
Cell Culture
Murine macrophage Raw 264.7 cell line and 4T1 cells (murine
PFCE (890 µl) into 3 ml DCM containing 90 mg polymer
mammary carcinoma cells) purchased from (ATCC R TIB-71TM )
along with homogenization (Ultra-Turrax T25, IKA-WERKE,
were cultured in complete DMEM medium (Sigma, St. Louis, Mo,
Germany) at 3,000 rpm for 20 min at RT. Subsequently, the
USA) supplemented with 10% fetal bovine serum (FBS) and 1%
first emulsion was dropped into 18 ml of 1% w/v PVA water
of penicillin and streptomycin and incubated at 37◦ C with 5%
solution and homogenized (Ultra-Turrax R T25 digital, IKA,
CO2 . When cell confluence reached around 80%, dead cells were
Staufen, Germany) in an ice bath at a speed of 13,500 rpm for
washed away with PBS (Lonza) and live cells were detached by
20 min. Then the emulsion was gently stirred at RT overnight for
cell scraper. Cells were centrifuged and re-suspended with 8 ml
solvent evaporation and NPs solidification. NPs were isolated by
of fresh DMEM medium. Cell counting was performed using
centrifugation (High speed micro-centrifuge, D3024R, Scilogex,
BioRad TC20 cell counter.
Rocky Hill, CT, USA) at 10,000 g for 30 min at 4◦ C, and washed
three times by water to remove PVA. Afterwards, NPs were Cell Cytotoxicity and Uptake Assay of
lyophilized (Freeze dryer, FreeZone, Labconco, Kansas City, MO,
USA) by using 7% w/v sucrose as lyoprotectant and stored at
Polarized Macrophages
Cytotoxicity of targeted or untargeted PLGA or PLGA-PEG
−20◦ C. Empty NPs were prepared by suspended the first PFCE/O
nanoparticles was tested for Raw 264.7 cells by Pierce LDH
emulsion step, with only the second O/W emulsion evaporation
assay kit (Thermo Scientific) and following manufacturer’s
in the same conditions as described.
instructions. Cells were treated with nanoparticles at different
concentrations ranging from 0 to 2.5 mg/ml and incubated for
Size and Zeta Potential
24 h. For uptake assay, Raw 264.7 cells were first polarized for
Zeta potential, polydispersity index (PDI) and size of the
anti-tumorigenic (M1) or pro-tumorigenic (M2) phenotypes.
nanoparticles were characterized by dynamic light scattering
M1 phenotype was made by incubating cells for 24 h with
(DLS) at fixed at fixed 90◦ scattering angle at 25◦ C by Malvern
lipopolysaccharide (LPS) (100 ng/ml) and Interferon-gamma
Zetasizer 2000 (Malvern, UK). Suspensions were diluted in
(IFN-γ) (50 ng/ml), both purchased from Sigma-Aldrich. M2
distilled water. Measurements were performed in triplicate at
phenotype was made by incubating cells with Interleukin-
room temperature.
4 (IL-4, Sigma-Aldrich) (20 ng/ml) for 24 h to obtain M2
Scanning Electron Microscopy highly expressing CD206 receptor. After polarization, cells
Nanoparticle morphology was determined by a field emission- were seeded in 24-well plates (8 × 10⁴ cells per well) and
scanning electron microscope (FE -SEM Zeiss Sigma 300, Zeiss, incubated with targeted or un-targeted PLGA-PEG nanoparticles
Germany). SEM sample stage was prepared by placing a double- (1 mg/ml). Incubation was performed for 1, 6, and 24 h at
sided adhesive carbon tape on an aluminum stub. One small 37◦ C. After the incubation time, wells were gently washed with
drop of 1 mg/ml nanoparticle sample suspended in ultrapure PBS to discard particles not up taken and green fluorescence
water was placed on the sample stage and then dried at of FITC was measured by selecting excitation wavelength at
37◦ C overnight. Subsequently, the dried sample was sputtered 490 nm an emission wavelength of 530 nm by Spectramax (iD3
under vacuum with a chromium layer of approximately 100 series, Molecular Devices). Raw 264.7 cells not polarized (M0
Å thickness (Quorum Q150T ES, Quorum Technologies, UK) phenotype) were used as control and all the tests were performed
prior to analysis. multiple times in triplicate.
Fluorescence Microscopy
Determination of PFCE Encapsulation Internalization of PLGA nanoparticles targeted (PLGA-FITC-
Efficacy by 19 F NMR PEG-Mannose loaded with PFCE) or untargeted (PLGA-
PFCE load content and encapsulation efficiency of PLGA- FITC-PEG loaded with PFCE) nanoparticles was confirmed
PEG, and PLGA-PEG-MN nanoparticles was determined by confocal microscopy. Raw 264.7 cells were seeded in a
by Fluorine-19 nuclear magnetic resonance spectroscopy six well plate (80.000 cells per well). After cell attachment,
(19F-NMR). Lyophilized nanoparticles were dissolved cells were treated with targeted or untargeted nanoparticles
in CDCl3 containing 0.1 M trifluoroacetic acid (TFA) as (1 mg/ml) for 1 h. Wells were then washed three times
internal standard. The amount of PFCE was calculated by the and lysosomes were stained by deep red LysoTrackerTM dye
integration ratio between PFCE peak to TFA peak. Fluorine (Thermo Fisher Scientific) incubated for 20 min before cell
contents were calculated according to the Formula 1 and fixation. Cells were then washed gently with PBS three times
Formula 2. and fixated with 4% paraformaldehyde (PFA) for 20 min.
After PBS wash, cell membrane was stained by PKH26 red
PFCE volume loaded in nanoparticles fluorescent cell membrane label kit (Sigma-Aldrich, City, state)
PFCE load content = (1)
Weight of nanoparticles and nuclei were stained with Vectashield mounting-DAPI blue
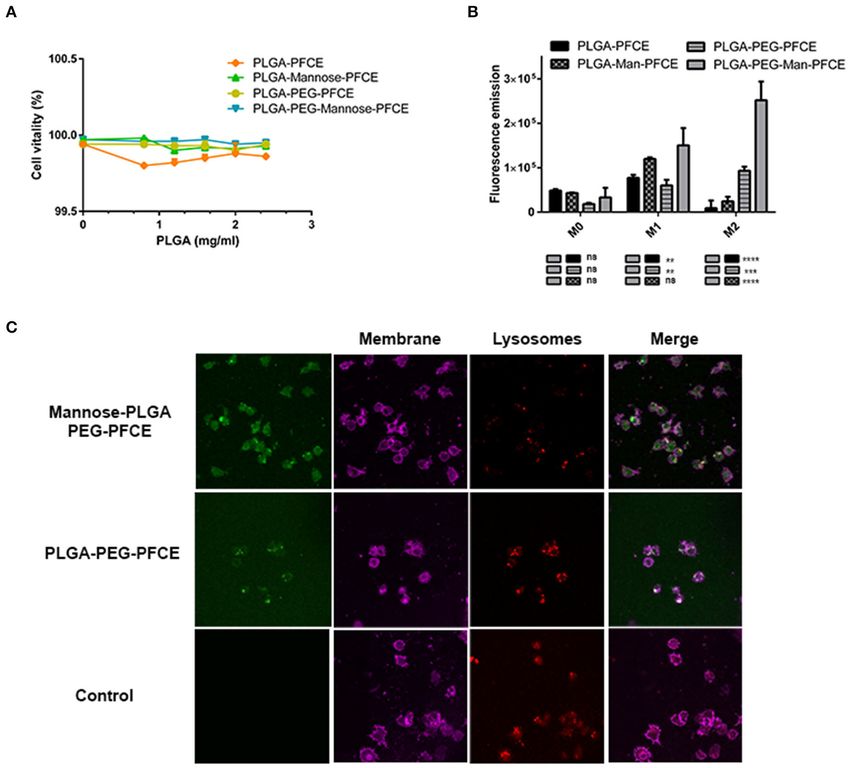
Frontiers in Medicine | www.frontiersin.org 4 August 2021 | Volume 8 | Article 712367Zambito et al. PLGA-NPs for TAMs Detection by MRI FIGURE 1 | Chemical synthesis and characterization of PLGA-PEG nanoparticles. (A) Illustrative chemical synthesis of PLGA-PEG-COOH and PLGA-PEG-mannose copolymers. (B) Schematic illustration for PFCE/Oil/Water double-emulsion and solvent-evaporation method used to produce PLGA-PEG, PLGA-PEG-mannosamine, or PLGA-PEG-FITC nanoparticles. Scanning Electron Microscopy (SEM) of PLGA-PFCE nanoparticles. (C) Scanning electron microscopy (SEM) image of PFCE encapsulatin PLGA NPs. (D) 19 F-NMR spectrum of PFCE encapsulated PLGA-PEG-FITC-mannose NPs in CDCl3 d in ppm: −75.65 (3F, CF3 COOH); −89.50 (20F, C10 F20 O5 ). fluorescent dye (LSBio). Fluorescent NPs uptaken by Raw (Carl Zeiss, Oberkochen, Germany) was used for cell imaging. 264.7 cells were imaged by Leica SP5 confocal microscope Nanoparticles, cell membranes and lysosomes were visualized equipped with Ar-He/Ne lasers (Leica Microsystems, Wetzlar, with respective channels at 488 nm (green), 561 nm (red), and Germany). A 63x magnification with oil immersion objective 633 nm (deep-red). Frontiers in Medicine | www.frontiersin.org 5 August 2021 | Volume 8 | Article 712367
Zambito et al.                                                                                               PLGA-NPs for TAMs Detection by MRI

In vitro Fluorine-19 Magnetic Resonance                                   6 cm, slice thickness = 2.5 cm). MRS processing was performed
Spectroscopy                                                              in SAGE 7.6.2 (GE Healthcare, Little Chalfont, UK) on the MR
Eppendorf tubes loaded with different concentrations of PFCE              901 Discovery system. For processing of the data, time domain
ranging from 5 to 100 µl were used to create a calibration curve.         signals were apodized with a 10 Hz line broadening function,
An MR 901 Discovery 7T magnet (Agilent Technologies, Santa                after which the signal was zerofilled to 4,096 points. Subsequently
Clara, CA, USA) with a preclinical front-end (GE Healthcare,              the time domain signal was Fourier transformed and the resulting
Little Chalfont, UK) was used for MRS acquisition. The system is          spectrum was properly phased to show an absorption mode
equipped with a gradient set with a maximum gradient strength             resonance line. 19 F in the sample was quantified by reference to
of 300 mT m−1 , a rise-time of 600 T m−1 s−1 and an inner                 a standard curve, which was obtained by measuring a dilution
diameter of 310 mm. For transmission and reception, an in-                series of PFCE with known 19 F content.
house-built dual tuned 1H/19F single channel surface coil with
a diameter of 2 cm was used. The 19F MRS spectrum was                     Ex vivo Determination of PFCE
recorded using a EchoSCI sequence (TR/TE = 1,250/15 ms, NEX               Encapsulation Efficacy by 19 F NMR
= 128, FOV = 6 cm, slice thickness = 2,5 cm). MRS processing              Spectroscopy
was performed in SAGE 7.6.2 (GE Healthcare, Little Chalfont,              A 400 MHz Bruker Avance II NMR spectrometer (Bruker
UK) on the MR 901 Discovery system. For processing of the                 Biospin, Rheinstetten, Germany) was used to perform 19F NMR
data, time domain signals were apodized with a 10 Hz line                 with a 5 mm broadband probe, which can operate at 376.5
broadening function, after which the signal was zerofilled to             MHz for ex vivo experiments. Excised organs (liver, lungs, and
4,096 points. Subsequently the time domain signal was Fourier             spleens and 4T1 subcutaneous tumors) were harvested and flash
transformed and the resulting spectrum was properly phased to             frozen by liquid nitrogen. The prepared sample (0.4 ml, mixed
show an absorption mode resonance line. 19F in the sample was             with D2O) was transferred to a 5 mm NMR tube (Wilmad,
quantified by reference to a standard curve, which was obtained           Vineland, NJ, USA). As a reference compound, 5-fluorocytosine
by measuring a dilution series of PFCE with known 19 F content.           (0.1 ml, 5 mM 19F concentration) was added to determine the
                                                                          chemical shift and 19F concentration for each sample. The
Mouse Model                                                               pH value of the sample was confirmed to be around 7 when
BALB/c mice (6-8-week years old) were provided access to food             preparing the sample using Bromothymol blue indicator and
and water ad libitum and were hosted in the animal facility at            the temperature was maintained at 37 C during the experiment.
the Erasmus MC (Rotterdam, The Netherlands). All experiments              The acquisition parameters were as follows: frequency = 376.5
were performed according to the guidelines for animal care of the         MHz, spectral width = 350 ppm, relaxation delay = 5 s, data
Erasmus MC Animal Experiments Committee. For tumor mouse                  points = 64 k. After phase and baseline correction of the
model, 8 x 10⁴ of LUC2 luciferase-expressing 4T1 breast cancer            acquired 19 F NMR spectra using the Topspin software (Bruker
cells were injected subcutaneously in the left flank of the mice (n       Biospin, Rheinstetten, Germany), the 19 F NMR signals were
= 4 mice for each group). This cell line has been chosen because is       quantified relative to the 5-fluorocytosine signals (reference) by
a late state of breast cancer and exhibits necrosis. Tumor growth         peak integration. The total 19 F content of the excised organs
was measured by calipers and by bioluminescence imaging by                (4T1 tumor, liver, spleen and lungs) was determined and the
IVIS spectrum imager (model, Perkin Elmer, city, state).                  results were normalized to the tissue weight generating a signal
                                                                          expressed as a number of fluorine atoms per gram of tissue.
In vivo Fluorine-19 Magnetic Resonance
Spectroscopy                                                              Statistical Analysis
1H  and   19 F
            images were acquired 48 h after injection of 1 mg/ml          The data are presented as mean ± standard deviation (SD). In
of targeted (PLGA- PEG -FITC-Mannose loaded with PFCE) or                 vitro and in vivo tests were performed using Graphpad 7 software
untargeted (PLGA -PEG-FITC loaded with PFCE) nanoparticles                and One-way ANOVA and t-test analysis of variance were used
by 7T MRI system (Bruker Biospin, city, Germany). All the                 to analyze the differences between the groups. Significance was
subcutaneous breast tumors have a diameter ranging between                attributed when P < 0.001 (∗ ) for in vitro tests and P < 0.05 (∗ )
∼0.6 and ∼0.8 mm3 of diameter. In vivo imaging was done                   for in vivo tests.
using a custom built dual 1 H/19 F coil for in vivo imaging.
Mice (n = 4 for each group) were anesthetized using 1.5%.                 RESULTS
isoflurane (Isoflutek, Laboratorios Karizoo). Body temperature
was monitored and regulated during imaging. Reference tube                Synthesis and Characterization of
of known 19 F concentration (7.01E + 19 19 F for PLGA-PEG-                Polymers
Mannose concentrated 1 mg/ml; and 4.95E + 19 19 F for PLGA-               PLGA-PEG-NH-2 , PLGA-PEG-COOH, PLGA-PEG-FITC and
PEG nanoparticles) was placed alongside the mouse to optimize             PLGA-PEG-mannose copolymers were successfully synthesized
quantification of fluorine detected at the tumor site.                    with a yield of ∼60-85%. The synthesis of PLGA-PEG-mannose
   Magnetic resonance spectrometry was used to measure the                copolymer is shown in Figure 1A. Details of the polymer
19F content per cell. The 19 F MRS spectrum was recorded using            characteristics such as number-average molecular weight (Mn ),
a EchoSCI sequence (TR/TE = 1,250/15 ms, NEX = 128, FOV =                 the molecular weights (Mw ) and the polydispersity index (PDI)

Frontiers in Medicine | www.frontiersin.org                           6                                    August 2021 | Volume 8 | Article 712367
Zambito et al. PLGA-NPs for TAMs Detection by MRI are provided in Table 1. All the resulting copolymers presented linkage between PLGA and PEG segment of the PLGA-PEG PDI approximately of 1.4-1.7 with unimodal and symmetric peak copolymer (22). Compared with the spectrum of PLGA-PEG- in the GPC. This result confirmed the synthesized copolymer COOH copolymer, the one corresponding to PLGA-PEG- possessed narrow distribution of molecular weight. mannosamine presents new peaks at 3,264, 2,917, 2,851 cm−1 The conjugation of mannosamine to PLGA-PEG attributed to the stretching vibrations of the O-H and the C- copolymer was confirmed by by comparing 1 H-NMR H bonds of methylene and methyne groups, respectively, which spectra of PLGA-PEG-mannose to those of PLGA-PEG- were contributed by mannosamine. This result demonstrated COOH (Supplementary Figure 1A) and D-mannosamine that the mannosamine was efficiently conjugated onto the (Supplementary Figure 1B). The peaks at 1.58 and 5.22 PLGA-PEG-COOH copolymer. The FITC conjugation molar ppm were characteristics of methyl groups and methine ratio of PLGA-PEG-FITC copolymer was 85% measured by the groups of glycolic acid (GA) segments, while the peak at fluorescence absorption according to standard curve build by 4.82 ppm was attributed to methylene group of lactic acid pure FITC solution. (LA) segments, which were both contributed by PLGA chains (Supplementary Figure 1C). The peak observed at 3.64 ppm corresponded to methylene groups of PEG segment. The Formulation and Characterization of integration ratio between the characteristic peaks of PEG and PLGA-PEG Nanoparticles PLGA chains reveals that PEG was chemically conjugated on Formulation of PFCE loaded PLGA-PEG nanoparticles (NPs) PLGA with mole ratio around 1:1. The peaks of mannosamine is illustrated in Figure 1B. NPs showed a mean diameter in overlapped with the peak of PEG (3.62 ppm), therefore only the range of ∼239 and ∼345 nm depending on nanoparticle one small peak at 4.11 ppm was detected and attributed to formulation. PFCE encapsulated nanoparticles showed a slightly mannosamine (21). higher diameter of ∼50 nm compared with the empty ones. FT-IR analysis was carried out to further confirm the All the particles were also monodispersed presenting a low amide bond formed between PLGA and PEG segments, and polydispersity index (PDI). Additionally, all the nanoparticles also the chemical conjugation of mannosamine onto PLGA- displayed negative zeta potentials due to the existence of PEG-COOH copolymer. FT-IR spectra of PLGA-PEG-COOH terminal carboxyl groups in the PLGA polymer that is in and PLGA-PEG-Mannosamine copolymers were displayed in the deprotonated form at physiological pH (23). Indeed, zeta Supplementary Figure 2. The absorption peaks at 1,630 and potential values were between −31 and −17 mV (Table 2). 1,510 cm−1 were assigned to the C=O and N-H bonds, Mannosamine decorated PLGA-PEG NPs presented a less respectively, which reveals the successful conjugation via amide negative zeta potential compared with the other NPs without TABLE 1 | Mn, Mw, and PDI of PLGA-PEG and PLGA-PEG-mannose copolymers. Name Mwa (kDa) Mna (kDa) LA:GAb PLGA:PEGb PDIa PLGA-PEG-COOH 14 10 1:1 1:0.93 1.4 PLGA-PEG-mannose 9.2 7.3 1:0.95 1:0.82 1.3 PLGA-PEG-NH2 18.7 12.7 1:1 1:0.98 1.5 PLGA-PEG-FITC – – 1:1 1:0.92 – a Determined by GPC; b Determined by 1 H-NMR. TABLE 2 | Particle Size, PDI, and Zeta potential of PLGA-PEG nanoparticles. Nanoparticles Load Particle size (nm) PDI[iii] Zeta potential (mV) PLGA[i] –PEG - 258 ± 10 0.28 ±0.01 −22.3 ± 0.6 PLGA[i] –PEG +PFCE[ii] 371 ± 8 0.23 ± 0.03 −26.3 ± 0.4 PLGA[i] -PEG-FITC - 299 ± 12 0.36 ± 0.05 −26.8 ± 0.4 PLGA[i] -PEG-FITC +PFCE[ii] 345 ± 8 0.20 ± 0.01 −24.2 ± 0.2 PLGA[i] -PEG-mannose - 199 ± 3 0.10 ± 0.03 −12.9 ± 0.6 PLGA[i] -PEG-mannose +PFCE[ii] 386 ± 3 0.23 ± 0.00 −17.9 ± 0.1 PLGA[i] -PEG-mannose-FITC - 222 ± 4 0.22 ± 0.09 −24.2 ± 2.0 PLGA[i] -PEG-mannose-FITC +PFCE[ii] 318 ± 4 0.10 ± 0.02 −19.6 ± 0.4 [i] PLGA, poly(lactide-co-glycolide). [ii] Perfluoro-15-crown-5-ether. [iii] Polydispersity index. Frontiers in Medicine | www.frontiersin.org 7 August 2021 | Volume 8 | Article 712367
Zambito et al.                                                                                                                        PLGA-NPs for TAMs Detection by MRI

mannosamine due to the partial neutralization of the negative                                     nanoparticles and ∼eight-fold higher than un-PEGylated-
charges by mannosamine.                                                                           mannose NPs. Statistical analysis was performed with one-way
    Nanoparticles (NPs) were observed by scanning electron                                        ANOVA, for triplicate samples and significance attributed when
microscopy (SEM) where images confirmed that the PLGA-PFCE                                        P < 0.001. Taken together, PLGA-PEG-mannose nanoparticles
nanoparticles had a relatively uniform diameter of ∼ 200 nm with                                  resulted in the highest uptake by M2-like macrophages compared
a spherical shape and smooth surface (Figure 1C).                                                 to M0-like and M1-like macrophages, suggesting that both
    In some cases, nanoparticles showed dented appearance                                         PEGylation and mannose ligand stimulate the cellular uptake.
supposedly due to the phase separation of PFCE from                                                  To confirm cellular internalization of NPs, M0, M1 and M2-
nanoparticles during the analysis (24). This finding is therefore                                 like Raw 264.7 macrophages were treated with targeted and
an indirect effect of the presence of PFCE within nanoparticles.                                  untargeted nanoparticles conjugated or not with PEG (1 mg/ml).
    As depicted in Figure 1D, two peaks were highlighted in the                                   Confocal images of labeled polarized macrophages are shown
spectrum at δ = −75.65 ppm for fluorine atoms of TFA and at δ                                     in Figure 2C, where PLGA-PEG nanoparticles conjugated with
= −89.50 ppm for fluorine atoms of PFCE. The amount of PFCE                                       FITC were stained in green, cell membrane in magenta, and
encapsulated was calculated from the integration ratio between                                    lysosomes in red.
PFCE peak and TFA peak. PLGA-PEG and PLGA-PEG-mannose
nanoparticles had a comparable fluorine encapsulation efficiency:                                 In vivo Fluorine-19 Nuclear Magnetic
65.2% for PLGA-PEG, 67.1% for PLGA-PEG-mannose, and                                               Resonance
similar load content (6.45 µl/mg. for PLGA-PEG and 6.64 µl/mg                                     In order to calculate the amount of 19 F encapsulated in targeted
for PLGA-PEG-mannose). Quantification and encapsulation                                           and untargeted PLGA-PEG NPs, a curve of reference was built
efficiency are outlined in Table 3.                                                               using different dilutions of pure 19 F ranged between 5 and 100
                                                                                                  µl (Figure 3A). In vitro quantification of 19 F spins encapsulated
Cell Cytotoxicity and NPs Uptake Assay of                                                         in 1 mg/ml of targeted and untargeted PLGA-PEG NPs revealed
                                                                                                  an adequate number of 19 F-atoms for further in vivo evaluations.
Polarized Macrophages
                                                                                                  In particular 7.01E + 19 19 F were detected for PLGA-PEG
Initial studies were performed to assess cell viability when
                                                                                                  nanoparticles and 4.95E + 19 19 F were detected for PLGA-PEG-
M2-like Raw264.7 macrophages were treated with targeted
                                                                                                  mannose nanoparticles.
or untargeted PLGA nanoparticles. Cytotoxicity assay was
                                                                                                     4T1-breast xenograft mice (n = 4 per group) received
performed incubating macrophages with different concentration
                                                                                                  1 mg/ml of targeted or untargeted-PLGA-PEG nanoparticles
of nanoparticles ranged between 0 and 2.5 mg/ml and incubated
                                                                                                  intravenously (200 µl of suspension in PBS). 19 F signals from
for 24 h at 37◦ C. Around 100% of cells were not affected by
                                                                                                  the tumor site were quantified 48 h after NPs injection by MRS.
the treatment and all type of nanoparticles were well-tolerated
                                                                                                  A spectrum of 19 F signal was successfully measured from the
(Figure 2A).
                                                                                                  tumor area of mice injected with targeted PLGA nanoparticle by
   To test if fluorescent targeted or untargeted nanoparticles
                                                                                                  7T MRI as shown in Figure 3B (top). As for untargeted-PLGA-
were preferentially up-taken by macrophages with M2-like
                                                                                                  PEG nanoparticles, the signal-to-noise ratio measured from the
phenotype, we first polarized Raw264.7 macrophages into
                                                                                                  tumor site was low and fluorine quantification was not possible.
M1-like macrophages, M2-like macrophages, and unpolarized
                                                                                                  This suggests that the targeted-PLGA-PEG nanoparticles have
macrophages (M0-like phenotype). Later, cells were incubated
                                                                                                  a more efficient accumulation at the tumor site compared to
with targeted and untargeted PEGylation or not, FITC-PLGA
                                                                                                  the untargeted-PLGA-PEG nanoparticles. Notably, preliminary
nanoparticles (1 mg/ml) for 6 h. Figure 2B shows that targeted
                                                                                                  data from ex vivo 19 F NMR suggests that 19 F signal detected
and PEGylated PLGA nanoparticles were preferentially up-taken
                                                                                                  in the tumors after treatment with targeted-PLGA-PEG NPs
by M2-like polarized macrophages. Particularly for the M0-like
                                                                                                  was four-fold greater compared to untargeted-PLGA-PEG NPs
phenotype, not significant differences were highlighted by the
                                                                                                  (Supplementary Figure 3).
uptake of the different nanoparticles. For the M1-like phenotype
group, targeted-PEG-PLGA NPs particles had greater uptake
(∼1.20-fold) than un-PEGylated-mannose NPs and also higher                                        DISCUSSION
uptake than untargeted PEGylated particles (∼1.7-fold). For M2-
like phenotype group, targeted-PEG-PLGA NPs have roughly                                          In this study, we have assessed PLGA-PEG NPs decorated with
a 2.5-fold higher uptake compared to untargeted-pegylated                                         mannose ligand for TAMs detection by 19 F-MRI. This approach

TABLE 3 | PFCE load content and PFCE encapsulation efficiency PLGA-PEG nanoparticles characterized by in vitro 19 F-NMR.

                            Name                                              Number of F-atoms               Load content (µl/mg)           Encapsulation efficiency (%)

19
     F-NMR [i]              PLGA-PEG-FITC- PFCE-                                   3.14 E + 20                        6.45                                65.2
                            PLGA-PEG-mannose -FITC-PFCE                            2.82 E + 20                        6.64                                67.1

[i] Values   are calculated for 1 mg of NPs dissolved in CDCl3 solvent before the analysis at 19 F-NMR.

Frontiers in Medicine | www.frontiersin.org                                                   8                                      August 2021 | Volume 8 | Article 712367
Zambito et al. PLGA-NPs for TAMs Detection by MRI
FIGURE 2 | Characterization of nanoparticles in vitro. (A) Cytotoxicity tests for Raw264.7 macrophage cells treated for 24 h with PLGA-PFCE, PLGA-PFCE-Mannose,
PLGA-PEG-PFCE, and PLGA-PEG-mannose-PFCE nanoparticles (final concentration 1 mg/ml). (B) Uptake efficiency of Raw264.7 macrophage cells polarized in M0
(negative control), M1 (pro-inflammatory), M2 (anti-inflammatory) phenotype and treated for 1 h with PLGA-PFCE, PLGA-PFCE-mannose, PLGA-PEG-PFCE and
PLGA-PEG-mannose-PFCE nanoparticles (final concentration 1 mg/ml). (C) Confocal images of polarized M2-polarized Raw264.7 macrophages treated for 1 h with
mannose (top) and untargeted (middle) PLGA-PEG NPs. Negative control for PLGA-PEG nanoparticles is shown in the bottom panels. Nanoparticles are shown in
green color (FITC labeled); cell membrane is shown in magenta color; lysosomes are shown in deep-red color.
has exploited the use of different types of PLGA nanoparticles Thus, mannose can be used for intracellular delivery of relevant
that are not toxic, stable and by definition more resistant payloads (20, 25, 26).
to mechanical stress. In addition, polymeric nanoparticles of Here, we decided to encapsulate the PFCE perfluorocarbon
PLGA offer the advantage to be further functionalized with as contrast agent for 19 F-MRI. PLGA nanoparticles used as
target ligands. PEGylation and mannosylation show an influence carrier ensure PFCE stability for long storage, allowing for
in circulation and cellular uptake of nanoparticles. Actually, lyophilize, solubilize in suspensions and freeze the particles. In
first of all, PEGylation of PLGA nanoparticles protects them our study, we could produce PLGA nanoparticles of narrow
from complement activation (i.e., opsonization) with longer size the distribution and a size approximately between 330 and
circulation in the blood stream, with the consequence of an 390 nm irrespective to the nanoparticle formulation (Table 2).
improved opportunity for the drug to be released to the SEM images for PLGA-PFCE NPs confirmed rounded and
target site. smoothed surface of nanoparticles. However, PLGA-PEG NPs
Secondly, mannosylation can act as cellular membrane- did not provide resolved photos due to the interference of PVA
docking ligand allowing for nanoparticle internalization surfactant with the analysis. Thus, images of NPs obtained by
in mannose-expressing macrophages especially the M2 TEM would provide more accurate analysis for size and shape
macrophages due to overexpression of mannose receptor. of PLGA-PEG NPs. NPs showed minimal toxicity in vitro when
Frontiers in Medicine | www.frontiersin.org 9 August 2021 | Volume 8 | Article 712367Zambito et al. PLGA-NPs for TAMs Detection by MRI
FIGURE 3 | PFCE magnetic resonance measurement by 19 F-MRI spectroscopy (MRS). (A) Standard curve of pure PFCE contrast agents measured at different
dilution volumes ranging from 5 and 100 µl. (B) 19 F-MRI spectrum of PFCE detected from 4T1tumor-bearing mice and treated with PLGA-PEG-mannose
nanoparticles (top graph) and with PLGA-PEG nanoparticles (bottom graph). Respective external reference tubes (left) were used to set up image acquisition methods
and for PFCE measurements at the tumor site.
incubated with macrophages also for higher concentration like nanoparticles, fluorine signals were detected 48 h after injections.
2.5 mg (Figure 1A). However, it has been shown that vitality We observed higher liver retention of nanoparticles in vivo
of cells is not affected if treated with 20 mg/million cells of most probably due to the continuous uptake by liver like
PLGA nanoparticles (27). The 19 F-payload of particles is similar Kupffer cells, liver sinusoidal endothelial cells (LSECs), and
amongst the different groups as demonstrated by 19 F-MRS and hepatic stellate cells (HSCs) (29). This might be overcome by
19 F-NMR analyses. All the PFCE-nanoparticles were also able to treating mice with clodronate liposomes before NPs injection
target TAMs and be internalized by them especially if they were and blocking non-specific uptake by Kupffer macrophages in
PEGylated and mannosylated (Figures 2B,C). the liver and increasing 19 F-signal due to the greater retention
Finally, PFCE used for in vivo studies is known to be non- of targeted-PLGA NPs in the tumor site (30). Recently, it has
toxic in biological systems. Finally, PFCE used for in vivo also been demonstrated that an antifouling-polymer coatings
studies is known to be non-toxic in biological systems. However, may block non-specific uptake of nanoparticles by liver (31).
19 F-based cell tracking suffers from detection sensitivity and in For untargeted PLGA-nanoparticles, the 19 F signals in the
general thousands of cells per voxel are required for detection tumor did not exceed the background noise arising from the
of labeled cells (28). When injection of targeted-PEG-PLGA surrounding organs. For targeted PLGA-nanoparticles in the
Frontiers in Medicine | www.frontiersin.org 10 August 2021 | Volume 8 | Article 712367Zambito et al. PLGA-NPs for TAMs Detection by MRI
tumor site, the 19 F signals in the tumor had a weak intensity AUTHOR CONTRIBUTIONS
when measured by MRI in vivo, but the concentration of the
PFCE could be successfully quantified by 19 F MRS. Furthermore, GZ, SD, LM, and PD designed the experiments. GZ, SD, and
ex vivo 19 F NMR data confirmed higher retention of 19 F UH performed the experiments and analysed the data. GZ, SD,
signals at the tumor site after injection of targeted-PLGA- and LM wrote the manuscript. JH provided expertise on MRI
PEG NPs compared to injected untargeted-PLGA-PEG NPs measurements. GZ, SD, NG, RC, PD, CL, UH, and LM critically
(Supplementary Figure 3). We believe that higher magnetic field revised the manuscript for important intellectual content. All
strengths or more sophisticated detectors might compensate with authors have read and agreed to the published version of the
the sensitivity of the detection allowing to measure fewer amount manuscript.
of fluorine in the tumor. Altogether the results presented in
the study prove the efficacy of delivering PLGA-PEG-mannose
nanoparticles by TAMs reaching the tumor site in vivo. Future
FUNDING
studies will focus on accumulation of functionalized PEGylated- This work was supported by the Applied Molecular Imaging
nanoparticles delivered by TAMs as a function of tumor growth facility of Erasmus MC (AMIE) and by the Nanomedicine
stage and as a function of the trafficking and timing of Innovation Center Erasmus (NICE) of Erasmus MC of
TAMs in vivo. Rotterdam (The Netherlands). We acknowledge the funding
for this work provided by the European Commission under the
DATA AVAILABILITY STATEMENT H2020 MSCA-RISE award grant number 777682 (CANCER)
The original contributions presented in the study are included and under the H2020-MSCA-ITN award, grant number
in the article/Supplementary Material, further inquiries can be 675743 (ISPIC).
directed to the corresponding author/s.
ETHICS STATEMENT SUPPLEMENTARY MATERIAL
The Supplementary Material for this article can be found
The animal study was reviewed and approved by Erasmus MC
online at: https://www.frontiersin.org/articles/10.3389/fmed.
Animal Experiments Committee (Animal work protocol number
2021.712367/full#supplementary-material
17-867-53).
REFERENCES 10. Srinivas M, Heerschap A, Ahrens ET, Figdor CG, de Vries IJM. (19)F MRI
for quantitative in vivo cell tracking. Trends Biotechnol. (2010) 28:363–
1. Noy R, Pollard JW. Tumor-associated macrophages: from mechanisms to 70. doi: 10.1016/j.tibtech.2010.04.002
therapy. Immunity. (2014) 41:49–61. doi: 10.1016/j.immuni.2014.06.010 11. Ahrens ET, Zhong J. In vivo MRI cell tracking using perfluorocarbon
2. Yang M, McKay D, Pollard JW, Lewis CE. Diverse functions of macrophages probes and fluorine-19 detection. NMR Biomed. (2013) 26:860–
in different tumor microenvironments. Cancer Res. (2018) 78:5492– 71. doi: 10.1002/nbm.2948
503. doi: 10.1158/0008-5472.CAN-18-1367 12. Rho J, Stares E, Adams SR, Lister D, Keach B, Ahrens ET. Paramagnetic
3. Mantovani A, Marchesi F, Malesci A, Laghi L, Allavena P. Tumour-associated fluorinated nanoemulsions for in vivo F-19 MRI. Mol Imaging Biol. (2020)
macrophages as treatment targets in oncology. Nat Rev Clin Oncol. (2017) 22:665–74. doi: 10.1007/s11307-019-01415-5
14:399–416. doi: 10.1038/nrclinonc.2016.217 13. Diou O, Tsapis N, Giraudeau C, Valette J, Gueutin C, Bourasset
4. Choi J, Gyamfi J, Jang H, Koo JS. The role of tumor-associated F, et al. Long-circulating perfluorooctyl bromide nanocapsules
macrophage in breast cancer biology. Histol Histopathol. (2018) 33:133– for tumor imaging by 19FMRI. Biomaterials. (2012) 33:5593–
45. doi: 10.14670/HH-11-916 602. doi: 10.1016/j.biomaterials.2012.04.037
5. Yang L, Zhang Y. Tumor-associated macrophages: from basic 14. Schleich N, Po C, Jacobs D, Ucakar B, Gallez B, Danhier F, et al. Comparison
research to clinical application. J Hematol Oncol. (2017) of active, passive and magnetic targeting to tumors of multifunctional
10:58. doi: 10.1186/s13045-017-0430-2 paclitaxel/SPIO-loaded nanoparticles for tumor imaging and therapy. J
6. Yang M, Li Z, Ren M, Li S, Zhang L, Zhang X, et al. Stromal Control Release. (2014) 194:82–91. doi: 10.1016/j.jconrel.2014.07.059
Infiltration of Tumor-Associated Macrophages Conferring Poor Prognosis 15. Blanco E, Shen H, Ferrari M. Principles of nanoparticle design for
of Patients with Basal-Like Breast Carcinoma. J Cancer. (2018) 9:2308– overcoming biological barriers to drug delivery. Nat Biotechnol. (2015)
16. doi: 10.7150/jca.25155 33:941–51. doi: 10.1038/nbt.3330
7. Srinivas M, Boehm-Sturm P, Figdor CG, de Vries IJ, Hoehn M. Labeling 16. Mir M, Ahmed N, Rehman AU. Recent applications of PLGA based
cells for in vivo tracking using 19F MRI. Biomaterials. (2012) 33:8830– nanostructures in drug delivery. Colloids Surf B Biointerfaces. (2017) 159:217–
40. doi: 10.1016/j.biomaterials.2012.08.048 31. doi: 10.1016/j.colsurfb.2017.07.038
8. Ahrens ET, Bulte JWM. Tracking immune cells in vivo using magnetic 17. Attia MF, Anton N, Wallyn J, Omran Z, Vandamme TF. An overview of
resonance imaging. Nat Rev Immunol. (2013) 13:755–63. doi: 10.1038/ active and passive targeting strategies to improve the nanocarriers efficiency to
nri3531 tumour sites. J Pharm Pharmacol. (2019) 71:1185–98. doi: 10.1111/jphp.13098
9. Temme S, Bönner F, Schrader J, Flögel U. 19F magnetic resonance 18. Zhou Y, Que K-T, Tang H-M, Zhang P, Fu Q-M, Liu Z-J, et al. Anti-CD206
imaging of endogenous macrophages in inflammation. Wiley Interdiscip antibody-conjugated Fe3O4-based PLGA nanoparticles selectively promote
Rev Nanomed Nanobiotechnol. (2012) 4:329–43. doi: 10.1002/ tumor-associated macrophages to polarize to the pro-inflammatory subtype.
wnan.1163 Oncol Lett. (2020) 20:298. doi: 10.3892/ol.2020.12161
Frontiers in Medicine | www.frontiersin.org 11 August 2021 | Volume 8 | Article 712367Zambito et al. PLGA-NPs for TAMs Detection by MRI
19. Anani T, Rahmati S, Sultana N, David AE. MRI-traceable theranostic 29. Park J-K, Utsumi T, Seo Y-E, Deng Y, Satoh A, Saltzman WM, et al. Cellular
nanoparticles for targeted cancer treatment. Theranostics. (2021) 11:579– distribution of injected PLGA-nanoparticles in the liver. Nanomedicine.
601. doi: 10.7150/thno.48811 (2016) 12:1365–74. doi: 10.1016/j.nano.2016.01.013
20. Scodeller P, Simón-Gracia L, Kopanchuk S, Tobi A, Kilk K, Säälik P, et al. 30. Schiedner G, Hertel S, Johnston M, Dries V, van Rooijen N, Kochanek
Precision targeting of tumor macrophages with a CD206 binding peptide. Sci S. Selective depletion or blockade of Kupffer cells leads to enhanced
Rep. (2017) 7:14655. doi: 10.1038/s41598-017-14709-x and prolonged hepatic transgene expression using high-capacity
21. Alonso-Sande M, des Rieux A, Fievez V, Sarmento B, Delgado A, Evora C, et al. adenoviral vectors. Mol Ther. (2003) 7:35–43. doi: 10.1016/S1525-0016(02)
Development of PLGA-mannosamine nanoparticles as oral protein carriers. 00017-5
Biomacromolecules. (2013) 14:4046–52. doi: 10.1021/bm401141u 31. Nabil G, Bhise K, Sau S, Atef M, EI-Banna HA, Iyer Ak. Nano-engineered
22. Boddu SH, Vaishya R, Jwala J, Vadlapudi A, Pal D, Mitra A. delivery systems for cancer imaging and therapy: Recent advances, future
Preparation and characterization of folate conjugated nanoparticles direction and patent evaluation. Drug Discov Today. (2019) 24:462–
of doxorubicin using PLGA-PEG-FOL polymer. Med Chem. (2011) 91. doi: 10.1016/j.drudis.2018.08.009
2:068–075. doi: 10.4172/2161-0444.1000117
23. Govender T, Stolnik S, Garnett MC, Illum L, Davis SS. PLGA Conflict of Interest: GZ was employed by Medres Medical Research
nanoparticles prepared by nanoprecipitation: drug loading and GmBH (Cologne, Germany). NG is employed by Percuros B.V.
release studies of a water soluble drug. J Control Release. (1999) (Enschede, The Netherlands).
57:171–85. doi: 10.1016/S0168-3659(98)00116-3
24. Srinivas M, Tel J, Schreibelt F, Cruz L-J, Amiri H, Heerschap A, et al. PLGA- The remaining authors declare that the research was conducted in the absence of
encapsulated perfluorocarbon nanoparticles for simultaneous visualization of any commercial or financial relationships that could be construed as a potential
distinct cell populations by (2015) 19F MRI. Nanomedicine (Lond). 10:2339– conflict of interest.
48. doi: 10.2217/nnm.15.76
25. Yang R, Xu J, Xu L, Sun X, Chen Q, Zhao Y, et al. Cancer cell membrane-coated Publisher’s Note: All claims expressed in this article are solely those of the authors
adjuvant nanoparticles with mannose modification for effective anticancer and do not necessarily represent those of their affiliated organizations, or those of
vaccination. ACS Nano. (2018) 12:5121–9. doi: 10.1021/acsnano.7b09041 the publisher, the editors and the reviewers. Any product that may be evaluated in
26. Li Y, Wu H, Ji B, Qian W-P, Xia S, Wang L, et al. Targeted imaging of this article, or claim that may be made by its manufacturer, is not guaranteed or
CD206 expressing tumor-associated M2-like macrophages using mannose- endorsed by the publisher.
conjugated antibiofouling magnetic iron oxide nanoparticles. ACS Appl Bio
Mater. (2020) 3:4335–47. doi: 10.1021/acsabm.0c00368 Copyright © 2021 Zambito, Deng, Haeck, Gaspar, Himmelreich, Censi, Löwik, Di
27. Swider E, Koshkina O, Tel J, Cruz LJ, de Vries JM, Srinivas M. Customizing Martino and Mezzanotte. This is an open-access article distributed under the terms
poly(lactic-co-glycolic acid) particles for biomedical applications. Acta of the Creative Commons Attribution License (CC BY). The use, distribution or
Biomater. (2018) 73:38–51. doi: 10.1016/j.actbio.2018.04.006 reproduction in other forums is permitted, provided the original author(s) and the
28. Makela A. V, Gaudet JM, and Foster PJ. Quantifying tumor associated copyright owner(s) are credited and that the original publication in this journal
macrophages in breast cancer: a comparison of iron and fluorine-based MRI is cited, in accordance with accepted academic practice. No use, distribution or
cell tracking. Sci Rep. (2017) 7:42109. doi: 10.1038/srep42109 reproduction is permitted which does not comply with these terms.
Frontiers in Medicine | www.frontiersin.org 12 August 2021 | Volume 8 | Article 712367You can also read