FOC-MOP - Fuzzy Optimal Clustering based Multi-Objective Parameter Route Selection for Energy Eciency - Research ...
←
→
Page content transcription
If your browser does not render page correctly, please read the page content below
FOC-MOP – Fuzzy Optimal Clustering based Multi- Objective Parameter Route Selection for Energy E ciency Pogula Sreedevi ( sreedevipogula37@gmail.com ) Koneru Lakshmaiah Education Foundation S. Venkateswarlu Koneru Lakshmaiah Education Foundation Research Article Keywords: Cluster load, Emperor Penguin Optimization, Fuzzy optimal, Cluster head selection, WSN. Posted Date: July 12th, 2021 DOI: https://doi.org/10.21203/rs.3.rs-638723/v1 License: This work is licensed under a Creative Commons Attribution 4.0 International License. Read Full License
FOC-MOP – Fuzzy optimal clustering based Multi-Objective
        parameter route selection for energy efficiency
                          Pogula Sreedevi1 Dr. S. Venkateswarlu2
1Research   Scholar, Department of Computer Science Engineering, Koneru Lakshmaiah
             Education Foundation, Vaddeswaram, Andhra Pradesh, India.
     2Research
             Supervisor, Department of Computer Science Engineering, Koneru
      Lakshmaiah Education Foundation, Vaddeswaram, Andhra Pradesh, India.
                    1sreedevipogula37@gmail.com 2        somu23@kluniversity.in
Abstract
Recently, the research area interest towards the development of wireless sensor network (WSN)
has increased. However, WSNs have one of significant issues as improving an energy-efficient
routing protocol. A WSN has a crucial problem of energy consumption that effects the network
lifetime as sensor nodes have a limitation of power. To overcome these limitations, it’s required
to improve energy-efficient communication protocols for WSNs. Different types of techniques
have considered by various research communities for providing energy-efficient solutions for
WSNs. The energy consumption reduces using the clustering as an efficient data collection
method and the collected data forward to a cluster-head which belong to the nodes in clustered
networks. The information transmits to BS (base station) either in an uncompressed or
compressed manner after collecting all data by a cluster-head from all member nodes. Based
on other cluster-heads, the data transmit in a multi-hop network. Due to the heavy inter-cluster
relay, earlier death happens to the cluster-heads (CHs) that locates very closely to the sink.
Therefore, a fuzzy optimal CH selection algorithm has proposed to select the optimal CHs to
improve the lifetime. Based on different parameters like cluster load, communication cost,
neighbour density, node degree, inter and intra cluster distance, and node energy, the proposed
algorithm of CH selection chooses the CHs. To determine an optimal route for transmitting the
data from CH to sink, the modified Emperor Penguin Optimization (EPO) uses after selecting
the CH. The proposed technique implements and compares with other earlier methods in terms
of packet delivery ratio, lifetime, energy consumption, end to end delay and throughput. The
proposed approach shows best performance than the other methods based on the simulation
results.
Keywords: Cluster load, Emperor Penguin Optimization, Fuzzy optimal, Cluster head
selection, WSN.

                                        I.      Introduction
Wireless sensor network includes a range of sensor nodes which are distributed spatially and
interconnected without using any wires. For transmission of sensed data to other nodes and to
a designated sink point, i.e., Base Station (BS) via wireless channels, the environment sensing
performs by sensor nodes and their communication components utilize in a WSN [1]. The
transmitted data collects at BS to act as either an access point or a supervisory control processor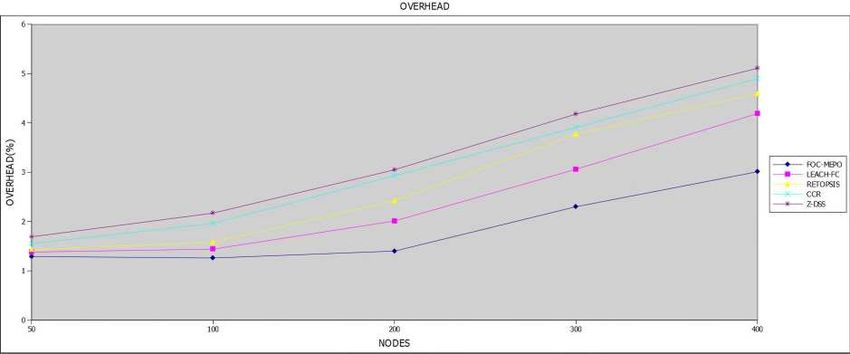
for a human interface or as a gateway for other networks. A wireless sensor network can
perform the acquisition of concurrent data in existing conditions at different interest points
located over wide areas based on the collaborative utilization of a massive number of sensor
nodes. Figure 1 represent the architecture view of WSN.

                                   Fig.1: Architecture of WSN
Because of the energy constraints of sensor nodes, their utilization limits severely in despite of
the benefits of a WSN. During the data transmission, sensing of environment, and wireless
communication, sensor nodes energy consumes in a network [2]. Various routing protocols
focus on attaining the power consumption in WSNs. Most of the routing protocols are not well
suited for wireless networks practically because they have developed for wired networks to
obtain high Quality of Service (QoS) [3]. For data routing, different protocols have proposed
for sensor networks.
Clustering has used as an energy efficient data gathering method for reducing the energy
consumption. The collected data transmit by each node to a cluster-head which the nodes
belong to in clustered networks [4]. The data transmit either in a compressed or uncompressed
way to the BS once collecting the data from all member nodes. In a multi-hop network, the
data transmit over other cluster heads. It tends to the earlier death of cluster heads closer to the
sink owing to the heavy inter-cluster relay.

                              Fig.2: Clustering Network formation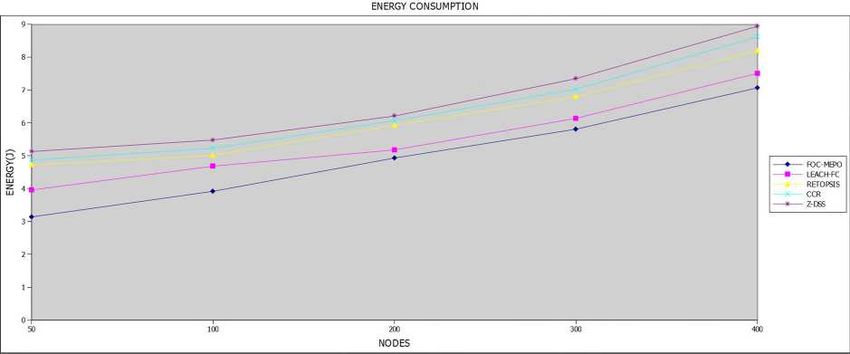
In the past, different selection mechanisms have introduced as efficient CH selection can
decrease consumption of energy. A simple process uses in most of the available approaches.
The primary step includes the selection of CHs that contain higher remaining energy. The CHs
among member nodes have rotated in the second step for energy efficiency. The nodes energy
considers in these selection methods, not the nodes density and location. In multi-hop WSNs,
the hotspots issue raises in case of not considering the deployed nodes location [5]. However,
the problem refers to the CHs earlier death if they near to the sink or due to the inter-cluster
traffic relay in crucial paths. Figure 2 shows the clustering formation as a network.
A multi-objective fuzzy clustering algorithm proposes to improve the lifetime of WSNs and
overcome the limitations of previous methods. The CHs select using the proposed CH selection
algorithm using different parameters like node degree, node energy, communication cost, inter
and intra cluster distance, neighbour density, and cluster load [6]. After choosing the CHs, the
modified Emperor Penguin Optimization (EPO) exploits for determining an optimal route to
transmit the information from CH to sink to establish the collision-free routing path.
1.1 Background algorithm overview
1.1.1 Emperor Penguin Optimizer (EPO)
The emperor penguin, called Aptenodytes forsteri scientifically. In all of the penguin species,
it is the heaviest and tallest one [7]. The female and male emperor penguins are similar in size
and plumage. During winter season, emperor penguins breed and spend their lifetime in open
ice. Emperor penguins are the species that only survive based on huddling during the Antarctic
winter. Emperor penguins huddling behaviour decomposes into four phases such as:
Produce and estimate the huddle boundary of emperor penguins.
Determining the temperature profile around the huddle.
Estimation of distance between emperor penguins.
Relocating the effective mover.
The huddling behaviour has a significant feature that each penguin gets an equal opportunity
for the huddle warmth. Mathematically, the huddling behaviour of emperor penguins models
as follows. This model has an objective of determining an effective mover [8]. Here, the huddle
assumes as situating on two-dimensional L-shape polygon plane. The huddle boundary
produces by emperor penguins randomly in the first step. Around the huddle, the temperature
profile and the distance between emperor-penguins have determined useful for more
exploration and exploitation. The huddle boundary re-computes and the best optimal solution
retrieves using the emperor penguins’ updated positions with the effective mover. Figure 3
represent the flow chart of Emperor Penguin Optimizer method.
Huddle boundary generation of emperor penguins: The positions of emperor
penguins locating via a polygon shape border in a huddling. One or two neighbour
penguins choose randomly by the emperor penguin for huddling. Based on the wind
flow around a huddle, its boundary is calculated. Compared to the wind movement, a
penguin mobility is gentler. To demonstrate the created random huddle boundary,
complex variables have used.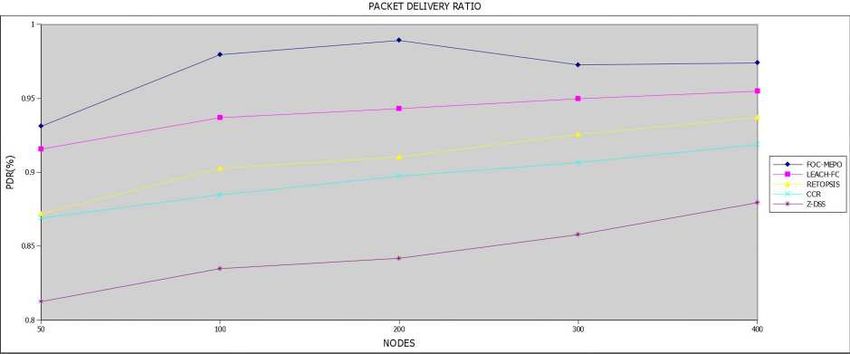
Temperature profile estimation around the huddle: The energy consumes while
creating the huddle and increases the ambient temperature.
Distance estimation among emperor penguins: Once the huddle boundary is
generated, the distance between the best optimal solution and the emperor penguin has
computed. The fitness value has concerned as the best and current optimal solution. The
locations update for other search agents or emperor penguins based on the optimal
solution.
Relocate the effective mover: Updating the emperor penguins’ positions based on the
optimal solution or mover which is responsible for other search agents’ varied locations
in a current search space.Start
Generate initial emperor penguin population
Choose the initial parameters
Calculate the fitness of each search agent
Determine the huddle boundary
Calculate the temperature profile
Calculate the distance between emperor
penguins
Update the position of each search agent if
there is a better solution than previous
optimal solution
Calculate the fitness value of updated search
agents
Generate initial emperor penguin population
Attained
No
optimal
solutions?
Yes
Return the best optimal solution
End
Fig.3: Flowchart of Emperor Penguin OptimizerContributions of this paper
This paper presents a fuzzy optimal CH selection algorithm that selects the optimal CHs based
on fuzzy based multi objective parameters. To determine an optimal route for transmitting the
data from CH to sink, the modified Emperor Penguin Optimization (EPO) is introduced. This
helps to minimize the energy consumption and to enhancing lifespan of hierarchical WSN.
Cluster creation is carried out by k-means clustering algorithm. This algorithm divides the data
set into K clusters. In the presented approach, the CH for each cluster is selected based on
multiple selection parameters such as cluster load, communication cost, neighbour density,
node degree, inter and intra cluster distance, and node energy. After the CH selection, Emperor
Penguin Optimizer (EPO) with an enhanced fitness function with link quality factor (LQF),
relative distance factor (RDF), and residual energy factor (REF) parameters is utilized to
identify an energy efficient route to transmit the data. The following are the main contributions
in this paper:
In this proposed method, the network is clustered and the CH for every cluster is
selected based on multiple parameters such as cluster load, communication cost,
neighbour density, node degree, inter and intra cluster distance, and node energy.
This multi parameter CH selection algorithm increase the CH stability and avoids CH
rotation and frequent CH re-election due to CH failure.
The Emperor Penguin Optimization (EPO) algorithm with an enhanced fitness
calculation method is introduced to evaluate the node fitness using different parameters
like link quality factor (LQF), relative distance factor (RDF), and residual energy factor
(REF).
The optimal routing path determined by the proposed method reduces the routing load
and improves the energy efficiency of the network with the help of EPO’s efficient
routing path selection strategy.
II. Literature Survey
In [9], the uniform setup phase of the CH selection has used in the centralized LEACH
(LEACH-C) for providing an improved cluster. Unlike LEACH protocol, a steady-state phase
has included in the LEACH-C. Both position and energy level data of sensor nodes transmit to
the BS in set-up phase. The clusters are also creating by the BS. Compared to the formed
clusters using the distributed algorithm, the centralized clusters are resulted better performance.
The robustness and scalability don’t provide for larger networks using centralized clusters.
However, this algorithm has some limits. The network topology is required to keep unchanged
over time, and sensor nodes are deployed uniformly. Another limit is that all the nodes are
assumed to be homogeneous and have the same energy consumption model and each node is
aware of its own position through RSSI localization. In particular, this algorithm is heuristic,
which may lead to the failure of clustering.
In [10], the proposed technique resolves the sensor nodes issue that have homogeneous features
that not suit for different practical applications. It’s require to collect non-sensitive andsensitive data that are differentiate each other. The sensor nodes with heterogeneous properties are appropriate for practical applications as all sensor nodes contain different characteristics. But this method failed to address the problem of unequal clustering and also leads to different sizes of clusters which leads to energy unbalancing among the member nodes. In [11], authors propose two different protocols: one is developed based on a centralized approach (Fuzzy-C) and a special partitioning strategy, i.e., a centralized clustering algorithm which divides the network into a fixed number of clusters. The complete knowledge about network topology has included at the sink node as presumed. The sensor nodes separate into k clusters by the sink node and all CHs are bounded. Based on the neighboring data of a node only which would more essential for WSNs, the other technique with a distributed clustering algorithm. While simulating the results, a centralized algorithm uses as a benchmark for distributed algorithm performance evaluation. The better performance may provide using the centralized algorithm based on the network topology. Since this method works with fixed number of clusters, it may not work well in the dense networks and increase the cluster size where large number of nodes are involved. In [12], the proposed scheme of RE_TOPSIS (Reliability-based Enhanced Technique for Ordering of Preference by Similarity-Ideal-Solution) has used to choose the CH efficiently and it is a distributed mechanism to introduce a Reliability Index in the F-TOPSIS. By using six different criteria for CH selection, the proposed technique of E-TOPSIS allows to take autonomous decisions by sensor nodes using obtained ranking indices. In the existing process of fuzzy based CH selection, deficiencies remove by the proposed technique. Within the transmission range spectrum, the status broadcasts to the nearby nodes with the elected CH. In a distributed algorithm, a self-directed decision can consider that has to be taken themselves as CHs by the nodes. From other CHs, multiple status updates receive by the remaining member nodes within the transmission range and link with the CH according to the maximum values of relative RSSI (Received Signal Strength Indicator) and the Euclidean distances. However, all nodes have operated with their own indices like their neighboring nodes. However, all nodes have operated with their own indices like their neighboring nodes. K. Arthi and A. Singara Rajiva Lochana (2018) [13] has developed an energy-efficient Z-DSS (zone-based dual sub sink) protocol to improve the network lifetime near the trajectory in WSNs. For balancing the nodes energy consumption near to the trajectory, the mapping between nodes and SSs (sub sinks) has scheduled in the protocol. The collision during the data transmission between clusters reduces and improves the network throughput using the hybrid adaptive time synchronization technique. The proposed method shows best performance in the increased throughput and reduced energy consumption than the existing methods. However this hybrid adaptive time synchronization method minimizes collision during data transfer between clusters, but failed to address the routing overhead between the clusters. Mohammed Farsi (2019) [14] proposes a novel protocol to limit the clustering and congestion in WSNs. Two different phases involve in the CCR (Congestion-Aware Clustering and Routing) protocol such as the setup phase and the transmission phase. Based on the features like fault tolerance, scalability, reliability, stability, load distribution, and low overhead, the characterization of CCR protocol has performed. Compared to the LEACH protocol, the
proposed method proves the best results in terms of network performance, prolonged lifetime,
and increased transmitted data packets in each round. The main drawback in this method is the
excessive consumption on energy during parameter estimation phase and there is no resource
usage control mechanism like equipping nodes with GPS for knowing the distance between the
nodes exist in this method.
S. Murugaanandam (2019) [15] has improved a new protocol known as RE-TOPSIS for
reducing the sensor nodes’ energy consumption. The performance factors of QoS such as
packet delivery ratio, delay, and throughput have measured and chosen the best CH using the
proposed technique. Based on the simulation studies, the proposed scheme provides the results
in terms of improved network lifespan, reduced energy consumption, and decreased frequency
by about 20 to 25% in CH selection per round than the LEACH and Fuzzy-TOPSIS methods.
But this method failed to address the overhead occurs during data transmission especially in
large networks and in dense clusters.
Sonam Lata (2020) [16] has proposed a new centralized fuzzy based clustering algorithm based
on three parameters like centrality, concentration, and energy level. Fuzzy logic technique
elects a vice cluster head. The proposed algorithm is outperformed in improved reliability and
reduced energy consumption by analyzing the simulation results. The limitations found in this
method is the absence of effective data aggregation in the clustered environment particularly
in dense clusters. The routing overhead may get increased in dense clusters which affects the
overall energy efficiency.

   III.    Proposed optimal CH selection & finding optimal routing using FOC-MOP
           method
Providing of an efficient and stable cluster heads is the major objective of the proposed method
and an optimal routing scheme prolongs the network lifetime and decreases energy
consumption. Two different phases involve in the proposed approach such as cluster head
selection and cluster formation and route establishment. Based on the clustering mechanism,
the clusters are formed. After that, fuzzy based multi-objective selection method is used for
optimal CH selection. By using the parameters like inter & intra cluster distance, node energy,
communication cost, neighbour density, node degree, and cluster load, the proposed algorithm
of CH selection chooses the CHs. For optimal path selection, Emperor Penguin Optimizer
method employs after selecting the CH. Thus, the energy consumption of sensor nodes reduce.
Figure 4 shows the architecture view of proposed framework.
Clustering
WSN
FOC-MOP EPO
Multi-objective Finding optimal Data aggregation
CH selection path
Fig.4: Architecture diagram of proposed system
Radio energy model
Energy model is described as an estimating energy depleted during the transmission, reception
and data collection. The energy model used in our approach considers that 1 bit of data
transmitted from the sender X to neighbour Y with the distance Dis(x, y) with consumed energy
E(x, y) shown in the following equation. The energy consumption is categorized as follows.
The first part denotes the energy consumed Ex on node X for initiating the outgoing data
transmission. The second part denotes the energy spent Es for transmitting the data from X to
Y. The third part indicates the energy consumed Ec by the node Y to receive the data
transmitted from node X to node Y. This whole process can be explained in the following
equation 1
( , )= + + ( , ) Eq (1)
Here, the & represent the constant value with the base of wireless devices type and
application environment.
Cluster formation phase
The cluster formation is playing a key role in the energy consumption and it creates the cluster
using k-means clustering algorithm. K-Means is considered to be the simplest unsupervised
clustering algorithm used for clustering. This algorithm divides the data set into K clusters and
value of K in this case is calculated using the below mentioned equation 2. The resulting
clusters have more intra-cluster and less inter-cluster similarity. This algorithm consists of
several iterations and steps:
∊
= Eq (2)
∊
where D refers to the network field dimension, n indicates the number of sensor nodes, and xbx
denotes the average distance of all sensor nodes to the BS.
After estimating the k value, compute the distance between the each sensor nodes to the cluster
centers. The Euclidean distance formula is used to estimate the distance and each point assigned
to the closest center of the cluster. Then determine the new center for the cluster using themean value of all sensor nodes in their respective clusters. The Euclidean formula is described
as follows in equation 3:
= ∑ ( − ) Eq (3)
Here, is the distance between nodes & center of the cluster, represents the coordinate
of the node n, is the coordinate of the cluster centers.
CH selection phase
The proposed CH selection algorithm proposes a multi-parameter cluster head selection
algorithm. The proposed CH selection algorithm selects the CHs based on Node energy, Inter
& Intra cluster distance, Node degree, Neighbour density, Communication cost & Cluster load
parameters. The description of the parameters are discussed below:
Node energy:
For CH selection, the sensor node with great residual energy uses as the CH node responsible
for significant methods such as data aggregation and collection. To carry out different tasks,
more energy is required. It describes using every SN balance energy using below equation 4:
= ∑ Eq (4)
where, ENCHi represents CH remaining energy and n refers to the number of CHs.
Intra-cluster distance: The distance between CH and its members is the intra-cluster distance
which can improve the link quality among CMs and CH and offer better cluster quality. By
using below expression 5, the intra-cluster distance can determine:
= ( − ) + ( − ) Eq (5)
where, x and y represent the nodes ‘n’ coordinates on the search field D.
Node degree: The reachable cluster member (CM) nodes represent the CH degree which
balances the load of CH. A CH node degree indicates using the following formulation 6:
= ∑ Eq (6)
where, CMi represents the ith member of CH.
Neighbour density: The detection of number of available neighbouring nodes is one of the
major challenging problems for a SN. Node with highest possibility elects as CH and estimates
the number of neighbors based on below equation 7:
| |
( )= Eq (7)
where, ni indicates the node’s adjacent nodes and n0 refers to the optimal number of neighbors,
ND indicates node density.Communication cost: To increase the high data delivery reliability, the communication cost
must be considered. It helps to find out the feasible path for the communication that can sustain
for the entire communication. Burst traffic may occur often in WSNs due to their periodic
broadcasting nature. So, selecting the strong forwarders is important to control the data loss
during transmission. The communication cost can be calculated in two ways.
Intra-cluster communication cost
Inter-cluster communication cost.
The inter-cluster communication cost defines as the sum of links’ costs between the CHs and
the total links’ cost between all cluster members and their CHs is described in the intra-cluster
communication cost. By using below equation 8, the communication cost can estimate.
= Eq (8)
where, Br indicates the node broadcasting radius, and davg refers to the average distance
between a node and its neighbour node.
Cluster load: For load balancing between CHs, the cluster load parameter uses. The reduction
of maximum load between various CHs is considered and can express as follows in equation
9:
(| |)
= ; ∀ = 1,2, … Eq (9)
∑ (| |)
By using the below formula 10, a weight determines using above parameters:
= + + + + + Eq (10)
where, C1, C2, C3, C4, C5, and C6 are weight factors, and C1+C2+C3+C4+C5+C6 = 1. The
node that has smaller value of weight will choose as the cluster head.
Fuzzy model
Fuzzy Logic method uses for choosing the best candidate to process the CH in the proposed
work. For decision making behavior of human being, fuzzy logic approach operates as an
efficient one. In the proposed work, the fuzzy system basic structure shows below in figure 5:
Fig.5: Basic structure of fuzzy systemFuzzifier: In Fuzzy based applications, the system inputs are crisp set which need to be transformed into fuzzy sets. Each fuzzy set is assigned a degree of membership. Thus, conversion of crisp set into suitable linguistic value is done with fuzzifier. Fuzzy Rule Base: It consists of IF-THEN rules decided by the user. Rule base with if-then defines the dynamic behavior of the fuzzy system. The fuzzy rule base is also referred to as knowledge base. Inference Engine: Fuzzy inference engine with inputs and IF-THEN rules tries to simulate the inference system of human being. Fuzzy Inference Engine plays a vital role in inferring and drawing conclusion from the conditions in rule base. Defuzzification: Defuzzification process carry out the mapping of the fuzzy set acquired from the inference engine into a crisp output value which can be used for drawing some conclusion. Fuzzification We used five multi objective variables as input for FL. Node energy, Inter & Intra cluster distance, Node degree, Neighbour density, Communication cost & Cluster load are the multi objective selection parameters. The fuzzifier crisp input variable with their maximum and minimum values for calculating CH eligibility are shown below. Input Variables Node energy low medium high Distance low medium high Neighbor density sparse medium dense Communication cost low medium high Cluster load low medium high Fuzzy rule base Membership values obtained after fuzzification are fed to the rule base for IF-THEN conditions. Using the Fuzzy AND and OR operators on the inputs, a value is obtained. Aggregation method union all the output and a maximum value is chosen from the aggregated fuzzy set. To obtain the eligibility index by the Fuzzy Logic, the following fuzzy rules are used. Rule Energy Distance Density Cost Load Eligibility 1 Low Low Dense Low High Good 2 Medium Low Dense Medium High Better 3 High Low Dense High High Better 4 Low Low Sparse Low High Good 5 Medium Medium Medium Medium Low Better 6 High Low Medium High High Good 7 Low Low Medium Low High Good 8 Medium Low Medium Medium High Better 9 High Low Sparse High High Better
10            Low           Medium        Dense                           Low               Medium   Good
 11            Medium        Low           Sparse                          Medium            High     Better
 12            High          Medium        Dense                           High              Low      Far better
 13            Low           Medium        Sparse                          Low               Low      Better
 14            Medium        Medium        Dense                           Medium            Low      Far better
 15            High          Medium        Medium                          High              Low      Far better
 16            Low           Medium        Medium                          Low               Low      Good
 17            Medium        Medium        Sparse                          Medium            Low      Far better
 18            High          Medium        Sparse                          High              Low      Far better
 19            Low           High          Dense                           Low               Medium   Good
 20            Medium        High          Dense                           Medium            Medium   Far better
 21            High          High          Dense                           High              Medium   Far better
 22            Low           High          Medium                          Low               Low      Good
 23            Medium        High          Medium                          Medium            Low      Better
 24            High          High          Medium                          High              Low      Far better
 25            Low           High          Sparse                          Low               Medium   Good
 26            Medium        High          Sparse                          Medium            Low      Far better
 27            High          High          Sparse                          High              High     Far better

All the nodes are compared on the basis of eligibility and the node with the maximum chance
is then elected as the cluster-head. Each node in the cluster associates itself to the cluster-head
and starts transmitting data.

Optimal path finding with EPO

From current CH to sink, the optimal path determines using the Emperor Penguin Optimizer
(EPO) to improve the multi-hop routing efficiency and reduce the cost of long-distance
transmission, and to decrease the energy utilization while data transmission on routing path.
For transmitting data, an adjacent CH will elect as relay node when longer communication
distance exists among the corresponding CH and Sink. Compared to the direct transmission
between corresponding sensor node and sink, more energy saves. Different parameters like link
quality factor (LQF), relative distance factor (RDF), and residual energy factor (REF) have
considered to transmit the data with reduced energy and balance the load. They can estimate
using below equations 11-13:
                                               (       )           (           )
                                  =                                                Eq (11)
                                                           (   )

                                           ,                               ,
                              =                                                       Eq (12)
                                                   ,                   (       , )

                                       =                                   Eq (13)

Whenever source node CHi distant away from sink, it’s vital to choose the relay sensor node
CHj. The relay node with lower cost of link chooses to transmit the information to sink. The
fitness function computes using below equation 14:
= ∑ ∗ , where ∑ = 1 Eq (14)
Where, fpi refers to the particle i fitness parameters.
The routing method with EPO characterizes into four different steps such as:
CH neighbours random generation
Energy determination among produced CH neighbours
Compute the distance among CH neighbours
Relocate the best mover
Random generation of CH neighbours: The CH determines two adjacent CHs from the
transmission range randomly in the step. Based on the network field gradient (link speed or
transmission), the adjacent neighbouring CHs have chosen.
Energy estimation among generated CH neighbours: Due to the CHs selection with high
speed within the range, more energy can save on sensor nodes under the process of CH
neighbour generation. The energy profile performs completely in the EPO’s exploration and
exploitation process. The remaining energy on CHs detects while estimating the energy profile.
Estimating distance among the CH neighbours: By computing the distance among CHs, the
best optimal solution will estimate.
Relocating the mover: For transmitting the information to the retrieved best solution agent,
the CH uses in the mover. The best adjacent CH position will update and perform using below
equation 15:
( + 1) = ( ) Eq (15)
The updated position indicates as UPCH(x+1). The above equation shows the updating of next
position of CH for transmitting the data. The similar process continues until retrieving the path
to reach the SINK.
Algorithm
For all node n
Clustering
Select CH for each cluster
Calculate weight (n)
If (weight = low)
Select ‘n’ as cluster head
End if
End for
Initialize the parameters
For all nodes n
Fitness (n)
Estimate energy profile
For all nodes n
Estimate the best agent
Update the best optimal CH selection
End forEnd for
Evaluate the fitness of the CHs
For each CH
Estimate REF, RDF, LQF
If (REF & RDF & LQF = high)
Select the CH for data forwarding
Else
Reject the CH for data forwarding
End if
End for
Update the best path
End
IV. Result and discussion
Simulation setup
The proposed method evaluation and comparison with the existing techniques have described
using the following scenario. In a 1000x500m network area, the random deployment and sparse
feature of sensor nodes is considered. The node position is static. The network size is varied
from 50 to 400. The initial energy of the sensor nodes is 100joules. CBR traffic is enable for
communication and the sensor nodes are able to send the data packet at the constant bit rate
level. The data packet size is 1024bytes. The network was simulated for up to 100ms. Table 1
shows the simulation parameters. The cluster parameters represented in table 2.
Table1: Simulation parameters
PARAMETER VALUE
Application traffic CBR
Transmission rate 1024 bytes/ 0.5ms
Radio range 250m
Packet length 8192 bits
Routing Protocol AODV
Simulation time 100ms
Number of nodes 50, 100, 200, 300, 400
Area 1000 x500 m2
Transmission Protocol UDP
Initial Energy 100j
Table2: Cluster parameters
PARAMETER VALUE
Clustering algorithm k-means
Cluster type Unequal
Number of clusters 4 to 8Node deployment Random waypoint
The execution was carried out multiple times under different network sizes. The results were
compared with some of the existing methods like Z-DSS, CCR, RETOPSIS & LEACH-FC.
The parameters of energy consumption, packet delivery ratio, network throughput, routing
overhead, and end-to-end delay have evaluated to verify the network performance. The
evaluation results are described below:
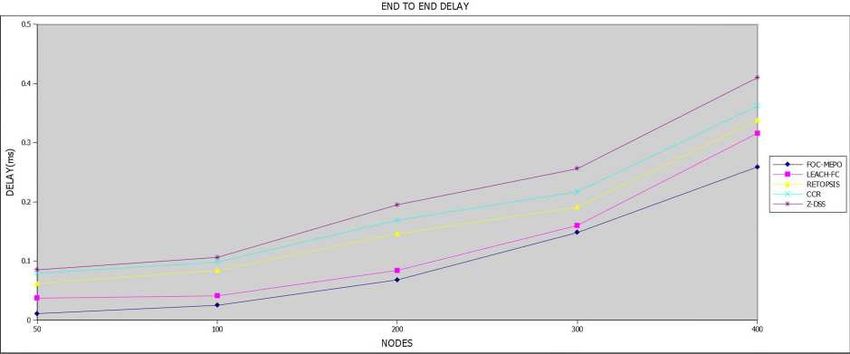
Fig.6: End to End Delay
The above result figure 6 shows the experimental outcome of the execution of the both existing
and the proposed methods under 50 to 400 varying network sizes. End to end delay is described
as the difference of estimated time and the total time taken by a data packet to reach the
destination. Congestion affects the end to end delay of the data packets. In the proposed
method, the congestion is effectively handled by the fuzzy congestion control algorithm. Hence
the delay in the proposed method is comparatively less than the previous methods. The
simulation results are listed in the table 3 below:
Table3: Comparison Analysis of proposed with existing methods for Delay
NODES FOC-MOP LEACH-FC RETOPSIS CCR Z-DSS
50 0.011 0.037 0.062 0.079 0.085
100 0.025 0.041 0.084 0.098 0.106
200 0.068 0.084 0.146 0.168 0.195
300 0.148 0.160 0.191 0.217 0.256
400 0.259 0.316 0.338 0.362 0.410Fig.7: Energy Consumption Energy is the vital parameter for the sensor network. Every node in the network is equipped with initial energy. In our simulation the initial energy was 100joules. The sensor nodes consumes energy to perform network activities. The energy consumption should be optimized for improved network lifetime. The selection of energy efficient routing path by the proposed EPO algorithm optimizes the energy consumption and network lifetime. The existing methods were not considered the energy efficient path hence the energy consumption comparatively higher than the proposed method. The average energy consumption rate of the proposed method was 6.5j where as it was as high as 8.5j in the previous methods. Figure 7 represent the graphical view of energy consumption. The simulation results are listed below table 4: Table4: Comparison Analysis of proposed with existing methods for Energy consumption NODES FOC-MOP LEACH-FC RETOPSIS CCR Z-DSS 50 3.14 3.96 4.72 4.87 5.13 100 3.92 4.68 5.01 5.23 5.48 200 4.93 5.18 5.93 6.071 6.210 300 5.8 6.14 6.8 7.027 7.348 400 7.067 7.510 8.20 8.619 8.943
Fig.8: Overhead
The parameter overhead is related to the amount of overhead incurred to the network often due
to the implemented method / algorithm. It is related to the amount of additional control packets,
resources the algorithm / method requires to complete the given task. Also, the frequent
disturbances in the routing path often increase the overhead. In the proposed method it was
controlled by the EPO algorithm with the effective selection of energy efficient paths. Also,
the effective clustering of the network improves data aggregation. Thus, the overhead was
under controlled level in the proposed method where the existing methods failed in this. Figure
8 shows the graphical representation of Overhead. The recorded overhead values are listed
below table 5:
Table5: Comparison Analysis of proposed with existing methods for Overhead

 NODES           FOC-MOP         LEACH-FC        RETOPSIS        CCR             Z-DSS
 50              1.29            1.38            1.43            1.55            1.69
 100             1.26            1.44            1.58            1.96            2.17
 200             1.40            2.01            2.42            2.93            3.05
 300             2.30            3.06            3.77            3.91            4.18
 400              3.01           4.19            4.59            4.90            5.11
Fig.9: Packet Delivery ratio
PDR can define as the ratio between total number of delivered packets and the total number of
sent packets from source to destination node. The path failure, congestion are the prominent
factors that affects the PDR rate. The effective data aggregation through cluster heads and the
energy efficient path selection of the EPO algorithm ensures the smooth delivery of the data
packets to their own destination. The existing methods provided the solution for congestion
controlling and did not consider about the effective routing. So the PDR of the existing methods
was as low as 0.85 whereas the PDR was as high as 0.97 in the proposed method. Figure 9
shows the packet delivery ratio. The experimental results are listed below table 6:
Table6: Comparison Analysis of proposed with existing methods for PDR

 NODES           FOC-MOP         LEACH-FC        RETOPSIS        CCR             Z-DSS
 50              0.9310          0.9156          0.8719          0.8690          0.8125
 100             0.9795          0.9369          0.9026          0.8847          0.8348
 200             0.9991          0.9430          0.9103          0.8973          0.8418
 300             0.9726          0.9497          0.9256          0.9065          0.8578
 400             0.9739          0.9548          0.9370          0.9186          0.8794
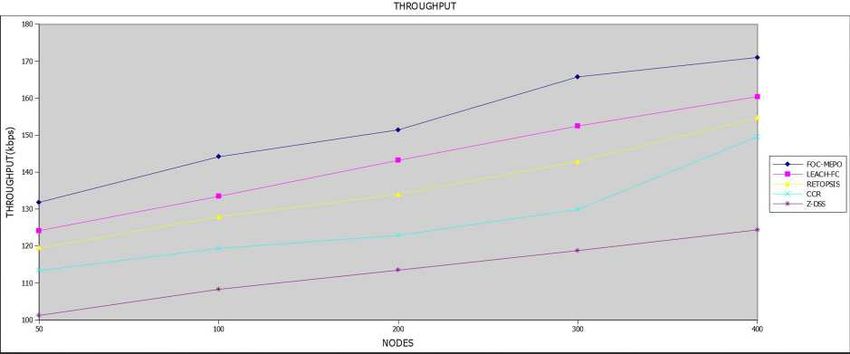
Fig.10: Throughput
Throughput refers to how much data can be transferred from one sensor to another in a given
amount of time. Throughput defines the successful transmission rate of the network. The
occurrence of congestion in the routing path is major factor affects the network throughput.
The efficient path selection strategy of EPO and data aggregation used in the proposed
algorithm keeps the throughput high in the proposed method. The highest throughput rate
recorded in our execution was 171kbps in the proposed method whereas throughput in existing
methods was as low as 124kbps. Figure 10 represent the throughput. The complete
experimental results are listed below table 7:
Table7: Comparison Analysis of proposed with existing methods for Throughput

 NODES          FOC-MOP         LEACH-FC       RETOPSIS        CCR            Z-DSS
 50             131.81          124.14         119.43          113.34         101.22
 100            144.13          133.42         127.93          119.34         108.28
 200            151.42          143.17         133.98          122.88         113.46
 300            165.75          152.46         142.88          129.88         118.76
 400            171.01          160.42         154.68          149.59         124.36

Conclusion
This work has introduced a Fuzzy optimal clustering combined with modified Emperor
Penguin Optimization algorithm-based route selection for energy efficiency in WSNs. The
paper proposed the FOC-MOP algorithm based on the emperor penguin optimzer. The
proposed work has utilized the multi-objective cluster head selection technique for efficient
CH selection in the clustered environment. The proposed CH selection algorithm selects the
CHs using the inter and intra cluster distance, node energy, node degree, neighbour density,
communication cost & cluster load parameters. The modified EPO algorithm identifies an
optimal route for data transmission f1rom CH to sink. The modified EPO utilizes residual
energy factor, relative distance factor & link quality factors to identify the best nodes for
routing purpose. Based on the nodes and varied population size in WSNs, the proposed model
has simulated. Compared to the earlier energy optimization protocols, the proposed FOC-MOP
algorithm provides best results in achieving energy efficiency and increased network lifetime
through the simulation outputs.

Declarations:
Funding: Not applicable

Conflicts of interest:
Author name: POGULA SREEDEVI
Title: FOC-MOP – Fuzzy optimal clustering based Multi-Objective parameter route selection
for energy efficiency
No financial support from private or government institutions
Under supervisor
Dr S Venkateswarlu
Professor in Koneru Lakshmaiah Educational Institution

Availability of data and material:
Not applicable

Code availability:
Available

Authors' contributions:
Not applicable

References
  [1].      Abdollahzadeh, Sanay, and Nima Jafari Navimipour. "Deployment strategies in the wireless
            sensor network: A comprehensive review." Computer Communications 91 (2016): 1-16.
  [2].      Contreras, William, and Sotirios Ziavras. "Wireless sensor network-based infrastructure
            damage detection constrained by energy consumption." In 2016 IEEE 7th Annual
            Ubiquitous Computing, Electronics & Mobile Communication Conference (UEMCON), pp.
            1-7. IEEE, 2016.
  [3].      Fu, Shu, Hong Wen, Jinsong Wu, and Bin Wu. "Cross-networks energy efficiency tradeoff:
            From wired networks to wireless networks." IEEE Access 5 (2016): 15-26.
  [4].      Rao, PC Srinivasa, Prasanta K. Jana, and Haider Banka. "A particle swarm optimization
            based energy efficient cluster head selection algorithm for wireless sensor
            networks." Wireless networks 23, no. 7 (2017): 2005-2020.
  [5].      Biswas, Swagata, Ria Das, and Punyasha Chatterjee. "Energy-efficient connected target
            coverage in multi-hop wireless sensor networks." In Industry interactive innovations in
            science, engineering and technology, pp. 411-421. Springer, Singapore, 2018.
  [6].      Mallik, Saurav, and Zhongming Zhao. "Multi-objective optimized fuzzy clustering for
            detecting cell clusters from single-cell expression profiles." Genes 10, no. 8 (2019): 611.
  [7].      Preeth, SK Sathya Lakshmi, R. Dhanalakshmi, and P. Mohamed Shakeel. "An intelligent
            approach for energy efficient trajectory design for mobile sink based IoT supported wireless
            sensor networks." Peer-to-Peer Networking and Applications 13, no. 6 (2020): 2011-2022.
  [8].      Shrivastava, Prerana. "EPO: An Optimization technique for Urban Traffic Management
            While Limiting the Pollution using WSN." International Journal of Communication
            Systems 33, no. 5 (2020): e4246.
  [9].      Q. Wang, S. Guo, J. Hu, and Y. Yang, ``Spectral partitioning and fuzzy C- means based
            clustering algorithm for big data wireless sensor networks,'' EURASIP J. Wireless Commun.
            Netw., vol. 2018, no. 1, p. 54, Dec. 2018.
  [10].      H. El Alami and A. Najid, ``Fuzzy logic based clustering algorithm for wireless sensor
            networks,'' Int. J. Fuzzy Syst. Appl., vol. 6, no. 4, pp. 63_82, Oct. 2017, doi:
            10.4018/ijfsa.2017100105.
[11]. Q. Wang, S. Guo, J. Hu, Y. Yang, and Wang, ``Spectral partitioning and fuzzy C-means
based clustering algorithm for big data wireless sensor networks,'' EURASIP J. Wireless
Commun. Netw., vol. 2018, pp. 54_64, Mar. 2018, doi: 10.1186/s13638-018-1067-8.
[12]. S. Murugaanandam and V. Ganapathy, ``Energy efficient Clustering method in WSN for
automated intelligent bio-fertigation monitor and control,'' Int. J. Control Theory Appl., vol.
9, no. 12, pp. 5753_5760, 2016.
[13]. Arthi, K., and A. Singara Rajiva Lochana. "Zone-based dual sub sink for network lifetime
maximization in wireless sensor network." Cluster Computing 22, no. 6 (2019): 15273-
15283.
[14]. Farsi, Mohammed, Mahmoud Badawy, Mona Moustafa, Hesham Arafat Ali, and Yousry
Abdulazeem. "A congestion-aware clustering and routing (CCR) protocol for mitigating
congestion in WSN." IEEE Access 7 (2019): 105402-105419.
[15]. Murugaanandam, S., and Velappa Ganapathy. "Reliability-based cluster head selection
methodology using fuzzy logic for performance improvement in WSNs." IEEE Access 7
(2019): 87357-87368.
[16]. Lata, Sonam, Shabana Mehfuz, Shabana Urooj, and Fadwa Alrowais. "Fuzzy clustering
algorithm for enhancing reliability and network lifetime of wireless sensor networks." IEEE
Access 8 (2020): 66013-66024.You can also read