Game Analytics Pipeline - Implementation Guide - AWS ...
←
→
Page content transcription
If your browser does not render page correctly, please read the page content below
Game Analytics Pipeline
   Implementation Guide
Game Analytics Pipeline Implementation Guide

Game Analytics Pipeline: Implementation Guide
Copyright © Amazon Web Services, Inc. and/or its affiliates. All rights reserved.

Amazon's trademarks and trade dress may not be used in connection with any product or service that is not
Amazon's, in any manner that is likely to cause confusion among customers, or in any manner that disparages or
discredits Amazon. All other trademarks not owned by Amazon are the property of their respective owners, who may
or may not be affiliated with, connected to, or sponsored by Amazon.
Game Analytics Pipeline Implementation Guide

Table of Contents
  Welcome ........................................................................................................................................... 1
  Overview ........................................................................................................................................... 2
       Cost .......................................................................................................................................... 2
       Architecture ............................................................................................................................... 3
  Components ...................................................................................................................................... 5
       Amazon Kinesis .......................................................................................................................... 5
       Amazon API Gateway ................................................................................................................. 5
       AWS Lambda functions ............................................................................................................... 5
       Amazon Simple Storage Service ................................................................................................... 6
       AWS Glue .................................................................................................................................. 6
       Amazon DynamoDB .................................................................................................................... 6
       Amazon CloudWatch .................................................................................................................. 6
       Amazon Simple Notification Service ............................................................................................. 7
       Amazon Athena ......................................................................................................................... 7
  Considerations ................................................................................................................................... 8
       Choose the appropriate streaming data ingestion method ............................................................... 8
       Integration with game clients ...................................................................................................... 8
       Integration with game backends .................................................................................................. 8
       Integration with AWS SDK ........................................................................................................... 9
       Integration with Amazon QuickSight ............................................................................................ 9
       Regional deployment .................................................................................................................. 9
  Template ......................................................................................................................................... 10
  Deployment ..................................................................................................................................... 11
       Prerequisites ............................................................................................................................ 11
       Deployment overview ............................................................................................................... 11
       Step 1. Launch the stack ........................................................................................................... 12
       Step 2. Generate sample game events ........................................................................................ 14
       Step 3. Test the sample queries in Amazon Athena ....................................................................... 14
       Step 4. Connect Amazon Athena to Amazon QuickSight ................................................................ 15
       Step 5. Build the Amazon QuickSight dashboard .......................................................................... 16
               Count of events filtered by event_type ............................................................................... 16
               Tutorial progression by application version .......................................................................... 17
               Level completion rate by application version ....................................................................... 18
               Level completion distribution over time .............................................................................. 20
               Events trend KPI .............................................................................................................. 21
               Level completion rate trend KPI ......................................................................................... 22
               Level completion gauge .................................................................................................... 23
               Dark theme ..................................................................................................................... 24
               Title ................................................................................................................................ 24
               Parameters and controls ................................................................................................... 24
       Step 6. View and add real-time metrics to the pipeline operational health dashboard ........................ 26
               Add custom metrics to the Amazon CloudWatch operational dashboard .................................. 26
  Security ........................................................................................................................................... 28
       Authentication ......................................................................................................................... 28
               (Optional) Enable IAM authentication on events endpoint ...................................................... 28
       Encryption-at-rest .................................................................................................................... 28
  Resources ........................................................................................................................................ 29
  Appendix A: Monitoring the solution ................................................................................................... 30
       Game Analytics Pipeline operational dealth dashboard .................................................................. 30
       Alarms and notifications ........................................................................................................... 30
  Appendix B: Uninstall the solution ...................................................................................................... 32
       Using the AWS Management Console ......................................................................................... 32
       Using AWS CLI ......................................................................................................................... 32
       Deleting the Amazon S3 Buckets ................................................................................................ 32

                                                                         iii
Game Analytics Pipeline Implementation Guide
Deleting the Amazon QuickSight Analysis and Data Sets ............................................................... 32
Appendix C: Operational metrics ........................................................................................................ 34
Source code ..................................................................................................................................... 35
Revisions ......................................................................................................................................... 36
Contributors .................................................................................................................................... 37
Notices ............................................................................................................................................ 38
ivGame Analytics Pipeline Implementation Guide
Launch a scalable serverless data
pipeline to ingest, store, and analyze
telemetry data generated from
games and services
Publication date: May 2020 (last update (p. 36): August 2021)
This implementation guide discusses architectural considerations and configuration steps for deploying
the Game Analytics Pipeline solution in the Amazon Web Services (AWS) Cloud. It includes a link to an
AWS CloudFormation template that launches and configures the AWS services required to deploy this
solution using AWS best practices for security and availability.
The guide is intended for game developers, IT infrastructure architects, administrators, and DevOps
professionals who have practical experience architecting in the AWS Cloud.
1Game Analytics Pipeline Implementation Guide
Cost
Overview
The games industry is increasing adoption of the Games-as-a-Service operating model, where games
have become more like a service than a product, and recurring revenue is frequently generated through
in-app purchases, subscriptions, and other techniques. With this change, it is critical to develop a deeper
understanding of how players use the features of games and related services. This understanding allows
you to continually adapt and make the necessary changes to keep players engaged.
Player usage patterns can vary widely and a game’s success in the marketplace can be unpredictable.
This can make it challenging to build and maintain solutions that scale with your player population
while remaining cost effective and easy to manage. Turnkey user engagement and analytics solutions,
such as Amazon Pinpoint or third-party options, provide an easy way to begin capturing analytics from
your games. However, many game developers and game publishers want to centralize data from across
applications into common formats for integration with their data lakes and analytics applications.
Amazon Web Services (AWS) offers a comprehensive suite of analytics solutions that can help you ingest,
store, and analyze data from your game without managing any infrastructure.
The Game Analytics Pipeline solution helps game developers launch a scalable serverless data pipeline
to ingest, store, and analyze telemetry data generated from games and services. The solution supports
streaming ingestion of data, allowing users to gain insights from their games and other applications
within minutes. The solution provides a REST API and Amazon Kinesis services for ingesting and
processing game telemetry. It automatically validates, transforms, and delivers data to Amazon Simple
Storage Service (Amazon S3) in a format optimized for cost-effective storage and analytics. The solution
provides data lake integration by organizing and structuring data in Amazon S3 and configuring AWS
Glue to catalog metadata for datasets, which makes it easy to integrate and share data with other
applications and users.
The solution provides fully-managed streaming data analytics that allow game developers to generate
custom metrics from game events in real-time when insights and Key Performance Indicators (KPIs)
are needed immediately. The results of streaming data analytics can be used by Live Ops teams to
power real-time dashboards and alerts for a view into live games, or by engineering teams who can use
streaming analytics to build event-driven applications and workflows.
The solution is designed to provide a framework for ingesting game events into your data lake for
analytics and storage, allowing you to focus on expanding the solution functionality rather than
managing the underlying infrastructure operations.
Cost
You are responsible for the cost of the AWS services used while running this reference deployment. At
the date of publication, the cost of running this solution depends on the amount of data being loaded,
stored, processed, and analyzed in the solution. Deploying the solution in developer mode (Dev) mode
and sending events to the pipeline with the included demo script will cost approximately $10.00 per day.
If you customize this solution to analyze your game dataset, the cost factors include the amount of
streaming data that is ingested, size of the data being analyzed, compute resources required for each
step of the workflow, and duration of the workflow. For a more accurate estimate of cost, we recommend
running a sample dataset as a benchmark.
Prices are subject to change. For full details, refer to the pricing webpage for each AWS service used in
this solution.
2Game Analytics Pipeline Implementation Guide
Architecture
Architecture overview
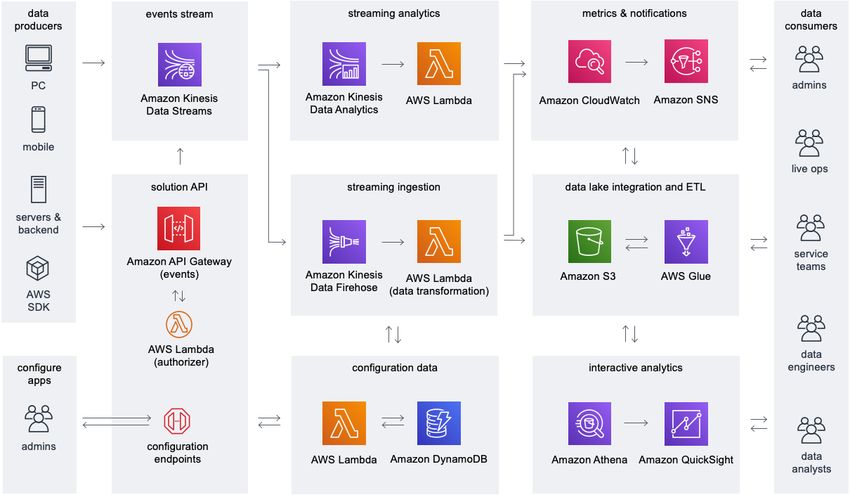
Deploying this solution with the default parameters builds the following environment in the AWS Cloud.
Figure 1: Game Analytics Pipeline architecture
The AWS CloudFormation template deploys AWS resources to ingest game data from game clients, game
servers, and other applications. The streaming data is ingested into Amazon S3 for data lake integration
and interactive analytics. Streaming analytics processes real-time events and generates metrics. Data
consumers analyze metrics data in Amazon CloudWatch and raw events in Amazon S3. Specifically, the
template deploys the following essential building blocks for this solution.
• Solution API and configuration data—Amazon API Gateway provides REST API endpoints for
registering game applications with the solution, and for ingesting game telemetry data, which
sends the events to Amazon Kinesis Data Streams. Amazon DynamoDB stores game application
configurations and API keys to use when sending events to the solution API.
• Events stream—Kinesis Data Streams captures streaming data from your game and enables real-time
data processing by Amazon Kinesis Data Firehose and Amazon Kinesis Data Analytics.
• Streaming analytics—Kinesis Data Analytics analyzes streaming event data from the Kinesis Data
Streams and generates custom metrics. The custom metrics outputs are processed using AWS Lambda
and published to Amazon CloudWatch.
• Metrics and notifications—Amazon CloudWatch monitors, logs, and generates alarms for the
utilization of AWS resources, and creates an operational dashboard. CloudWatch also provides metrics
storage for custom metrics generated by Kinesis Data Analytics. Amazon Simple Notification Service
(Amazon SNS) provides notification delivery to solution administrators and other data consumers
when CloudWatch alarms are breached.
• Streaming ingestion—Kinesis Data Firehose consumes data from Kinesis Data Streams and invokes
AWS Lambda with batches of events for serverless data processing and transformation before the data
is delivered to Amazon S3.
• Data lake integration and ETL—Amazon S3 provides storage for raw and processed data. AWS
Glue provides ETL processing workflows and metadata storage in the AWS Glue Data Catalog, which
provides the basis for a data lake for integration with flexible analytics tools.
• Interactive analytics—Sample Amazon Athena queries are deployed to provide analysis of game
events. Instructions for integrating with Amazon QuickSight are provided in the Automated
Deployment (p. 11) section.
3Game Analytics Pipeline Implementation Guide
Architecture
The demo script generates example game events that represent a variety of common types of player
actions in a game. These events are batched and automatically sent to Kinesis Data Streams for testing
the solution functionality. In total, this solution enables the ingestion, analysis, monitoring, and
reporting of game analytics data—setting up the infrastructure to support a serverless data pipeline.
4Game Analytics Pipeline Implementation Guide
Amazon Kinesis
Solution components
Amazon Kinesis
The Game Analytics Pipeline solution uses Amazon Kinesis to ingest and process telemetry data from
games. Amazon Kinesis Data Streams ingests the incoming data, Amazon Kinesis Data Firehose consumes
and delivers streaming data to Amazon Simple Storage Service (Amazon S3), and Amazon Kinesis Data
Analytics for SQL Applications generates real-time metrics using streaming SQL queries. The Kinesis Data
Streams uses AWS Key Management Service (AWS KMS) for encryption-at-rest.
Amazon API Gateway
The solution launches a REST API that provides an events endpoint for sending telemetry data to the
pipeline. This provides an integration option for applications that cannot integrate with Amazon Kinesis
directly. The API also provides configuration endpoints for admins to use for registering their game
applications with the solution and generating API keys for developers to use when sending events to the
REST API.
AWS Lambda functions
The solution uses AWS Lambda functions to provide data processing and application backend business
logic. The following Lambda functions are deployed:
• ApplicationAdminServiceFunction Lambda function—A function that provides backend business
logic for the solution’s REST API configuration endpoints. This function stores newly created game
application configurations in Amazon DynamoDB and generates API key authorizations for developers
to integrate with the REST API events endpoint.
• LambdaAuthorizer Lambda function—A function that provides request authorization for events sent
to the solution’s REST API events endpoint. The function can be customized to integrate with your
game’s existing authentication system, as well as with Amazon Cognito and external identity providers.
• EventsProcessingFunction Lambda function—A function that validates, transforms, and processes
input game events from Kinesis Data Firehose before events are loaded into Amazon S3. This function
invokes with a batch of input event records and performs validation and processing before returning
transformed records back to Kinesis Data Firehose for delivery to storage in Amazon S3. The function
can be modified to add additional data processing as needed.
• AnalyticsProcessingFunction Lambda function—A function that processes custom metrics outputs
from the Kinesis Data Analytics application. The function processes a batch of SQL results from the
Kinesis Data Analytics application and publishes them to Amazon CloudWatch as custom metrics. The
function can be customized to accept different output formats, or perform additional processing and
delivery to other destinations.
• GluePartitionCreator Lambda function—A utility function that automatically generates new daily
partitions in the AWS Glue Data Catalog raw_events Glue table on a recurring schedule.
• SolutionHelper Lambda function—An AWS Lambda-backed custom resource that is used during AWS
CloudFormation stack operations to help with stack provisioning and deployment.
The AWS Lambda functions created by the solution are enabled with AWS X-Ray to provide request
tracing for performance tuning and troubleshooting.
5Game Analytics Pipeline Implementation Guide
Amazon Simple Storage Service
Amazon Simple Storage Service
The solution uses Amazon Simple Storage Service (Amazon S3) to provide scalable and cost-effective
storage for raw and processed datasets. The Amazon S3 buckets are configured with object lifecycle
management policies, including Amazon S3 Intelligent-Tiering which provides cost savings for datasets
with unknown or changing access patterns, such as data lakes.
For information about Amazon S3 configuration and usage within the solution, refer to the Game
Analytics Pipeline Developer Guide.
AWS Glue
The solution deploys AWS Glue resources for metadata storage and ETL processing including:
• Configuring an AWS Glue Data Catalog
• Creating an AWS Glue database to serve as the metadata store for ingested data
• Deploying an AWS Glue ETL job for processing game events
• Deploying an AWS Glue crawler to update the Glue Data Catalog with processing results
The solution encrypts the AWS Glue Data Catalog using AWS KMS.
Amazon DynamoDB
The solution uses Amazon DynamoDB tables to store application configuration data. Each DynamoDB
table is provisioned using DynamoDB on-demand capacity to provide flexible scaling and reduce costs
for unpredictable access patterns.
The solution creates the following DynamoDB tables:
• Applications table—A table that contains data about the applications registered by data producers,
identified by ApplicationId. Ingested events are checked against this table before they are loaded
into storage to ensure that they are associated with a valid application.
• Authorizations table—A table that stores API keys, identified by ApiKeyId, and a mapping
to an ApplicationId. Each API key has the authorization to publish events to its associated
ApplicationId. This table is accessed by the ApplicationAdminServiceFunction Lambda
function for managing authorizations, and is queried by the LambdaAuthorizer Lambda function to
perform API authorization lookups on the events endpoint.
The solution provides encryption-at-rest of DynamoDB tables using AWS KMS.
Amazon CloudWatch
The solution uses Amazon CloudWatch to monitor and log the solution’s resources and provide storage
of real-time generated metrics from Kinesis Data Analytics. The solution deploys CloudWatch alarms
to track the usage of AWS resources and alert admin subscribers when issues are detected. Sending
metrics to CloudWatch allows the solution to rely on a single storage location for both real-time and
AWS resource metrics.
6Game Analytics Pipeline Implementation Guide
Amazon Simple Notification Service
For information about how Amazon CloudWatch is configured in the solution, refer to the Game
Analytics Pipeline Developer Guide.
Amazon Simple Notification Service
Amazon Simple Notification Service (Amazon SNS) distributes notifications generated by Amazon
CloudWatch alarms when resources are set above thresholds or errors are detected. The solution’s
admins can set up notifications for monitoring and troubleshooting purposes
The solution provides encryption-at-rest of the Amazon SNS topic using AWS KMS.
Amazon Athena
Amazon Athena enables you to run queries and reports on the game events data stored in the Amazon
S3 bucket. The solution comes with a set of pre-built, saved queries that enable you to explore game
events data. The solution deploys an Athena workgroup that enables you to create and save additional
queries.
7Game Analytics Pipeline Implementation Guide
Choose the appropriate streaming data ingestion method
Implementation considerations
Choose the appropriate streaming data ingestion
method
The Game Analytics Pipeline solution provides the following options for ingesting game event telemetry
data into the solution:
• Direct integration with Amazon Kinesis Data Streams—Choose this option if you want to integrate
directly with Amazon Kinesis Data Streams using one of the supported methods in AWS for integrating
with Amazon Kinesis.
• Proxy integration with the solution API events endpoint—Choose this option if you require custom
REST proxy integration for ingestion of game events. Applications send events to the events endpoint
which synchronously proxies the request to Kinesis Data Streams and returns a response to the client.
For instructions on how to set up the solution API to ingest events from your application, refer to the
Game Analytics Pipeline Developer Guide.
The solution ingests game event data by either submitting data to Kinesis Data Streams directly, or by
sending HTTPS API requests to the solution API which forwards the events to Kinesis Data Streams. The
REST API is the point of entry for applications that require custom REST API proxy integration. Kinesis
Data Streams provides several integration options for data producers to publish data directly to streams
and is well suited for a majority of use cases. For more information, refer to Writing Data to Amazon
Kinesis Data Streams in the Amazon Kinesis Data Streams Developer Guide.
Integration with game clients
If you are a mobile game developer or are developing a game without an existing backend, you can
publish events from your game and services directly to Kinesis Data Streams without the need for the
solution API. To integrate clients directly with Kinesis Data Streams, configure Amazon Cognito identity
pools (federated identities) to generate temporary AWS credentials that authorize clients to securely
interact with AWS services, including Kinesis Data Streams.
If you choose to integrate directly with Kinesis Data Streams, refer to the Game Analytics Pipeline
Developer Guide and review the format required by the solution for sending data records to the Kinesis
data stream.
Alternatively, you can integrate with the solution API events endpoint to abstract your backend
implementation from the client with a custom REST interface, or if you require additional customization
of ingest data.
Note
Using Amazon API Gateway to ingest data will incur additional costs. If you plan to ingest data
using the solution API, refer to the pricing information for Amazon API Gateway REST API to
determine costs based on your usage requirements.
Integration with game backends
If you operate a backend for your game, such as a game server or other application backend, use a
Kinesis Agent, Amazon Kinesis Producer Library (KPL), AWS SDK, or other supported Kinesis integration
8Game Analytics Pipeline Implementation Guide
Integration with AWS SDK
to send data directly to Kinesis Data Streams from your backend. This approach allows game clients and
other applications to benefit from reusing an existing client-server connection and authentication to
send telemetry events to your backend, which can be configured to ingest events and send them to the
Kinesis data stream. This approach can be used in situations where you want to minimize changes to
client integrations or implement high throughput use cases.
By collecting and aggregating events from multiple clients within your backend, you can increase overall
batching and ingestion throughput and perform data enrichment with additional context before sending
data to the Kinesis data stream. This can reduce costs, improve security, and simplify client integration
for games with existing backends. Many of the existing Kinesis Data Streams options provide automated
retries, error handling, and additional built-in functions. The KPL and AWS SDK are commonly used
to develop custom data producers, and the Kinesis Agent can be deployed onto your game servers to
process telemetry events in log files and send them to the Kinesis data stream.
Integration with AWS SDK
You can use the AWS SDK to integrate Kinesis Data Streams directly into your application. The AWS
SDK supports a variety of commonly used languages, including .NET and C++, and provides methods
such as .NET PutRecords and PutRecordsAsync for synchronous and asynchronous integrations to send
batches of game events directly to Kinesis Data Streams. When sending events directly to Kinesis Data
Streams, the solution expects each data record to adhere to the Game Event Schema defined in the
Game Analytics Pipeline Developer Guide, unless the solution is customized prior to deployment. Events
are validated against the schema to enforce data quality in the solution, and to process malformed data
before Amazon Kinesis Data Firehose attempts to load it into Amazon S3. Game developers can use the
Game Event Schema provided with the EventsProcessingFunction Lambda function as a reference
during development. For additional information, refer to the Game developers guide to getting started
with the AWS SDK on the Amazon Game Tech Blog.
Integration with Amazon QuickSight
Visualize game data using Amazon QuickSight. Connect Amazon QuickSight to Amazon Athena to
access your game data. You can create, configure, and customize dashboards for deep data exploration.
Instructions to connect Amazon Athena to Amazon QuickSight (p. 15) and to build the Amazon
QuickSight dashboard (p. 16) are provided in the Automated Deployment section.
Regional deployment
This solution uses Amazon Kinesis Data Analytics, Amazon Kinesis Data Firehose, AWS Glue, Amazon
Athena, and Amazon QuickSight, which are currently available in specific AWS Regions only. Therefore,
you must launch this solution in an AWS Region where these services are available. For the most current
service availability by AWS Region, refer to the AWS Region Table.
9Game Analytics Pipeline Implementation Guide
AWS CloudFormation Template
This solution uses AWS CloudFormation to automate the deployment of the Game Analytics Pipeline
solution in the AWS Cloud. It includes the following AWS CloudFormation template, which you can
download before deployment.
game-analytics-pipeline.template: Use this template to launch the Game Analytics
Pipeline solution and all associated components. The default configuration deploys Amazon API
Gateway, AWS Lambda, Amazon Kinesis, Amazon Simple Notification Service (Amazon SNS), Amazon
DynamoDB, AWS Glue, Amazon Athena, Amazon CloudWatch, AWS Key Management Service (AWS KMS),
and Amazon Simple Storage Service (Amazon S3), but you can also customize the template based on
your specific needs.
10Game Analytics Pipeline Implementation Guide
Prerequisites
Automated deployment
Before you launch the automated deployment, review the architecture, configuration, and other
considerations discussed in this guide. Follow the step-by-step instructions in this section to configure
and deploy the solution into your account.
Time to deploy: Approximately 5 minutes
Prerequisites
To run the Python script included in this solution, you must have the latest version of the AWS Command
Line Interface (AWS CLI) installed. If you do not have the AWS CLI installed, refer to Installing the AWS
CLI in the AWS Command Line Interface User Guide. Alternatively, you can simplify the deployment of the
script by using an AWS Cloud9 environment. For more information, refer to Creating an EC2 Environment
in the AWS Cloud9 User Guide.
Deployment overview
The procedure for deploying this architecture on AWS consists of the following steps. For detailed
instructions, follow the links for each step.
Step 1. Launch the stack (p. 12)
• Launch the AWS CloudFormation template into your AWS account.
• Review the template parameters, and adjust if necessary.
Step 2. Generate sample game events (p. 14)
• Publish sample events.
Step 3. Test the sample queries in Amazon Athena (p. 14)
• Query the sample events to get insights on the generated data.
Step 4. Connect Amazon Athena to Amazon QuickSight (p. 15)
• Connect Amazon Athena to Amazon QuickSight.
• Create the necessary calculated fields.
Step 5. Build the Amazon QuickSight dashboard (p. 16)
• Visualize the sample events to get insights on the generated data.
Step 6. View and add real-time metrics to the pipeline operational health dashboard (p. 26)
11Game Analytics Pipeline Implementation Guide
Step 1. Launch the stack
• Visit the Amazon CloudWatch console to view real-time metrics generated by Amazon Kinesis Data
Analytics and add them to the operational health dashboard.
Step 1. Launch the stack
This automated AWS CloudFormation template deploys the solution in the AWS Cloud.
Note
You are responsible for the cost of the AWS services used while running this solution. Refer to
the Cost (p. 2) section for more details. For full details, refer to the pricing webpage for each
AWS service used in this solution.
1. Sign in to the AWS Management Console and use the button below to launch the game-
analytics-pipeline.template AWS CloudFormation template.
Optionally, you can download the template as a starting point for your own implementation.
2. The template launches in the US East (N. Virginia) Region by default. To launch this solution in a
different AWS Region, use the Region selector in the console navigation bar.
Note
This solution uses Amazon Kinesis Data Analytics, Amazon Kinesis Data Firehose, AWS Glue,
Amazon Athena, Amazon Cognito, and Amazon QuickSight, which are currently available
in specific AWS Regions only. Therefore, you must launch this solution in an AWS Region
where these services are available. For the most current availability by AWS Region, refer to
the AWS Region table.
3. On the Create stack page, verify that the correct template URL shows in the Amazon S3 URL text
box and choose Next.
4. On the Specify stack details page, assign a name to your solution stack.
5. Under Parameters, review the parameters for the template and modify them as necessary. This
solution uses the following default values.
Parameter Default Description
EnableStreamingAnalytics Yes A toggle switch that
determines whether Kinesis
Data Analytics for SQL is
deployed in the solution.
KinesisStreamShards 1 Numerical value identifying the
number of shards to provision
for Kinesis Data Streams.
Note
For information about
determining the
shards required for
your throughput,
refer to Amazon
Kinesis Data Streams
Terminology and
12Game Analytics Pipeline Implementation Guide
Step 1. Launch the stack
Parameter Default Description
Concepts in the
Amazon Kinesis Data
Streams Developer
Guide.
SolutionAdminEmailAddress false An email address to receive
operational notifications
generated by the solution’s
resources and delivered by
Amazon CloudWatch. The
default false parameter
disables the subscription to the
Amazon SNS topic.
SolutionMode Dev The deployment mode for the
solution. The supported values
are Dev and Prod.
Note
Dev mode reduces the
Kinesis Data Firehose
buffer interval to
every one minute
to speed up data
delivery to Amazon
S3 during testing,
but this results in less
optimized batching.
Dev mode also
deploys the sample
Athena queries and
creates a sample
application and
API key for testing
purposes. Prod mode
configures Kinesis
Data Firehose with a
buffer interval of 15
minutes and does not
deploy the sample
Athena queries or
sample application
and API key.
6. Choose Next.
7. On the Configure stack options page, choose Next.
8. On the Review page, review and confirm the settings. Check the three boxes acknowledging that the
template will create AWS Identity and Access Management (IAM) resources.
9. Choose Create stack to deploy the stack.
You can view the status of the stack in the AWS CloudFormation console in the Status column. You
should receive a status of CREATE_COMPLETE in approximately five minutes.
10. After the stack is deployed, navigate to the Outputs tab. Record the values for GameEventsStream
and TestApplicationId. These values are needed in the following steps.
13Game Analytics Pipeline Implementation Guide
Step 2. Generate sample game events
Step 2. Generate sample game events
Use the Python demo script to generate sample game event data for testing and demonstration
purposes.
Note
To run the Python script, you must have the latest version of the AWS Command Line Interface
(AWS CLI) installed. If you do not have the AWS CLI installed, refer to Installing the AWS CLI in
the AWS Command Line Interface User Guide. Alternatively, you can simplify the deployment of
the script by using an AWS Cloud9 environment. For more information, refer to Creating an EC2
Environment in the AWS Cloud9 User Guide.
1. Access the GitHub repository and download the Python demo script from ./source/demo/
publish_data.py.
2. In a terminal window, run the following Python commands to install the demo script prerequisites.
python3 -m pip install --user --upgrade pip
python3 -m pip install --user virtualenv
python3 -m venv env
source env/bin/activate
pip install boto3 numpy uuid argparse
If these commands generate the following error: python3: can't open file
'publish_data.py': [Errno 2] No such file or directory, ensure that publish_data.py is
in your root directory.
Note
The solution uses Boto 3 (the AWS SDK for Python) to interact with Amazon Kinesis. The
solution also uses numpy, uuid, and argparse to accept arguments and generate random
sample game event data.
3. To install the demo script, navigate to the ./source/demo/ folder and run the following Python
command.
python3 publish_data.py --region --stream-name --
application-id
Replace with the AWS Region code where the AWS CloudFormation stack is deployed.
Replace and with the values you recorded from the
AWS CloudFormation stack, Outputs tab. These inputs configure the script to continuously generate
batches of 100 random game events for the provided application, and then publish the events to
Amazon Kinesis using the PutRecords API
Step 3. Test the sample queries in Amazon Athena
The solution provides sample Athena queries that are stored in an Athena workgroup. Use this procedure
to run a sample query in Amazon Athena.
1. Navigate to the Amazon Athena console.
2. From the Athena homepage, choose Get started.
3. Select the Workgroup tab on the top of the page.
4. Select the workgroup named GameAnalyticsWorkgroup-
and choose Switch workgroup.
5. In the Switch Workgroup dialog box, choose Switch.
14Game Analytics Pipeline Implementation Guide
Step 4. Connect Amazon Athena to Amazon QuickSight
6. Choose the Saved Queries tab.
7. Select one of the existing queries and choose Run query to execute the SQL.
8. Customize the query.
Note
For information about customizing queries, refer to Running SQL Queries Using Amazon
Athena in the Amazon Athena User Guide.
Step 4. Connect Amazon Athena to Amazon
QuickSight
Use this procedure to configure Amazon Athena as a data source within Amazon QuickSight
1. Navigate to the Amazon QuickSight console, choose Admin from the upper-right corner of the page,
and select Manage QuickSight.
2. On your account page, choose Security & permissions.
3. Under QuickSight access to AWS services, choose Add or remove.
4. Select Amazon Athena, and choose Next.
5. In the Amazon Athena dialog box, choose Next.
Note
If you previously configured Amazon QuickSight settings, you may need to deselect and
reselect the check box for Amazon Athena for the dialog box to appear.
6. In the Select Amazon S3 buckets dialog box, verify that you are on the S3 Buckets Linked To
QuickSight Account tab and then take the following steps:
• Select the AnalyticsBucket resource (created earlier by AWS CloudFormation).
• In the Write permission column, select the check box next to Athena Workgroup.
Note
Refer to the AWS CloudFormation stack, Outputs tab to identify the AnalyticsBucket
resource.
7. Choose Finish, and then choose Update.
8. Select the QuickSight logo in the top-left corner to navigate to the Amazon QuickSight console.
9. Choose Datasets in the left navigation pane.
10.Choose New dataset.
11.Choose Athena.
12.In the New Athena data source dialog box, Data source name field, enter a name (for example,
game-analytics-pipeline-connection).
13.In the Athena workgroup field, select the workgroup named GameAnalyticsWorkgroup- and choose Validate connection. After the connection is validated,
choose Create data source.
14.In the Choose your table dialog box, Database field, select the database that was deployed by AWS
CloudFormation. A list of available tables populates.
Note
The database value can be found in the AWS CloudFormation stack, Outputs tab, under the
Key name GameEventsDatabase.
15.Choose raw_events and choose Select.
16.On the Finish data set creation dialog box, select Directly query your data, and choose Edit/Preview
Data.
15Game Analytics Pipeline Implementation Guide
Step 5. Build the Amazon QuickSight dashboard
17.Select Add calculated field to create a calculated field.
18.In the Add calculated field page, enter level_id by replacing the Add name textbox placeholder.
19.In the Formula field, enter parseJson({event_data},"$.level_id") and choose Save. The
formula field is the large whitespace in the center of the page.
Note
Repeat steps 17 through 19 to create calculated fields for each data type you want to extract
from event_data. For additional information about unstructured event_data, refer to the
Game Analytics Pipeline Developer Guide.
20.Select Add calculated field to create a calculated field.
21.In the Add calculated field page, enter event_timestamp_time_format by replacing the Add title
textbox placeholder.
22.In the Formula field, enter epochDate({event_timestamp}), and choose Save. The formula field
is the large whitespace in the center of the page.
23.In the Data Prep page, choose Save.
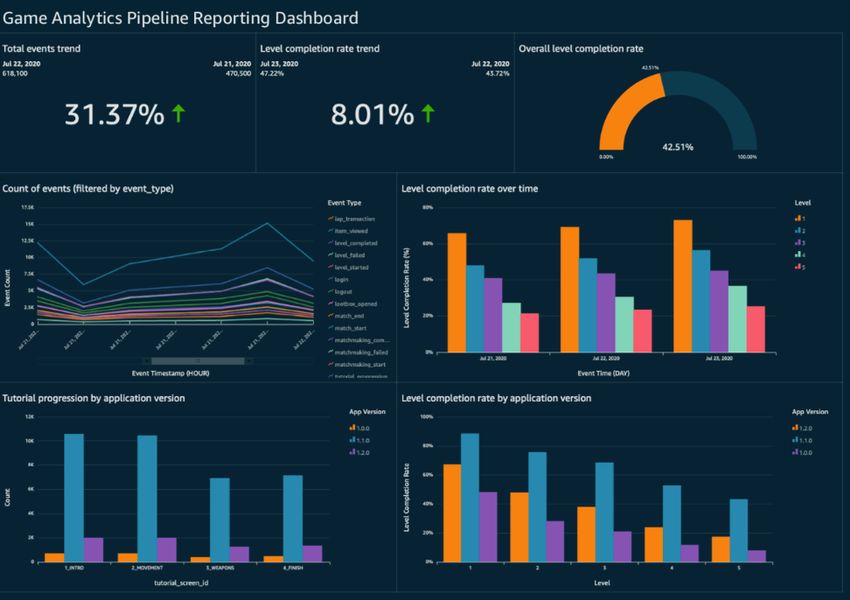
Step 5. Build the Amazon QuickSight dashboard
Use this procedure to build a dashboard from the visualizations. The dashboard includes a line chart
that shows unique player sessions over time, and multiple bar charts showing level completion rate and
tutorial progression.
Count of events filtered by event_type
Use this procedure to create a line chart.
1. Navigate to the Amazon QuickSight console.
2. On the Amazon QuickSight page, choose Analyses from the left navigation pane, and select New
analysis from the top-right menu bar.
3. On the Your Data Sets page, select raw_events.
4. In the raw_events dialog box, choose Create analysis. A new sheet with a blank visual displays.
Note
If a blank visual is not provided, choose + Add from the menu, and choose Add visual from the
drop-down list.
5. In the Visual types pane, select the line chart icon. Amazon QuickSight creates the visual.
6. In the Fields list pane, choose event_timestamp_time_format.
Note
If the Fields list pane isn't visible, choose Visualize from the left menu options.
7. On the Field wells page, verify that the fields are visualized.
8. In the Fields list pane, drag event_id into the Value Field Well.
9. In the Fields list pane, drag event_type into the Color Field Well.
10.On the Field wells page, select the drop-down arrow next to event_timestamp_time_format, then
highlight Aggregate: Day, and finally choose Minute.
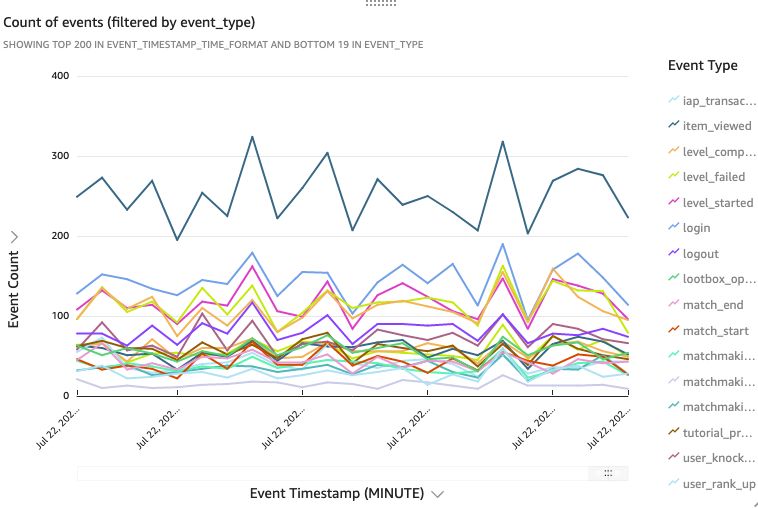
11.Change the title of the visualization by selecting and replacing the default visual label text to Count
of events (filtered by event_type).
16Game Analytics Pipeline Implementation Guide
Tutorial progression by application version
12.In the visual, select the gear icon, then in the Format visual pane, take the following actions:
• Select X-Axis and enter a label for the X-Axis, for example: Event Timestamp.
• Select Y-Axis and enter a label for the Y-Axis, for example: Event Count.
• Select Legend and enter a label for the legend, for example: Event Type.
Figure 2 is an example line chart visualization.
Figure 2: Example count of events filtered by event_type visualization
Tutorial progression by application version
Use this procedure to create a horizontal bar chart.
1. On the same Sheet, select + Add from the application bar, and then in the drop-down menu choose
Calculated field.
2. In the Add calculated field page, enter tutorial_screen_id by replacing the Add title textbox
placeholder.
3. In the Formula field, enter parseJson({event_data},"$.tutorial_screen_id") and choose
Save.
4. Choose + Add from the application bar, and then in the drop-down list choose Add visual.
5. In the Fields list pane, select tutorial_screen_id. Expand the drop-down menu for tutorial_screen_id
and then sort by a-z.
Note
If the Fields list pane isn't available, select Visualize.
6. In the Fields list pane, drag app_version into the Group/Color Field Well.
7. In the Visual types pane, select the vertical bar chart icon. Amazon QuickSight creates the visual.
17Game Analytics Pipeline Implementation Guide
Level completion rate by application version
8. If there is a bar displaying null values in the visual, select the bar and then choose Exclude empty.
This creates a filter that excludes all game events without the tutorial_screen_id field from the
visualization.
9. Change the title of the visualization by selecting and replacing the default visual label text to Tutorial
progression by application version. In the visual, select the gear icon. In the Format visual pane,
select X-Axis and enter a label for the X-Axis, for example Tutorial Screen. Select Y-Axis and
enter a label for the Y-Axis, for example Count. Select Legend and enter a label for the legend, for
example App Version.
Figure 3: Example tutorial progression by application version visualization
Level completion rate by application version
Use this procedure to create a vertical bar chart using custom SQL.
1. Navigate to the Amazon QuickSight console.
2. Choose Datasets from the left navigation pane.
3. Choose New dataset.
4. Choose Athena. In the New Athena data source dialog box, Data source name-field, enter a name
(for example, level_completion_rate by application version and day).
5. In the Athena workgroup field, select the workgroup named GameAnalyticsWorkgroup-, and choose Validate connection. After the connection is validated,
choose Create data source.
6. In the Choose your table dialog box, Database field, select the database that was deployed by AWS
CloudFormation. A list of available tables populates.
Note
The database value can be found in the AWS CloudFormation stack, Outputs tab, under the Key
name GameEventsDatabase.
7. Choose raw_events and then select Use custom SQL.
18Game Analytics Pipeline Implementation Guide
Level completion rate by application version
8. In the Enter custom SQL query dialog box, enter a name for the SQL query (for example, Level
completion rate by application version and day), copy the following SQL query, and
enter it into the Enter SQL here… field.
Note
Replace with the database value found in the AWS CloudFormation
stack, Outputs tab, under the Key name GameEventsDatabase.
with t1 AS
(SELECT json_extract_scalar(event_data,
'$.level_id') AS level, count(json_extract_scalar(event_data, '$.level_id'))
AS level_count, app_version, date_trunc('hour', from_unixtime(event_timestamp)) as
event_hour_utc
FROM ""."raw_events"
WHERE event_type='level_started'
GROUP BY json_extract_scalar(event_data, '$.level_id'), app_version,
date_trunc('hour', from_unixtime(event_timestamp))), t2 AS
(SELECT json_extract_scalar(event_data,
'$.level_id') AS level, count(json_extract_scalar(event_data, '$.level_id'))
AS level_count, app_version, date_trunc('hour', from_unixtime(event_timestamp)) as
event_hour_utc
FROM ""."raw_events"
WHERE event_type='level_completed'GROUP BY json_extract_scalar(event_data,
'$.level_id'), app_version, date_trunc('hour', from_unixtime(event_timestamp)))
SELECT t2.level,
t2.app_version,
(cast(t2.level_count AS DOUBLE) / (cast(t2.level_count AS DOUBLE) +
cast(t1.level_count AS DOUBLE))) * 100 AS level_completion_rate,
t2.event_hour_utc
FROM t1
JOIN t2
ON t1.level = t2.level
ORDER BY level;
9. Choose Confirm query.
10.In the Finish data set creation dialog box, select Directly query your data.
11.Choose Edit/Preview Data.
12.The custom SQL should generate a table of results. Choose Save from the menu.
13.Navigate to the Amazon QuickSight console.
14.On the Amazon QuickSight page, choose Analyses from the left navigation pane, and then choose
raw_events analysis.
15.To add a new dataset, in the data set pane, choose the edit icon.
16.Choose Add data set.
17.In the Choose data set to add dialog box, choose Level completion rate by application version and
day, then choose Select.
18.To select the new dataset, in the data set pane, expand the data set drop-down and select Level
completion rate by application version and day.
19.Select + Add from the application bar, and then in the drop-down menu choose Add visual.
20.In the Fields list pane, choose level to visualize.
Note
If the Fields list pane isn't visible, choose Visualize.
19Game Analytics Pipeline Implementation Guide
Level completion distribution over time
21.For Visual types, choose the vertical bar chart icon. By default, level is defined as the X-axis. Amazon
QuickSight creates the visual.
22.Add level_completion_rate for the Y-axis as the Value field well, and, in the drop-down menu next
to level_completion_rate (Sum), choose Aggregate: Sum and change it to Average. In the same
drop-down menu for level_completion_rate, choose Format and then More formatting options. In
the Format data menu, expand the Units menu and add % in the Suffix dialog box. Close out of the
Format data menu by choosing the x in the top right section of the menu.
23.Add app_version to the Group/Color field well.
24.Choose the gear icon to edit the visual. In the Format visual menu, expand the Y-Axis menu, and
input a label for the axis, such as Level Completion Rate. Under Custom range, enter 0 into the
Min dialog box and 100 into the Max dialog box. Under Axis step, choose Step size and enter 20 into
the dialog box. Expand the X-Axis menu and input a label for the axis, such as Level. Expand the
Legend menu and enter a label for the legend, for example App Version.
25.In the Field wells pane, expand the drop-down menu for level and choose to sort by a-z.
26.Change the title of the visualization by selecting and replacing the default visual label text to Level
completion rate by application version.
Figure 4: Example level completion rate by application version visualization
Level completion distribution over time
Use this procedure to create a vertical bar chart by reusing custom SQL.
1. On the same Sheet, ensure that Data set is still set to Level completion rate by application version
and day.
2. Select + Add from the application menu, and then in the drop-down menu choose Add visual.
3. In the Fields list pane, choose event_hour_utc to visualize.
4. For Visual types, choose the vertical bar chart icon. By default, event_hour_utc is defined as the X-
axis. Amazon QuickSight creates the visual.
5. Add level_completion_rate for the Y-axis as the Value field well, and, in the drop-down menu next
to level_completion_rate (Sum), choose Aggregate: Sum and change it to Average. In the same
drop-down menu for level_completion_rate, choose Format and then More formatting options. In
20Game Analytics Pipeline Implementation Guide
Events trend KPI
the Format data menu, expand the Units menu and add % in the Suffix dialog box. Close out of the
Format data menu by choosing the x in the top right section of the menu.
6. Add level to the Group/Color field well.
7. Select the gear icon to edit the visual and take the following actions:
• In the Format visual menu, expand the Y-Axis menu, and input a label for the axis, such as Level
Completion Rate (%).
• Under Custom range, enter 0 in the Min dialog box and 100 in the Max dialog box.
• Under Axis step, choose Step size and enter 20 into the dialog box.
• Expand the X-axis menu and input a label for the axis, such as Event Time.
• Expand the Legend menu and input a label for the axis, such as Level.
Note
This visualization uses the custom SQL query which aggregates level completion rate by the
hour as the most granular time range. Therefore, drill-downs to the minute in this visual are
not supported without changing the query to group by minute, which may result in slower
visualization load times.
8. Change the title of the visualization by selecting and replacing the default visual label text to Level
completion rate over time.
Figure 5: Example level completion rate over time visualization
Events trend KPI
Use this procedure to create a KPI to show the trend of the number of events going through the pipeline.
1. On the same Sheet, choose the Visualize tab, and change the Dataset to raw_events.
2. Choose + Add, and then in the drop-down list, choose Add visual.
3. In the Visual types pane, select the Key Performance Indicator (KPI) icon.
21Game Analytics Pipeline Implementation Guide
Level completion rate trend KPI
4. In the Fields list pane, drag event_id into the Value Field Well.
Note
If the Fields list pane isn't visible, choose Visualize.
5. In the Fields list pane, drag event_timestamp_time_format into the Trend group Field Well. Select the
drop-down arrow next to event_timestamp_time_format, and verify that Aggregate: Day is selected.
You can change the aggregate unit based on the trends you are trying to analyze.
6. Choose the gear icon to edit the visual. In the Format visual menu, under Comparison method, choose
Difference as percent (%).
7. In the KPI visual, choose the ellipsis icon, and in the drop-down menu, choose Conditional
formatting. In the Conditional formatting pane choose Add icon, choose the colored arrows in the
Icon set drop-down menu, which is the third option in the list, and choose Apply.
8. Change the title of the visualization by selecting and replacing the default visual label text to Total
events trend.
Figure 6: Total Events Trend KPI
Level completion rate trend KPI
Use this procedure to a create KPI to show the trend of the overall level completion rate.
1. On the same Sheet, choose the Visualize tab, and change the Data set to Level completion rate by
application version and day.
2. Choose + Add and then in the drop-down list choose Add visual.
3. In the Visual types pane, select the Key Performance Indicator (KPI) icon.
4. In the Fields list pane, drag level_completion_rate into the Value Field Well. In the drop-down menu
next to level_completion_rate (Sum), choose Aggregate: Sum and change it to Average. In the same
drop-down menu for level_completion_rate, choose Format and then More formatting . In the
Format data menu, expand the Decimal Places menu, choose Custom and change the value in the box
to 2. Expand the Units menu and add % in the Suffix dialog box. Close the Format data menu.
Note
If the Fields list pane isn't visible, choose Visualize.
5. In the Fields list pane, drag event_hour_utc into the Trend group Field Well. Select the drop-down
arrow next to event_hour_utc, and verify that Aggregate: Day, is selected. You can change the
aggregate unit based on the trends you are trying to analyze.
Note
This visualization uses the custom SQL query created earlier which aggregates level
completion rate by the hour as the most granular time range. Therefore, drill-downs to the
22Game Analytics Pipeline Implementation Guide
Level completion gauge
“Minute” in this visual are not supported without changing the query to group by minute,
which may result in slower load times for the visual.
6. Choose the gear icon to edit the visual. In the Format visual menu, under Comparison method, choose
Difference as percent (%).
7. In the KPI visual, choose the ellipsis icon and in the drop-down menu choose Conditional formatting.
Choose Add icon and then choose the colored arrows in the Icon set drop-down menu. Select Apply.
8. Change the title of the visualization by selecting and replacing the default visual label text to Level
completion rate trend.
Figure 7: Level Completion Rate Trend KPI
Level completion gauge
Use this procedure to create a gauge chart to show level completion rate
1. On the same Sheet, choose + Add and then in the drop-down list choose Add visual.
2. In the Visual types pane, select the Gauge chart icon.
3. In the Fields list pane, drag level_completion_rate into the Value Field Well. In the drop-down menu
next to level_completion_rate (Sum), choose Aggregate: Sum and change it to Average. In the
same drop-down menu for level_completion_rate, choose Format and then More formatting. In the
Format data menu, expand the Decimal Places menu, choose Custom, and then change the value in
the box to 2. Expand the Units menu and add % in the Suffix dialog box. Close the Format data menu.
4. Choose the gear icon to edit the visual. In the Format visual menu, under Axis Style and Range, set the
Min dialog box to 0 and set the Max dialog box to 100.
5. In the gauge visual, choose the ellipsis icon and in the drop-down menu choose Conditional
formatting. Choose Add icon, choose the colored arrows in the Icon set drop-down menu, and choose
Apply.
6. Change the title of the visualization by selecting and replacing the default visual label text to Overall
level completion rate.
23You can also read