ICES WGSE REPORT 2010 - SCICOM STEERING GROUP ON ECOSYSTEM FUNCTIONS Report of the Working Group on Seabird Ecology (WGSE)
←
→
Page content transcription
If your browser does not render page correctly, please read the page content below
ICES WGSE REPORT 2010
          SCICOM S TEERING G ROUP   ON   E COSYSTEM F UNCTIONS

                                    ICES CM 2010/SSGEF:10

                                         R EF . SSGEF, SCICOM

                            Report of the
Working Group on Seabird Ecology (WGSE)

                               15–19 March 2010
   ICES Headquarters, Copenhagen, Denmark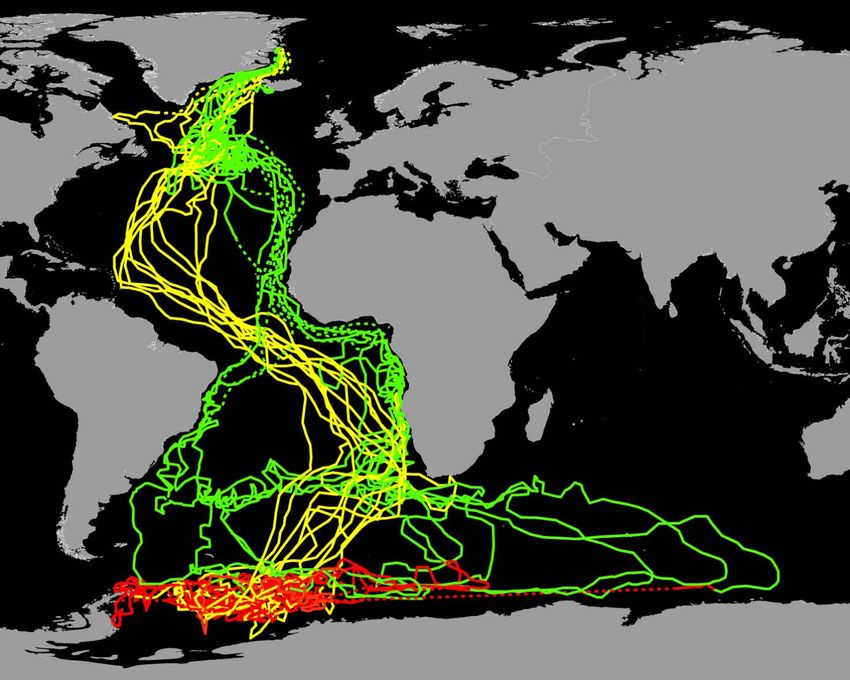
International Council for the Exploration of the Sea
Conseil International pour l’Exploration de la Mer
H. C. Andersens Boulevard 44–46
DK-1553 Copenhagen V
Denmark
Telephone (+45) 33 38 67 00
Telefax (+45) 33 93 42 15
www.ices.dk
info@ices.dk

Recommended format for purposes of citation:

ICES. 2010. Report of the Working Group on Seabird Ecology (WGSE), 15–19 March
2010, ICES Headquarters, Copenhagen, Denmark. ICES CM 2010/SSGEF:10. 77 pp.

For permission to reproduce material from this publication, please apply to the Gen-
eral Secretary.

The document is a report of an Expert Group under the auspices of the International
Council for the Exploration of the Sea and does not necessarily represent the views of
the Council.

© 2010 International Council for the Exploration of the Sea
ICES WGSE REPORT 2010                                                                                                                                | i

Conte nts

        Executive summary .............................................................................................................. 5

        1      Introduction .................................................................................................................... 6

        2      Recent progress with the OSPAR EcoQO for seabird populations...................... 7
               2.1      Further development of the EcoQO ................................................................... 8
               2.2      Updated evaluation of the EcoQO in OSPAR Region III ................................ 9
                         2.2.1      Introduction .............................................................................................. 9
                         2.2.2      Methods..................................................................................................... 9
                         2.2.3      Results ..................................................................................................... 13
                         2.2.4      Conclusions............................................................................................. 18
               2.3      References ............................................................................................................ 19

        3      Tracking studies of seabirds in ICES waters: case studies .................................. 19
               3.1      Introduction ......................................................................................................... 19
               3.2      Case study 1: The global migration of the Arctic tern (Egevang et
                        al. 2010) ................................................................................................................. 20
                         3.2.1 Background and aims ............................................................................ 20
                         3.2.2 Technological and analytical approach .............................................. 20
                         3.2.3 Main findings ......................................................................................... 21
               3.3      Case study 2: Spatial association between Northern gannets and
                        fishing vessels (Votier et al. 2010) ..................................................................... 22
                         3.3.1 Background and aims ............................................................................ 22
                         3.3.2 Technological and analytical approach .............................................. 22
                         3.3.3 Main findings ......................................................................................... 23
               3.4      Case study 3: Mapping foraging and wintering areas of rare and
                        endangered species............................................................................................. 24
                         3.4.1 Ivory gull wintering areas (Gilg & Strøm unpublished) .................. 24
                         3.4.2 Cahow foraging areas during the breeding season
                               (Madeiros & Carlile unpublished) ....................................................... 24
               3.5      New insights from tracking studies ................................................................. 25
                         3.5.1 Identification of previously unknown at-sea hot spots .................... 25
               3.6      References ............................................................................................................ 26

        4      Recent progress in addressing the problem of seabird bycatch in
               European Union waters .............................................................................................. 26
               4.1      Progress towards an EC-PoA-Seabirds............................................................ 27
                         4.1.1 Terms of reference of the study ........................................................... 28
               4.2      The external dimension of the EC-PoA ........................................................... 28
               4.3      Technical Conservation Measures Regulation (TCMR) ................................ 29
               4.4      New information on seabird bycatch in longline fisheries ........................... 29
                         4.4.1 Western Mediterranean – pelagic fleet ............................................... 29
                         4.4.2 Columbretes Islands – demersal and pelagic fleets .......................... 29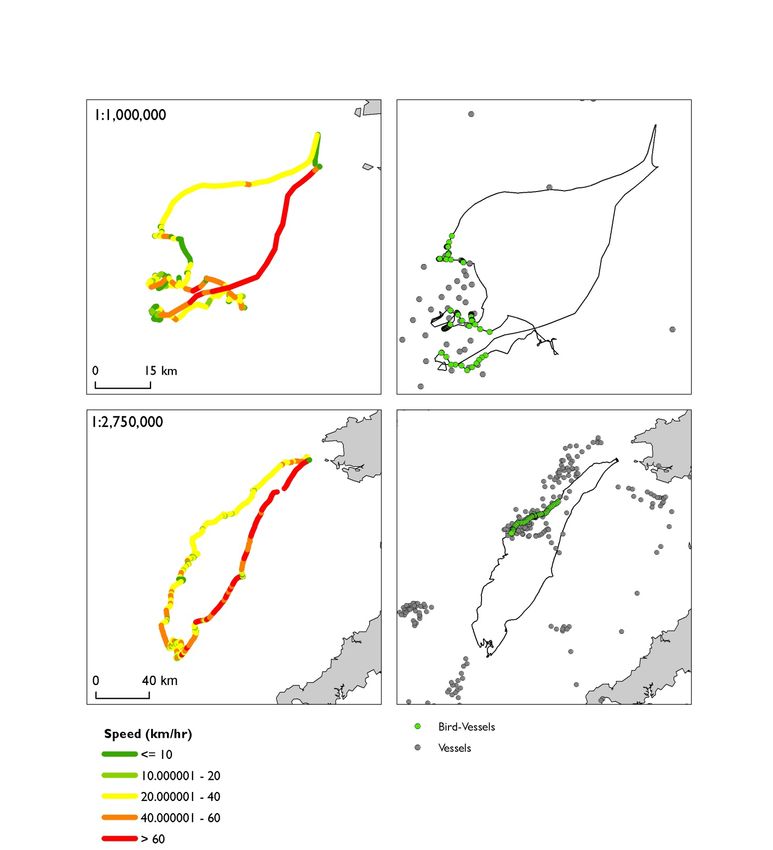
ii |                                                                                                          ICES WGSE REPORT 2010

                     4.4.3 Spanish Gran Sol – demersal fleet ....................................................... 30
                     4.4.4 Maltese demersal longline fleet ........................................................... 30
           4.5     New information on seabird bycatch in non-longline fisheries ................... 30
                     4.5.1 Species and numbers of birds caught in gillnet fisheries ................. 31
                     4.5.2 Species and numbers of birds caught in trawl fisheries ................... 33
                     4.5.3 Species and numbers of birds caught in driftnet fisheries ............... 34
           4.6     Assessing fishing effort and monitoring of seabird bycatch in EU
                   waters ................................................................................................................... 35
           4.7     New data on seabird bycatch mitigation measures for use in EU
                   fleets ...................................................................................................................... 35
           4.8     New information on seabird bycatch mitigation measures for
                   longline fisheries ................................................................................................. 36
                     4.8.1 Bait pods.................................................................................................. 36
                     4.8.2 Safe leads ................................................................................................. 36
                     4.8.3 Bait-setting capsule/Underwater baited hook ................................... 37
           4.9     New information on seabird bycatch mitigation measures for non-
                   longline fisheries ................................................................................................. 37
                     4.9.1 Trawl fisheries ........................................................................................ 37
                     4.9.2 Gillnet fisheries ...................................................................................... 38
           4.10 New information on existing seabird bycatch mitigation measures ........... 39
                     4.10.1 Underwater Setting Chute .................................................................... 39
                     4.10.2 Bait-casting/throwing machines .......................................................... 39
                     4.10.3 Fish oil ..................................................................................................... 40
           4.11 Conclusion ........................................................................................................... 40
           4.12 References ............................................................................................................ 40

       5   Interactions between parasites and climate change on seabirds ........................ 42
           5.1     Introduction ......................................................................................................... 42
           5.2     Effects of climate change on seabird-parasite interactions ........................... 43
                     5.2.1 Ratio of vector numbers to host numbers and disease range
                           expansion ................................................................................................ 43
                     5.2.2 Changes in vector competence ............................................................. 44
                     5.2.3 Changes in host pathogen contact rates ............................................. 44
                     5.2.4 Host susceptibility ................................................................................. 44
           5.3     Conclusions ......................................................................................................... 45
           5.4     References ............................................................................................................ 45

       6   Foraging interactions among seabirds, cetaceans and pelagic fish in
           the North Atlantic Ocean ........................................................................................... 47
           6.1     Introduction ......................................................................................................... 47
           6.2     Seabirds and Cetaceans ...................................................................................... 48
                     6.2.1 Large whales ........................................................................................... 48
                     6.2.2 Dolphins .................................................................................................. 49
                     6.2.3 Birds and seals ........................................................................................ 50
           6.3     Seabirds and tuna ............................................................................................... 50
ICES WGSE REPORT 2010 | iii
6.4 Data gaps and research needs for European waters ...................................... 51
6.5 References ............................................................................................................ 52
7 Identification of marine protected areas in EU waters ......................................... 53
7.1 Progress with SPA and IBA identification in EU waters............................... 54
7.1.1 United Kingdom .................................................................................... 54
7.1.2 Germany.................................................................................................. 56
7.1.3 Portugal ................................................................................................... 56
7.1.4 Spain ........................................................................................................ 56
7.1.5 Netherlands ............................................................................................ 57
7.2 Methods applied in the identification of SPAs and IBAs in EU
waters ................................................................................................................... 57
7.2.1 United Kingdom .................................................................................... 58
7.2.2 Germany.................................................................................................. 60
7.2.3 Portugal ................................................................................................... 61
7.2.4 Spain ........................................................................................................ 61
7.2.5 Netherlands ............................................................................................ 63
7.3 References ............................................................................................................ 64
8 Potential contribution by WGSE to the high priority topics of the
ICES Science Plan ........................................................................................................ 66
9 Planned contribution for the 2010 SSGEF session during the ICES
Annual Science Conference ....................................................................................... 71
Annex 1: List of participants............................................................................................... 72
Annex 2: English and scientific names of birds mentioned in this report ................ 73
Annex 3: WGSE Draft Terms of Reference for the second meeting in 2010 .............. 75
Annex 4: Recommendations ............................................................................................... 77
Annex 5: Proposal to the European Commission on a Joint Workshop
contributory to the drafting of an EC-PoA for Seabirds....................................... 78
Annex 6: Technical minutes ............................................................................................... 80ICES WGSE REPORT 2010 | 5
Executive summary
The ICES Working Group on Seabird Ecology met from 15 to19 March 2010 at ICES
HQ, Copenhagen. Chaired by Jim Reid (UK), eight participants attended the meeting
with remote contributions from a further five; eight nations were represented.
The objective of the meeting was to consider nine Terms of Reference and to make
recommendations for further action where appropriate. With more Terms of Refer-
ence than attendees, and no work carried out intersessionally, not all Terms of Refer-
ence given the group were addressed at the meeting and some were not addressed in
as much detail as would have been preferred. Each attendee largely worked on one
chapter of the report, although contributions to all chapters were made by most of the
group and feedback was offered in regular plenary sessions. Issues addressed by the
Terms of Reference included seabird bycatch in fisheries, an OSPAR Ecological Qual-
ity Objective for seabird populations, a report of case studies of the tracking of sea-
birds using data loggers, a review of literature on the associations between foraging
seabirds and other top predators, a review of progress with the identification of ma-
rine Special Protection Areas for seabirds, and a consideration of the possible conse-
quences of climate change on parasites hosted by seabirds.
The report comprises nine chapters, each addressing one Term of Reference, plus in-
troductory material and other information contained in Annexes, including two rec-
ommendations for further action by ICES.
An updated application of the OSPAR Ecological Quality Objective for 12 seabird
populations in OSPAR region III is presented in the report. This indicator failed to
reach its reference level in 11 of the 24 years for which data are available. The reasons
why some seabird populations have not fared well in recent years are various but
climate change and fisheries effects have probably played a role. It should be noted,
however, that there is some uncertainty associated with the value of the indicator as
confidence intervals around many seabird population estimates are wide. In view of
the value of the Ecological Quality Objective as a relatively simple to understand in-
dicator of the health of the wider marine environment, the report recommends that it
be further developed and applied to other OSPAR regions, with annual updates be-
ing channelled via the Working Group on Seabird Ecology.
The report presents new information and an updated review of the problem of sea-
birds being incidentally caught in fishing gear, which can cause significant mortality
in some seabird populations. The European Union has committed to establishing a
Plan of Action to mitigate this bycatch in its waters, but progress has been slow and it
has missed its own deadline for doing this. The report recommends that a workshop
be convened in autumn 2010 to bring together the key players, the EU, scientists and
fishers among them, who could best inform the compilation of a Plan of Action in
order to effect swifter progress towards reducing seabird bycatch.6 | ICES WGSE REPORT 2010
1 Introduction
Participation
The following members of the Working Group on Seabird Ecology (WGSE) attended
and participated in the meeting (see Annex 1 for full details):
• Orea Anderson UK
• Tycho Anker-Nilssen Norway
• Rob Barrett Norway
• John Chardine Canada
• Morten Frederiksen Denmark
• Jim Reid (Chair) UK
• Mark Tasker UK
• Richard Veit USA
Seven persons were nominated members of the group and one person was invited by
the WG Chair to attend this year's meeting. The authority to nominate persons not
yet nominated by national delegates was again considered by the group to be an ex-
tremely useful tool.
The following members and non-members of WGSE also contributed to the meeting
and/or report by correspondence: Pep (J. M.) Arcos (Spain), Mark Bolton (UK),
Thierry Boulinier (France), Francis Daunt (UK), Ben Dean (UK), Euan Dunn (UK),
Stefan Garthe (Germany), Kerstin Kober (UK), Ian Mitchell (UK), Sue O’Brien (UK),
Matt Parsons (UK), Martin Poot (Netherlands), Iván Ramírez (Portugal), and Linda
Wilson (UK).
Terms of Reference
The 2009 Statutory meeting of ICES gave the Working Group on Seabird Ecology
[WGSE] the following Terms of Reference:
a ) Review progress with further development of the OSPAR ecological qual-
ity objective (EcoQO) for seabird populations, and provide an updated
evaluation of the EcoQO in Ospar region III;
b ) Update and extend the review of studies of the distribution and habitat as-
sociations of seabirds in ICES waters based on remote tracking of individ-
ual birds;
c ) Review progress towards a Community Plan of Action to reduce seabird
bycatch in EU waters, and report any new data on fishing effort and sea-
bird bycatch in these waters;
d ) Explore the use of demographic, behavioural and physiological data as
early warning systems of population change in seabirds;
e ) Review the predicted interactions between parasites and climate change on
seabirds;
f ) Review and summarize the literature on foraging interactions among sea-
birds, cetaceans, and predatory schooling fish, especially tuna, mainly in
North Atlantic waters but with relevant material from all oceans;
g ) Review methodological approaches applied in, and progress with, the
identification of marine protected areas for birds in EU waters;ICES WGSE REPORT 2010 | 7
h ) Report by 15 March on potential contributions to the high priority topics of
ICES Science Plan by completing the document named
"SSGEF_workplan.doc" on the SharePoint site. Consider your current ex-
pertise and rank the contributions by High, Low or Medium importance;
i ) Prepare contributions for the 2010 SSGEF session during the ASC on the
topic areas of the Science Plan which cover: Individual, population and
community level growth, feeding and reproduction; The quality of habitats
and the threats to them; Indicators of ecosystem health.
With one exception, all Terms of Reference were addressed by WGSE. It was not pos-
sible to consider ToR d) because of the fewer than usual numbers of participants in
the meeting. For the same reason, some ToRs were not considered in as much detail
as the group would have preferred.
Note on bird names
Throughout the text we use official English names for bird species; scientific and Eng-
lish names are listed in Annex 2.
Acknowledgements
The Working Group on Seabird Ecology wishes to thank ICES Secretariat for excel-
lent facilities in ICES HQ in Copenhagen; Maria Lifentseva was especially helpful
during the meeting and in the production of this report. WGSE also thanks the Na-
tional Environmental Research Institute, Aarhus University for hosting the meeting
on one day. The following persons and organisations provided support, information
and data to enable the EcoQO for Ospar region III to be compiled: for the meeting:
the JNCC Seabird Monitoring Programme partners: BirdWatch Ireland, The British
Trust for Ornithology, Centre for Ecology and Hydrology, Countryside Council for
Wales, Department of Agriculture, Fisheries and Forestry (Isle of Man), Department
of Environment, Heritage and Local Government (Republic of Ireland), States of
Guernsey Government, Joint Nature Conservation Committee, Manx Birdlife, Manx
National Heritage, The National Trust, National Trust for Scotland, Natural England,
Northern Ireland Environment Agency, The Royal Society for the Protection of Birds,
Scottish Natural Heritage, The Seabird Group, Shetland Oil Terminal Environmental
Advisory Group, Scottish Wildlife Trust; and other organisations and volunteers
throughout Britain and Ireland.
WGSE thanks the following for providing access to unpublished information: Carsten
Egevang, Kasper Johansen, Jeremy Madeiros, Ævar Petersen, Paul Thompson, and
Steve Votier.
2 Recent progress with the OSPAR EcoQO for seabird populations
For the last ten years, WGSE has contributed to develop an EcoQO for the status of
seabirds within the OSPAR area. Application of the resulting system in OSPAR Re-
gion III indicates that it is scientifically sound and performing well according to the
main intentions of this EcoQO. As illustrated in last year’s report (ICES 2009), a rather
high proportion of the seabird populations in several OSPAR areas are currently
changing at rates beyond expected and desirable levels. WGSE therefore recognises
there is an urgent need for implementing the proposed EcoQO across the OSPAR
regions and, in this context, to employ the improved statistical framework for assess-8 | ICES WGSE REPORT 2010
ing population trends that is applied in the revised analysis for OSPAR III presented
in section 2.2 of this chapter.
2.1 Further development of the EcoQO
A workshop to develop a Seabird Ecological QUality INdicator (WKSEQUIN) was
requested by OSPAR’s Biodiversity Committee (BDC). The Workshop was organised
by the ICES WGSE, in collaboration with the UK’s Joint Nature Conservation Com-
mittee (JNCC) and the German Delegation on the BDC. WKSEQUIN was held in Lis-
bon on 8–9 March 2008 and hosted by Sociedade Portuguesa para o Estudo das Aves
(SPEA). The aim of the workshop was to continue the development previously car-
ried out by WGSE, of an EcoQO on Seabird population trends as an index of seabird
community health, and in doing so, to produce at least one EcoQO with its associated
indicator, target, and limit as an example of what others might look like.
Based on the results of WKSEQUIN (ICES 2008), ICES advised OSPAR to adopt a
single EcoQO: "Changes in breeding seabird abundance should be within target lev-
els for 75% of species monitored in any of the OSPAR regions or their subdivisions."
The aims of the EcoQO should be to ensure the intrinsic health of seabird communi-
ties, and to provide triggers for appropriate action.
Separate EcoQO indicators were proposed for each OSPAR region or‐region, sub
each consisting of species‐specific trends in abundance of a number of species where
good quality monitoring data were available. Data were immediately available to
construct an indicator for OSPAR III (ICES 2008), which has been updated herein (see
below).
Data were also available for OSPAR region V but as yet, no indicator for this region
has been produced. Further data collation is required to construct indicators for
OSPAR regions II and IV. A subdivision of OSPAR I and expansion of monitoring in
some of its subareas is required before sufficient data will be available to construct a
robust indicator.
In a background document on the EcoQO presented by the German Delegation to the
OSPAR Working Group on Marine Protected Areas Species and Habitats (OSPAR
2009) they concluded:
• The EcoQO on seabird population trends has been demonstrated to work
in OSPAR III;
• Further work is required to collate data in OSPAR II and IV: a depository
for data is needed to be nominated within OSPAR II, IV and V;
• Further work is required in OSPAR II, IV and V to set up analytical models
for estimating trends in each species and to set reference and target levels
for each regional species.
At MASH 2009 Germany offered "to consider facilitating the collation and analysis of
existing data on seabird breeding abundance for the North Sea with a view to con-
struct specific target and reference levels for OSPAR Region II. To support this, Con-
tracting Parties bordering the North Sea are requested to facilitate the provision of
relevant data to support construction of the specific target and reference levels. Ger-
many will circulate specifications for the data required in due course."
At MASH 2009 France offered "to support the collation of appropriate data for the
construction of target and reference levels for Region IV and to clarify the needs for
provision of data by other Contracting parties in the Region."ICES WGSE REPORT 2010 | 9
The adoption by OSPAR of the EcoQO on seabird population trends is likely to de-
pend on it being an appropriate indicator in assessing and achieving Good Environ-
mental Status (GES) as part of measures to be implemented under the EC Marine
Strategy Framework Directive (MSFD; EU 2008). The goal of the MSFD is to achieve
GES for European seas by 2020. The main guiding principles for achieving this are set
out in the list of 11 qualitative descriptors contained in Annex 1 of the Directive.
These cover a broad range of issues including biological diversity, seabed integrity,
eutrophication, contaminants, litter and underwater noise. Task Groups have been
established to promote a comparable and consistent interpretation of the concept of
GES. The output of the Task Groups will be assessed by the Working Group on Good
Environmental Status, which will in turn report to the Marine Strategy Coordination
Group and the Marine Directors. The work is due to be completed in May 2010. Task
Group 4 – ‘Food webs’ has recommended that the EcoQO on Seabird Population
Trends be adopted as part of the indicator suite for determining GES with respect to
food webs. Task group 1 – ‘Biological Diversity’ – has not attempted to list all poten-
tial indicators for this descriptor, but has included the EcoQO as indicator in an ex-
ample of the process it is recommending for the monitoring and assessment of GES.
2.2 Updated evaluation of the EcoQO in OSPAR Region III
2.2.1 Introduction
WKSEQUIN used data from OSPAR Region III to demonstrate and test the process of
determining whether the EcoQO had been achieved in a given year (ICES 2008). The
indicators for the EcoQO were intra-specific trends in abundance of eight species of
seabird during the period 1986–2006. Data for OSPAR Region III were collected as
part of the UK and Ireland’s Seabird Monitoring Programme (SMP). Reference levels
for each species were derived from previous censuses of the whole OSPAR region
(see Table 2.1). An upper target level of 130% of the reference level was set for all spe-
cies, while a lower target level of 80% was set for species that lay one egg and a sepa-
rate lower target level of 70% for species that lay more than one egg. The same targets
and references are used in this update.
In updating the EcoQO we have added data from 2007–2009, included plot counts as
well as whole colony counts and added four more species. Most colonies in OSPAR
III were not surveyed in each year of the time series, so imputation techniques were
used to estimate the missing counts. The imputation methods used in this update are
different to those used in ICES (2008) – for details see section 2.2.2 below.
2.2.2 Methods
The first assessment of the EcoQO (ICES 2008) used log-linear models (through the
software package TRIM) to provide estimates of trends in abundance of each species.
However, such models tend to be inappropriate for the seabird species included in
the EcoQO indicator because their trends exhibit little or no spatial synchrony and,
for species such as terns and cormorants, a substantial proportion of colonies have
undergone extinction or colonisation events.
Since WKSEQUIN, JNCC in collaboration with Biomathematics and Statistics Scot-
land developed an analytical ‘wizard’ for estimating trends in breeding numbers of
individual species at various geographical scales including OSPAR Regions. The sea-
bird trend wizard uses a modified chain method, first developed by Thomas (1993),
to impute values of missing counts based on information in other years and sites (de-
tails of the Thomas method are given in Annex 3 of ICES 2008). The wizard is a small10 | ICES WGSE REPORT 2010
Delphi application that retrieves counts from an Access database and generates script
files and a DOS batch file that instruct R to conduct the trend analysis using the Tho-
mas (1993) method. A further advantage of the new wizard is that the analyses can
incorporate both whole colony counts and plot counts, even when they exist for the
same colony in the same year.
It is important to note that the confidence intervals about the estimates obtained us-
ing the imputation procedure were typically very wide. This reflected the fact that the
method is empirical, and that the intervals were based on a form of nonparametric
resampling that makes only weak assumptions regarding the structure of the data.
In this update we included data from four additional species: Arctic skua, great cor-
morant, little tern and roseate tern. The reference levels for these species are given in
Table 2.1.ICES WGSE REPORT 2010 | 11
Table 2.1. Species-specific reference levels for OSPAR III.
S PECIES OSPAR III REFERENCE LEVELS P ROPORTION OF
REGIONAL
ABUNDANCE 1 YEAR
POPULATION IN
SAMPLE SOURCE J USTIFICATION FOR REFERENCE LEVEL
Northern fulmar a Numbers increased and range expanded throughout most of 20th century,
192.295 1998–2000 7%
but plateaued during Seabird 2000 in NW Scotland where there are the
largest colonies in OSPAR III; however, it appears to be still increasing in
Wales and possibly in SW England and Ireland.
Arctic skua b The counts during 1986-87 provided the first comprehensive estimate of
193 1986–1987 62%
numbers breeding throughout the Region. More recently censused in 2001-
02. Severe declines in breeding numbers in neighbouring OSPAR II from
late 1990s onwards, suggest large negative anthropgenic impacts on food
supply that has been exacerbated by increased predation and competition
from great skuas. The population estimate in 1986-87 is therefore less
influenced by anthropogenic impacts than more recent estimates.
Great cormorant a Most coastal breeding cormorants in OSPAR III are thought to be of the
9.074 1999–2001 76%
nominate sub-species. OSPAR III hosts almost one fifth of the world
population of P.c.carbo, so higher population estimates were chosen as
reference level. Note: following this estimate, in 2003, the maximum
number of licences issued per year for culling cormorants in England and
Wales increased from 200 to 2-3,000.
European shag b Numbers were increasing throughout most of Britain and Ireland, until
22.362 1986–1988 59%
large mortality event (or ‘wreck’) as a result of severe weather during the
winter of 1992/93 severely reduced breeding numbers. Therefore, the
Seabird Colony Register provides the best reference level.
Herring gull b Numbers were probably artificially elevated during the 1960s by
106.415 1986–1987 59%
uncontrolled discarding and offal discharge by fisheries. Subsequent
controls were probably responsible for a large decrease during the 1970s
and early 1980s. During the 1990s numbers in Ireland were severely
reduced during outbreaks of botulism. The population size during the SCR
was probably the least impacted by human pressures.
Great black-backed gull b Similar scenario to the herring gull.
10.261 1986–1988 53%12 | ICES WGSE REPORT 2010
S PECIES OSPAR III REFERENCE LEVELS P ROPORTION OF
REGIONAL
ABUNDANCE 1 YEAR
POPULATION IN
SAMPLE SOURCE J USTIFICATION FOR REFERENCE LEVEL
Black-legged kittiwake b Increased in numbers between the censuses in 1969/70 and 1985-88, but
118.222 1985–1987 57%
subsequent food shortages in NW Scotland may have reduced numbers
there. Therefore, the SCR provides the best reference level.
Little tern b, c The number of birds attempting to breed are highly variable from one year
648 1986–1987 78%
to the next and greatly affected by local conditions (e.g. predation). Little
change in numbers breeding in the region between mid 1980s and 2000, so
opted for slightly higher estimate in 1986-87.
Sandwich tern b, c Mortality of birds on wintering grounds in W. Africa appears to have
4.610 1987–1988 95%
increased in late 1980s and early 1990s, partially through trapping.
Therefore, the SCR and All-Ireland tern survey (1984) appear to provide the
best reference levels.
Roseate tern There were very large declnes in breeding numbers during the 1970s and
2.700 1967–1968 100%
1980s, mainly due to high mortality resulting from trapping on the
wintering grounds in W. Africa. Therefore the 1967-68 population estimates,
prior to this significant anthropogenic impact, provide the best reference
level.
Common guillemot a Numbers have steadily increased throughout the 1970s, 1980s and 1990s,
616.975 1998–2000 74%
and continue to do so throughout most of OSPAR III. Seabird 2000
provided the most recent population estimate, but depending on future
changes in population size, subsequent censuses may provide a more
appropriate reference.
Razorbill a As for common guillemot
135.663 1998–2001 62%
Source: a) Seabird 2000 (Mitchell et al. 2004), b) Seabird Colony Register Census (Lloyd et al. 1991, Mitchell et al. 2004), c) All-Ireland Tern Survey (Whilde 1985). 1Unit of abundance is pairs for all
species except Alca torda and Uria aalge, which are listed as the number of birds.ICES WGSE REPORT 2010 | 13
In ICES (2008) separate trend models were produced for data collected from Britain
and from Ireland of great black-backed gull, herring gull and black-legged kittiwake
in an attempt to reduce potential error from assuming synchrony between colonies
when using TRIM to model the trends. For all other species, data were too sparse to
produce separate trends for Britain and Ireland, so data were pooled for the whole of
OSPAR region III. In the 2009 update, modelling separate trends for Britain and for
Ireland did not increase the accuracy or reduce uncertainty of the resultant OSPAR
regional trend for any species. For all species, data from throughout OSPAR III were
pooled for trend modelling.
The accuracy and precision of the modelled regional trend for northern fulmar were
increased by restricting data input from only those colonies that had been surveyed
in 5 years or more during 1986–2009. Data from all other species derived from colo-
nies that had been surveyed in 2 or more years during 1986–2009 (as in ICES 2008).
This reduced the sample size for fulmar to just 7% of the total number of pairs known
to breed in OSPAR III (1998–2002 census; Mitchell et al.2004), compared with more
than 50% for all other species (Table 2.1).
Reference levels for each species are presented in Table 2.1. These same references
were used in ICES (2008), except for the four additional species mentioned (Arctic
skua, great cormorant, little tern and roseate tern).
2.2.3 Results
The EcoQO was not achieved in 1988, 1989, 1990, 1992 and in consecutive years dur-
ing 2003–2009 (see Figure 2.1). It made little difference to the assessment whether
eight (cf. ICES 2008) or 12 species were included (see Figure 2.1a and b). ICES (2008)
discussed possible reasons why the ECoQO was not achieved during the late 1980s
and early 1990s. This update will concentrate on why it was not achieved in 2003–
2009.
a) n=8 species14 | ICES WGSE REPORT 2010
b) n=12 species
Figure 2.1. The proportion of species in OSPAR III that were within target levels of abundance
during 1986-2009, based on a) the same eight species as used in the assessment of EcoQO in ICES
(2008), or b) with an additional four species included (see text). The EcoQO was not achieved in
years when the proportion dropped below 75%.
The number of species not achieving targets during 2003–2009 increased in consecu-
tive years from four to nine in both 2008 and 2009. In the last 2 years, the abundance
of six species had fallen below their respective lower targets, while three species ex-
ceeded the upper targets. The species exceeding targets at some point during 2003-09
were great cormorant, little tern and Sandwich tern (Figure 2.2). If these three species
had not exceeded their targets, the EcoQO would still not have been achieved in con-
secutive years between 2005 and 2009 because the abundance of four or more species
fell below lower target levels.ICES WGSE REPORT 2010 | 15
16 | ICES WGSE REPORT 2010
ICES WGSE REPORT 2010                                                                                 | 17

        Figure 2.2. Trends in abundance in OSPAR Region III. Fine dotted lines indicate upper and lower
        boot-strapped confidence limits. Bold dashed lines indicate upper and lower targets; 100 =
        reference level.

        Roseate tern abundance has been below the lower target throughout 1986–2009, but
        has steadily increased during this period from 18% to 45% of the reference level.
18 | ICES WGSE REPORT 2010
European shag abundance was relatively lower than roseate tern in 2009 (i.e. 44% of
reference level). Shag numbers have been at or below the lower target since 1993, but
have been declining further since 2004.
Herring gull numbers have been in decline since the early 1970s but the reference
level was set at mid 1980s level because numbers were thought to have been previ-
ously elevated by anthropogenic activities (e.g. commercial fisheries). Numbers have
been steadily decreasing since 2000 and fell below target levels from 2002 onwards.
Arctic skua numbers have been below the lower target since 2005, and in 2009 were
63% of the reference level.
Black-legged kittiwake and northern fulmar numbers both fell below the target level
in 2008 and 2009. Kittiwake numbers have been declining since about 2000 whereas
the decline in fulmar numbers began earlier in the mid 1990s but has become steeper
since 2006.
Great black-backed gull numbers have remained within target levels throughout
1986–2009 and have shown no discernable trend. Razorbill and common guillemot
numbers increased steadily during the 1980s and 1990s but appear to have stabilised
during 2003–2005 just below upper target levels. There are signs of a decrease in ra-
zorbill numbers in the last 2–3 years.
2.2.4 Conclusions
The failure to achieve the EcoQO in OSPAR III in consecutive years between 2003 and
2009 does represent cause for concern given that numbers of six of the twelve species
sampled were all below lower target levels in 2008 and 2009 and five species showed
substantial declines.
The declines in three of these species, roseate tern, Arctic skua and herring gull, have
already been highlighted within the UK and have been listed on the UK Biodiversity
Action Plan and on the Red list of Birds of Conservation Concern in the UK (Eaton et
al. 2009). Roseate tern numbers have been increasing as a direct result of intensive
management of colonies in Ireland. Arctic skuas are relatively scarce in OSPAR III
but the trend here mirrors a steeper decline in the neighbouring Northern Isles
(OSPAR II) where impacts of climate change and fishing on food supply have has
been exacerbated by increased predation and competition from great skuas. The
cause of the decline in herring gulls throughout the UK and Ireland is less well un-
derstood and requires further research.
The EcoQO highlights a substantial decline in shag numbers in OSPAR III. Declines
have occurred in the rest of the UK but not to the same extent. Further work is ur-
gently needed to investigate the cause of this decline.
The recent decreases in kittiwake and fulmar numbers in OSPAR III demand contin-
ued monitoring and investigation is required to determine the likely causes. Kitti-
wake colonies within OSPAR III have been more successful than colonies on the east
coast of Britain (OSPAR II), which have been in decline in some areas since the late
1980s. A shortage of sandeels off the east coast is probably responsible for poor
breeding there, but kittiwakes at colonies in western Britain tend to feed on other
species of fish. More work is needed into the variation in availability of these prey
species.
There is probably little for conservation managers to be concerned about regarding
the increase in little and Sandwich tern numbers; it represents a successful conserva-
tion gain, following intensive management at most colonies to reduce the impacts ofICES WGSE REPORT 2010 | 19
predators. It would make sense to increase the reference levels for these two species.
The increase in great cormorant numbers may have negative implications locally at
some colonies where competition for nest sites is intense. However, the carbo subspe-
cies is relatively scarce with just 52 000 pairs globally (Mitchell et al. 2004) and is
culled both legally and illegally because of conflict with fisheries. It is probably
worth monitoring the large and expanding colonies for any impacts on other species.
2.3 References
Eaton, M.A., Brown, A.F., Noble, D.G., Musgrove, A.J., Hearn, R.D., Aebischer, N.J., Gibbons,
D.W., Evans, A. and Gregory, R.D. 2009. Birds of Conservation Concern 3. The popula-
tion status of birds in the United Kingdom, Channel Islands and Isle of Man. British Birds
102: 296-341.
EU. 2008. Directive 2008/56/EC of the European Parliament and of the Council of 17 June 2008
establishing a framework for community action in the field of marine environmental pol-
icy (Marine Strategy Framework Directive).
ICES. 2008. Report of the Workshop on Seabird Ecological Quality Indicator, 8-9 March 2008,
Lisbon, Portugal. ICES CM 2008/LRC:06. 60 pp.
ICES. 2009. Report of the Working Group on Seabird Ecology (WGSE) 2009. ICES CM
2009/LRC:05. 88 pp. International Council for the Exploration of the Sea, Copenhagen,
Lloyd, C., Tasker, M.L., and Partridge, K. 1991. The status of seabirds in Britain and Ireland. T.
and A.D. Poyser, London.
Mitchell, P.I., Newton, S.F., Ratcliffe, N., and Dunn, T.E. 2004. Seabird Populations of Britain
and Ireland. T. and A.D. Poyser, London.
OSPAR 2009. Background Document on the Ecological Quality Objective (EcoQO) for Seabird
Population Trends. Paper presented to OSPAR Convention for the Protection of the Ma-
rine Environment of the North-East Atlantic Meeting of the Working Group on Marine
Protected Areas, Species and Habitats. Vilm: 24-26 November 2009 (MASH 09/3/4-E).
Thomas, G.E. 1993. Estimating annual total heron population counts. Applied Statistics, 42,
473-486.
Whilde, A. 1985. The All-Ireland Tern Survey 1984. Unpublished IWC/RSPB Report, Dublin.
3 Tracking studies of seabirds in ICES waters: case studies
At its 2008 meeting, WGSE formulated a Term of Reference aimed at summarizing
the results of studies of the distribution and habitat associations of seabirds in ICES
waters as revealed by remote tracking of individual birds. This is a very large and
rapidly developing subject, and it was not possible to cover it exhaustively at the
2009 meeting (ICES 2009). Therefore, a new Term of Reference for the 2010 meeting
was formulated to extend and update the review. The 2009 chapter focussed on tech-
nological and analytical issues and presented a preliminary review of published and
ongoing studies using a variety of techniques to track the movements of individual
birds and evaluate their habitat preferences at sea, followed by a brief summary of
data analysis issues. Here, we focus more on the results and insights obtained
through these studies and present a number of illustrative case studies.
3.1 Introduction
Species’ distributions and habitat associations are central components of their ecol-
ogy, and provide crucial underpinning data for their conservation and for the identi-
fication of protected areas. Two main methods have been employed to ascertain
distribution – surveying (principally transect surveying) and individual animal track-20 | ICES WGSE REPORT 2010
ing. Both methods have proven invaluable and have complementary advantages (see
Table 3.1 in ICES 2009).
One important goal of animal tracking is to record an animal’s location, from which
population distribution is inferred. Habitat association is typically then inferred by
comparing distribution with available habitat within the animal’s potential range, the
habitat data having been collected by other methods (e.g. remote sensing, habitat
mapping). Alternatively, habitat association may be inferred directly by a data log-
ger.
In the marine environment, there has been a particularly wide adoption of individual
animal tracking as a technique for estimating distribution, because direct surveying
tends to be expensive and logistically difficult. With identification of important sea-
bird habitats being critically important for spatial planning, and helping to identify
both Special Protection Areas (EU 2009) and areas of common usage by seabirds and
fishery, tracking of individual birds using electronic devices is one of the most impor-
tant sources of information available for these purposes.
As summarized in ICES (2009), this method has some important advantages over
surveying methods, in particular the quality of information that is obtained on indi-
viduals. This includes high quality data on where an individual carries out different
activities such as feeding and resting at sea, which is important in interpreting habitat
associations. Animal tracking also provides invaluable information on the individ-
ual’s status, including its provenance, breeding status and gender. These are all im-
portant variables in understanding the constraints under which the individual is
operating, which in turn aids in the interpretation of distribution and habitat associa-
tion.
Here, we review a number of recent case studies from the ICES region that illustrate
what can be achieved by tracking seabirds. These case studies are selected so that
they cover work on widely differing geographical scales and with different aims. We
also attempt to generalise across case studies to identify some of the key insights ob-
tained through the use of tracking technologies.
3.2 Case study 1: The global migration of the Arctic tern (Egevang et al. 2010)
3.2.1 Background and aims
The Arctic tern has long been suspected to have the longest annual migration of all
birds, as it breeds in boreal and Arctic areas of the northern hemisphere and winters
in the Southern Ocean near Antarctica. However, until very recently it was not logis-
tically feasible to track the migration of such a small bird (weighing not much more
than 100 g) over such vast distances and throughout the annual cycle. The availability
of miniature geolocators (see ICES 2009 and next section) changed this, and the
Greenland Institute of Natural Resources, in collaboration with the Icelandic Institute
for Natural History and the British Antarctic Survey, decided to carry out such a
study in 2007–2008. The main aim of the study was to map the annual migration of
the Arctic tern and to identify whether there were any areas of specific importance to
the species during the many months individuals spend at sea, usually out of sight of
land.
3.2.2 Technological and analytical approach
The study used geolocators (light loggers) from British Antarctic Survey weighing 1.4
g (model Mk14). These loggers were attached to a standard plastic leg ring. 50 adultICES WGSE REPORT 2010 | 21
breeders were equipped with loggers in NE Greenland, and 20 in Iceland during the
2007 season. Researchers managed to recapture 10 of these birds in Greenland and
one in Iceland during 2008. Considerably more birds were observed back at the colo-
nies, but some did not breed, some nests could not be located (Arctic terns do not
exhibit nest fidelity within colonies), and some birds were too shy to capture. Migra-
tion tracks were plotted and measured after smoothing. Relationships with habitat
variables (biological productivity, prevailing wind patterns) were assessed infor-
mally.
3.2.3 Main findings
Figure 3.1. Interpolated geolocation tracks of 11 Arctic terns tracked from breeding colonies in
Greenland (n = 10 birds) and Iceland (n = 1 bird). Green = autumn (postbreeding) migration (Au-
gust–November), red = winter range (December–March), and yellow = spring (return) migration
(April–May). Map courtesy of C. Egevang, Greenland Institute of Natural Resources.
While the large-scale patterns of Arctic tern migration were known, the study re-
sulted in several completely novel findings: 1) Perhaps most surprisingly, birds were
found not to migrate directly to the South Atlantic after the breeding season, but in-
stead to spend most of August (an average of 24.6 days) in the central North Atlantic
(Figure 3.1) in an area that previously was not known to be important for seabirds.
Satellite telemetry shows that biological productivity in this area is high; 2) After
reaching W Africa, the birds split into two groups, one following the African coast22 | ICES WGSE REPORT 2010
south and the other one crossing to South America; 3) All 11 birds spent most of the
northern winter in the Weddell Sea, east of the Antarctic Peninsula (although three
birds first made an excursion into the Indian Ocean sector of the Southern Ocean).
This area is also highly productive; 4) Average speed was higher during northward
than southward migration (520 vs. 330 km day-1). This was probably due to wind
assistance, as the S-shaped track is consistent with prevailing wind patterns; 5) The
overall annual migration was even longer than expected, on average 70 900 km.
This study has thus provided a much deeper insight into the migration ecology of a
seabird with a truly global range. While the findings do not have direct management
implications, they make it clear that Arctic terns, in common with other long-distance
migrants, rely on sufficient food being available at several widely separated areas of
the Atlantic and Southern Oceans, and thus that threats to any of these areas could be
critical for the species. Furthermore, the study highlights the ecological importance of
a previously unknown staging area in the central N Atlantic, an area that also seems
to be important for other seabirds (see below).
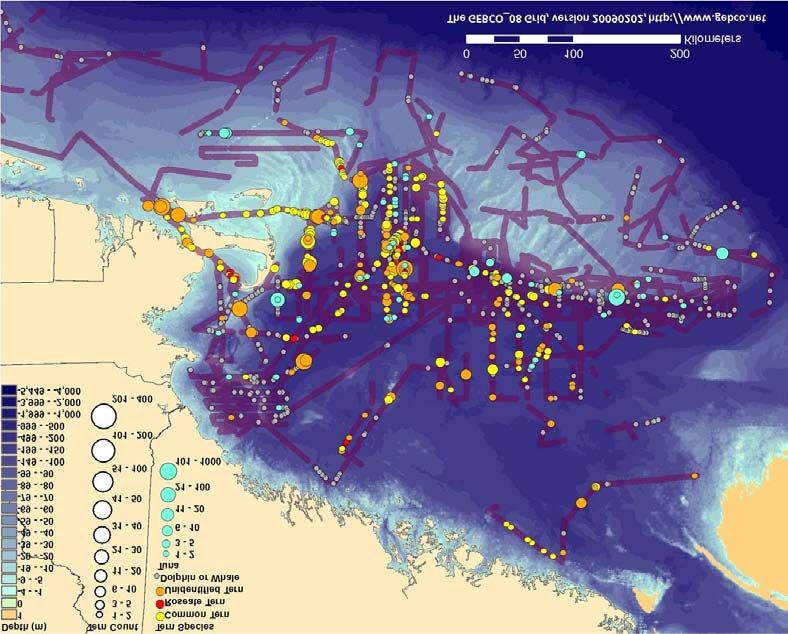
3.3 Case study 2: Spatial association between Northern gannets and fishing
vessels (Votier et al. 2010)
3.3.1 Background and aims
In common with many other seabirds, northern gannets exploit fisheries discards
extensively. However, it is not clear to what extent individual birds rely on discards,
and the interactions between birds and the main source of discards, highly mobile
trawlers, is poorly understood. One of the aims of this study was to use high-
precision tracking of seabirds and fishing vessels to quantify whether birds adjust
their behaviour in relation to the presence and activity of trawlers.
3.3.2 Technological and analytical approach
Breeding northern gannets were studied at a colony in Wales in 2006. 37 birds were
equipped with GPS loggers weighing 65 g (model GPSlog, earth & OCEAN Tech-
nologies, Kiel), and 32 of these were successfully recaptured. 23 complete foraging
trips were recorded, with location fixes every 3 minutes. Fishing vessel activity was
recorded using VMS (Vessel Monitoring System), which provides a high-resolution
location every 2 hours. Gannet foraging behaviour was quantified by calculating
track tortuosity and speed, and relationships with environmental covariates (includ-
ing long-term mean vessel density) were assessed using generalised linear mixed
models.ICES WGSE REPORT 2010 | 23
3.3.3 Main findings
Figure 3.2. Tracks of two gannets in the Celtic Sea showing derived ground speed and spatio-
temporal relationships with current fishing vessel activity. In the right-hand panels, grey symbols
indicate location of contemporaneous fishing vessels and green symbols indicate when the bird
was within 2 hours and 5 km of a vessel. The left-hand panels indicate derived ground speed.
Map courtesy of S.C. Votier, University of Plymouth.
Gannets foraged in the Celtic Sea SW of the colony, an area where fishing activity is
high. Foraging behaviour was affected by vessel presence: on the larger spatial scale
(>10 km), birds flew faster and more direct when vessels were nearby. On the smaller
scale, interactions were more variable, and some individuals seemed to react posi-24 | ICES WGSE REPORT 2010
tively to the presence of trawlers (Figure 3.2). Stable isotope analyses confirmed that
there was large inter-individual variation in the birds’ dependence on discards.
These various lines of evidence thus suggested that some individual northern gan-
nets rely heavily on fisheries discards during the breeding season, whereas others
feed exclusively on natural prey. This has implications for the management of dis-
carding activities in relation to seabirds, particularly if, as has been suggested, low-
quality individuals (i.e. those with a shorter lifespan and lower likelihood of success-
ful reproduction) consume more discards and less natural prey than high-quality in-
dividuals. The population-level impact of reducing discard availability may thus be
less than could be extrapolated from e.g. the mean proportion of discards in gannet
diet.
3.4 Case study 3: Mapping foraging and wintering areas of rare and
endangered species
Rare and endangered seabird species pose several difficult problems in relation to
conservation. One of them is that because of their rarity, there are very few observa-
tions of these species at sea and the foraging and wintering areas important for them
are very poorly known. Tracking studies offer what’s often the only solution to this
problem, although sample sizes tend to remain low. There are thus a number of very
recent cases where tracking has been applied to rare species in the North Atlantic
(within or outside ICES waters). Most of this work is not yet published, but with the
help of the respective researchers we here summarise preliminary results for two
such species, the ivory gull and the cahow or Bermuda petrel.
3.4.1 Ivory gull wintering areas (Gilg & Strøm unpublished)
The ivory gull is a rare and endangered species which breeds dispersed throughout
the circumpolar high Arctic (Gilg et al. 2009). Very little is known about its migration
and wintering areas, mainly because of its rarity, although it is thought to be closely
associated with the presence of sea ice throughout the annual cycle. There are con-
cerns that as the winter distribution of sea ice shrinks with increasing global tempera-
tures, ivory gulls may have trouble finding suitable wintering areas. Similarly,
distances between breeding sites and the summer ice edge are likely to increase, lead-
ing to increased foraging costs for ivory gulls.
In 2007 and 2008, breeding ivory gulls were tagged using satellite tags in NE
Greenland, Svalbard and Franz Josef Land. Maps showing raw locations of 15 Sval-
bard and Franz Josef Land birds are available at
http://ivorygull.npolar.no/ivorygull/en/index.html. Generally, transmitters provided
data for several months, in some cases until the next breeding season. While some
birds moved east into the Russian sector of the Arctic Ocean, most individuals
seemed to spend the winter around South Greenland and in the Labrador Sea. These
latter areas are among the most southerly where high sea ice concentrations occur,
and suitable wintering habitat for ivory gulls may not be available in the future in
this region.
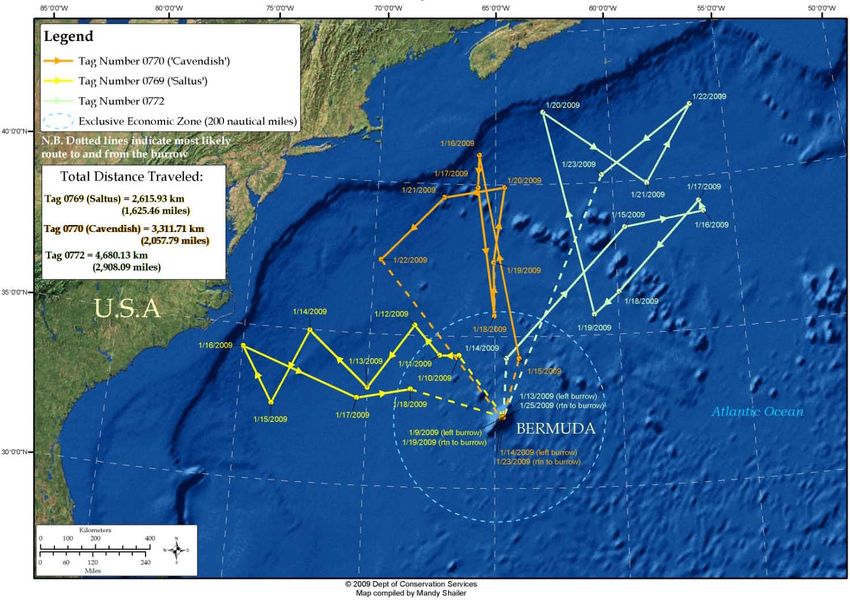
3.4.2 Cahow foraging areas during the breeding season (Madeiros & Carlile
unpublished)
The cahow provides another illustrative example. Thought to be extinct since the
early 1600s, cahows were rediscovered in the 1950s, nesting on tiny islets in Bermuda
Harbor. They have since increased to c. 200 birds through intensive management.
With such small numbers, they had never been observed at sea until about 1995, andICES WGSE REPORT 2010 | 25
to date, virtually all of the sightings have been made in a restricted area at the edge of
the Gulf Stream off Cape Hatteras, North Carolina.
In 2009, geolocators were deployed on 12 adult cahows, which were followed on for-
aging trips during the nesting season. The birds consistently travelled from Bermuda
to the North American continental slope, between North Carolina and Nova Scotia
(Figure 3.3, J. Madeiros & N. Carlile, unpublished). It seems these cephalopod spe-
cialists use the slope and the Gulf Stream boundary as a reliable source of their spe-
cialized prey. This tracking technology seems the only feasible way to determine the
critical habitat needs of a rare species such as this one.
Figure 3.3. Feeding trips of 3 female cahows during the post-egg laying period, January 2009. J.
Madeiros & N. Carlile, unpublished.
In general, tracking of individuals has a large potential as a tool for locating impor-
tant areas for rare species. It is highly likely that the use of this tool will expand in the
coming years, and the prospects for improving conservation efforts for these species
at sea are thus good.
3.5 New insights from tracking studies
3.5.1 Identification of previously unknown at-sea hot spots
As mentioned above, the area of the central North Atlantic used by the migrating
Arctic terns in late summer (Egevang et al. 2010) was not previously known to be of
importance to seabirds. This area is east and south-east of the Grand Banks of New-
foundland, towards the Mid-Atlantic Ridge (41–53° N, 27–41° W). However, otherYou can also read