Inactivation of Listeria and E. coli by Deep-UV LED: effect of substrate conditions on inactivation kinetics - Nature
←
→
Page content transcription
If your browser does not render page correctly, please read the page content below
www.nature.com/scientificreports

            OPEN           Inactivation of Listeria and E. coli by
                           Deep-UV LED: effect of substrate
                           conditions on inactivation kinetics
                           Yifan Cheng1,4, Hanyu Chen1,4, Luis Alberto Sánchez Basurto2, Vladimir V. Protasenko3,
                           Shyam Bharadwaj3, Moududul Islam3 & Carmen I. Moraru1*
                           Irradiation with deep-ultraviolet light-emitting diodes (DUV LEDs) is emerging as a low energy,
                           chemical-free approach to mitigate microbial contamination, but the effect of surface conditions on
                           treatment effectiveness is not well understood. Here, inactivation of L. innocua and E. coli ATCC25922,
                           as examples of Gram-positive and Gram-negative bacteria, respectively, by DUV LED of 280 nm
                           wavelength was studied. Surface scenarios commonly encountered in environmental, clinical or food
                           processing environments were used: nutrient rich surfaces, thin liquid films (TLF), and stainless steel
                           surfaces (SS). DUV LED exposure achieved 5-log reduction for both strains within 10 min in most
                           scenarios, except for TLF thicker than 0.6 mm. Inactivation kinetics in TLF and on dry SS followed the
                           Weibull model (0.96 ≤ R2 ≤ 0.99), but the model overestimated inactivation by small-dose DUV on
                           wet SS. Confocal microscopy revealed in situ that bacteria formed a dense outer layer at the liquid-air
                           interface of the liquid droplet, protecting the cells inside the droplet from the bactericidal DUV. This
                           resulted in lower than anticipated inactivation on wet SS at small DUV doses, and deviation from the
                           Weibull model. These findings can be used to design effective DUV LED disinfection strategies for
                           various surface conditions and applications.

                           Persistence of pathogens on material surfaces often causes severe consequences, including infections in den-
                           tal offices and hospitals1, or transfer of pathogenic or spoilage microorganisms from food contact surfaces to
                           food products in food processing facilities and food service environments2. Exposing surfaces contaminated by
                           microorganisms to ultraviolet (UV) of wavelength 100–280 nm has been established as an effective disinfection
                           method, often used as an alternative to or in tandem with chemical disinfection methods. Mercury lamps are
                           currently the most commonly used source of UV light. Yet, according to the Minamata Convention on Mercury3,
                           signed in 2013, manufacturing and trading of mercury-containing lamps for general lighting purposes will be dis-
                           allowed after 2020, to reduce and eliminate the adverse effects of mercury on human health and the environment.
                           This agreement accelerated the efforts for the development of alternatives to mercury lamps.
                               Light-emitting diodes that emit light in the UV range (UV LEDs) present several advantages compared to
                           mercury lamps, including the lack of toxic mercury, device compactness and flexible designs, zero warm-up
                           time4,5, high durability, monochromatic light emission at specific wavelength6, wavelength diversity, possibil-
                           ity of pulsed illumination, and the capability of maintaining relatively high activity at cold temperatures (e.g.
                           refrigeration)5. UV LEDs are also known for their low heat emission in the form of IR radiation7, which enables
                           applications that demand high UV fluence while preventing heating over long periods of time. Recent progress in
                           improving the light-extraction efficiency of UV LEDs in the range 200–300 nm has increased the external quan-
                           tum efficiency beyond 20%, approaching the 30–40% efficiency range of low-pressure UV lamps8.
                               This also resulted in increasing interest in substituting mercury lamps with UV LEDs for bacteria inactivation.
                           Successful applications of deep UV LEDs (DUV-LEDs), which emit light in the wavelength range 200–300 nm,
                           have recently emerged in the healthcare industry (e.g. disinfection of endoscopes, breathing circuits, and respi-
                           rators), agriculture (e.g. disinfection of irrigation and feed water), packaging plants (e.g. air disinfection), food
                           service (e.g. food contact surfaces disinfection), and homes (e.g. disinfection of cell phone surfaces and drinking
                           water).

                           1
                             Department of Food Science, Cornell University, Ithaca, NY, 14850, USA. 2Universidad Autónoma de Querétaro,
                           Santiago de Querétaro, Mexico. 3Electrical and Computer Engineering, Cornell University, Ithaca, NY, 14850, USA.
                           4
                            These authors contributed equally: Yifan Cheng and Hanyu Chen. *email: cim24@cornell.edu

Scientific Reports |   (2020) 10:3411 | https://doi.org/10.1038/s41598-020-60459-8                                                            1
www.nature.com/scientificreports/                                                               www.nature.com/scientificreports

                           Figure 1. Qualitative evaluation of DUV LED inactivation of E. coli and L. innocua on TSA agar plates, which
                           mimic nutrient-rich surfaces. (a) Schematic flow chart of the experimental steps. (b) Photos of the agar plates
                           after 24 h incubation, showing the differential growth patterns of bacteria streaks with and without exposure to
                           DUV LEDs. The agar area below the black dashed line was protected from exposure to DUV.

                                One limitation of using DUV LED as a bactericidal technology is the short penetration depth of UV light,
                           which impairs effectiveness in inactivating bacteria that reside deeper than the surface of solid or liquid media. To
                           mitigate this drawback, previous work on liquid disinfection via DUV adopted stirring5,9–11 or turbulent flow12,13,
                           to facilitate access of DUV to the target microorganisms. Notwithstanding its limited penetration depth, DUV
                           treatment is well-suited for disinfecting surfaces, either in dry conditions or in the presence of liquid droplets or
                           thin liquid films. Both scenarios are ubiquitous in environmental applications, the food industry and healthcare
                           industry, yet knowledge on the effectiveness of DUV LED inactivation kinetics of bacteria under such conditions
                           is limited.
                                Another important aspect that must be considered is the potential reactivation of UV-injured bacterial cells
                           post DUV LED treatment11, which could have tremendous safety implications, as it can diminish the overall
                           effectiveness of the treatment.
                                To address the current knowledge gaps in the area of bactericidal effectiveness of DUV LEDs, in the present
                           study the germicidal effectiveness and post-UV repair of bacterial cells treated with 280 nm wavelength DUV
                           LEDs was evaluated, for various substrate scenarios. A custom-made DUV LED treatment panel with a peak
                           emission wavelength at 280 nm was used, both because 280 nm has higher electrical efficiency than the UV wave-
                           length typically used for disinfection (e.g. 254 nm), and because it was shown to have higher germicidal efficiency
                           at the same energy expenditure, without excessive heat generation during the operation14. Escherichia coli ATCC
                           25922 and Listeria innocua were selected as challenge microorganisms because they are proven surrogates for
                           UV-based treatments for pathogenic E. coli O157:H712,15 and L. monocytogenes16, respectively.
                                The findings of this study provide insights into the kinetics and factors of influence for microbial inactivation
                           by DUV, which could be used to design effective and efficient DUV LED surface disinfection applications.

                           Results
                           Inactivation of bacteria streaked on nutritive agar. The qualitative results showed a significant reduc-
                           tion in the culturable population of E. coli and L. innocua cells on nutrient-rich surfaces exposed to DUV LED
                           treatments. A gradual decrease in viable bacterial cells was achieved within 1 min of DUV LED exposure for both
                           strains, as revealed by the gradual decrease in the density of colonies comprising the streaks after incubation
                           (Fig. 1b). After 3 min of continuous DUV LED exposure, no visible E. coli colonies were observed on the area not
                           covered by aluminum foil. Scattered L. innocua colonies were observed near the border between exposed and

Scientific Reports |   (2020) 10:3411 | https://doi.org/10.1038/s41598-020-60459-8                                                             2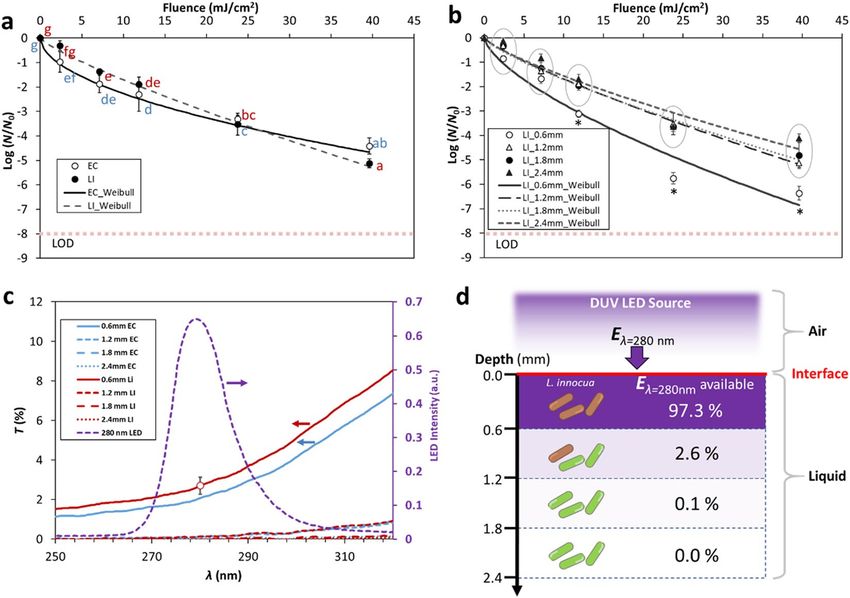
www.nature.com/scientificreports/                                                              www.nature.com/scientificreports

                           Figure 2. DUV LED inactivation kinetics of E. coli (EC) and L. innocua (LI) suspended in thin liquid films. (a)
                           Comparison between the inactivation kinetics of E. coli and L. innocua suspended in 1.2 mm thick BPB buffer.
                           Different letters denote significant differences (p < 0.05); inactivation data for EC (blue) and LI (red) were
                           analyzed together. Limit of detection (LOD) is denoted by a dotted line. (b) Inactivation kinetics of L. innocua
                           suspended in BPB buffer of various thickness. Asterisks denote data points that are significantly different from
                           the others at the same DUV exposure doses (p < 0.05), whereas circles denote clusters of data points that are
                           not significantly different (p > 0.05). (c) Transmittance (T%, left axis) of E. coli and L. innocua suspensions
                           of various thickness over the light spectrum emitted by the DUV LEDs (intensity, right axis). The horizontal
                           arrows point to the relevant axes for each of the curves. (d) Percentage of the incident 280 nm energy (Eλ=280)
                           available for inactivation at different depth segments of a L. innocua suspension. Error bars in (a), (b), and (c)
                           represent standard deviations.

                           covered areas, possibly due to partial blockage of DUV by the aluminum foil. After 5 min, no visible colonies were
                           found along the streaking traces on the exposed area, for either strain. On the areas covered with aluminum foil,
                           both strains grew into dense, continuous stripes along the streaking traces. Their growth was unaffected even for
                           the longest treatment time tested. It should also be noted that the 24-h incubation on nutrient-rich agar surfaces
                           at optimal growth temperature (37 °C) provided an ideal condition for post-UV reactivation of any damaged cells
                           to occur17, yet no reactivation was observed beyond 5 min of DUV exposure (11.88 mJ/cm2).

                           Inactivation of bacteria in thin liquid films of various thickness. For all TLF thicknesses tested, sur-
                           vivor counts decreased nonlinearly with increasing DUV dose emitted by the LEDs. The inactivation kinetics of
                           E. coli and L. innocua with TLF thickness of 1.2 mm were determined, which allowed a direct comparison of the
                           responses of the two strains to DUV. Figure 2a shows that overall there were no significant differences in inacti-
                           vation between the two strains (p > 0.05, Fig. 2a).
                               To explore the effect of TLF thickness on inactivation, L. innocua suspensions with thickness ranging from
                           0.6 mm to 2.4 mm were exposed to DUV. The inactivation curves indicate that DUV LED had a much higher effi-
                           ciency against L. innocua in the 0.6 mm liquid film than in the thicker TLFs, particularly at DUV fluence>11.88
                           mJ/cm2. For the TLFs with thickness above 1.2 mm, the inactivation curves largely overlapped (Fig. 2b) and no
                           significant differences in log reduction values were found (p > 0.05). This result was corroborated by the Weibull
                           model parameters (Table 1), since the scale and shape of the inactivation curves for cells suspended in 0.6 mm
                           thin film were significantly different from the rest (p < 0.05). To rule out the possible effect of water evaporation
                           from the TLF on the results, the percent weight loss due to evaporation was determined. For the 0.6 mm, 1.2 mm,
                           1.8 mm, and 2.4 mm films, the weight losses over 1200 s of DUV-LED exposure were 9.1%, 4.2%, 3.0%, and 2.0%,
                           respectively (Supplementary Fig. S2). This indicates that water evaporation was minor during the DUV LED
                           treatment, and drying can be excluded as a possible reason for cell death.
                               To better understand the effect of bacteria suspension thickness on DUV transmission, transmittance spectra
                           through E. coli and L. innocua suspensions were determined. Generally, the light transmission through the bac-
                           terial suspensions was smaller at shorter wavelengths. Figure 2c shows the light transmission of in the spectral
                           range of the DUV-LED source, and Supplementary Fig. S1 shows transmission over an expanded spectral range

Scientific Reports |   (2020) 10:3411 | https://doi.org/10.1038/s41598-020-60459-8                                                              3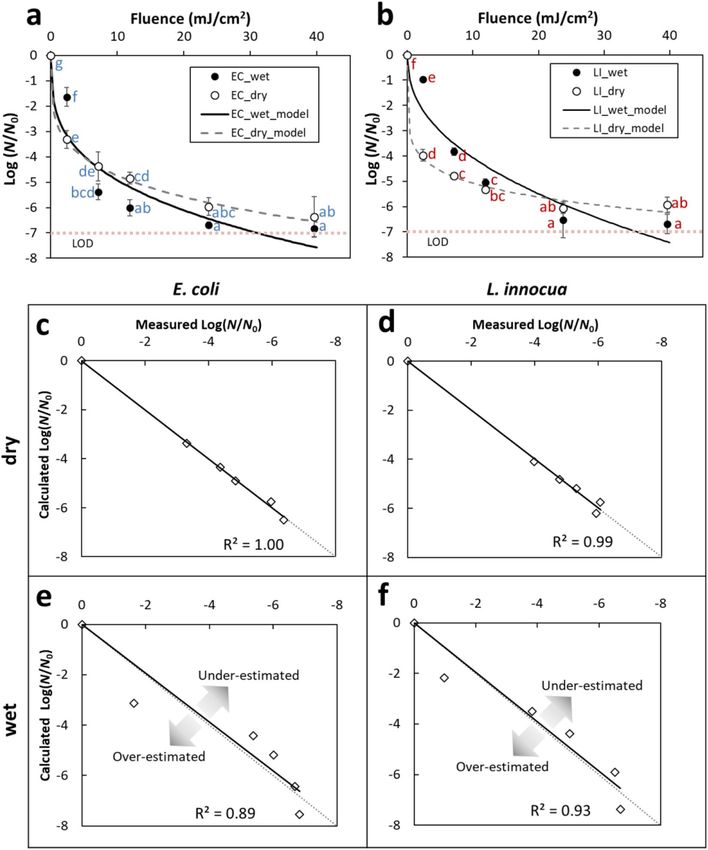
www.nature.com/scientificreports/                                                                 www.nature.com/scientificreports

                            Liquid Film
                            Thickness (mm) Scale Parameter α   Shape Parameter β   R2
                            0.6             −0.58 ± 0.05 a     0.67 ± 0.03 A       0.96
                            1.2             −0.26 ± 0.02 b     0.82 ± 0.04 B       0.99
                            1.8             −0.28 ± 0.04 b     0.78 ± 0.05 B       0.98
                            2.4             −0.26 ± 0.03 b     0.78 ± 0.03 B       0.98

                           Table 1. Weibull model parameters for the DUV LED inactivation kinetics of L. innocua suspended in liquid
                           film of various thickness.

                           (220 nm to 900 nm). In Fig. 2c, the emission spectrum of the LEDs used was superimposed onto the transmit-
                           tance spectra for direct comparison. Within the half width of the peak (i.e. 273 nm–288 nm), transmittance (T)
                           was lower than 4% at any given wavelength, even for the thinnest bacteria suspension (0.6 mm). T decreased
                           significantly with the increase in thickness, with T < 0.4% for the 1.2 mm suspension and T < 0.1% through the
                           1.8 mm and 2.4 mm suspensions.
                               The transmittance spectra provide insight into the availability of the bactericidal UV through the bacterial
                           cell suspensions. To schematically represent this, a liquid film was virtually compartmentalized into 0.6 mm thick
                           layers (Fig. 2d). In this representation, it was assumed that bacterial cells are uniformly distributed throughout
                           the thickness of the liquid film. This is a simplification, as aggregates of cells can occur at the air-liquid interface,
                           as it will be discussed later. For L. innocua suspensions, it was estimated that 2.7% of the incident 280 nm UV
                           energy (Eλ=280nm) is still available after passing through the first 0.6 mm of suspension, suggesting that 97.3%
                           of the energy is lost due to the absorption by the L. innocua cells and the BPB medium. The transmittance of
                           Eλ=280nm through BPB alone was estimated to account for absorption of only 0.4% of Eλ=280nm (Supplementary
                           Fig. S1), meaning that the L. innocua cells in the suspension were responsible for more than 99% of the Eλ=280nm
                           absorbed. A schematic of the decrease in the available bactericidal energy Eλ=280nm with increasing suspension
                           depth is represented in Fig. 2d.

                           Inactivation of bacteria on stainless steel surfaces under wet and dry conditions.                       The presence
                           of liquid droplets considerably reduced the level of inactivation for both E. coli (Fig. 3a) and L. innocua compared
                           to the inactivation on air-dried SS surfaces (Fig. 3b), especially within the first 60 s of exposure (2.38 mJ/cm2 flu-
                           ence). This effect was more pronounced for L. innocua. However, the inactivation curves on dry SS (dashed lines)
                           tend to reach a plateau earlier than on wet SS (solid lines), for both strains (Fig. 3a,b). This was also reflected in
                           the smaller values of the Weibull shape parameters, which are indicative of concave inactivation curves, for dry
                           compared to wet SS (Table 2). A crossover of the wet and dry inactivation curves occurred at a cumulative dose
                           of 7.13 mJ/cm2 (2 min treatment) for E. coli and at 22.18 mJ/cm2 (7 min treatment) for L. innocua, respectively.
                           Inactivation curves for both the wet and dry SS reached a plateau around 6–7 log reduction, after a cumulative
                           fluence >20 mJ/cm2 (~5 min exposure). The plateau inactivation values were not significantly different between
                           the wet and the dry conditions for either E. coli or L. innocua (p > 0.05).
                               The inactivation data was fitted using the Weibull model, and an excellent agreement between measured and
                           predicted Log(N/N0) values was obtained for the dry coupons for both strains, with R2 = 1.00 and 0.99 for E. coli
                           and L. innocua, respectively (Fig. 3a–d, Table 2). In case of the wet surfaces the Weibull model did overestimate
                           both the initial inactivation values (dose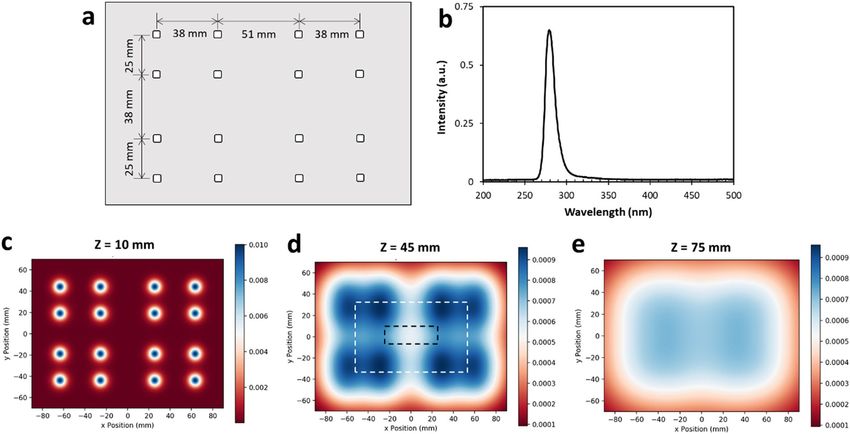
www.nature.com/scientificreports/                                                             www.nature.com/scientificreports

                           Figure 3. DUV LED inactivation kinetics of E. coli (a) and L. innocua (b) on SS coupons in the wet and the
                           dry condition. Error bars represent standard deviations. The limit of detection (LOD) of the assay is denoted
                           by dotted line. Different letters denote significant differences (ANOVA, p < 0.05) (data for the two strains was
                           analyzed separately). Fitted vs. measured plots for E. coli and L. innocua in the dry (c,d) and the wet condition
                           (e,f), highlighting the goodness-of-fit for each situation. Arrows in (e) and (f) suggest over- and under-
                           estimation by the Weibull model.

                                       Substrate    Scale            Shape
                            Bacteria   Conditions   Parameter α      Parameter β      R2
                            E. coli    Wet          −2.40 ± 0.18 b   0.31 ± 0.03 B    0.89
                            E. coli    Dry          −2.76 ± 0.47 b   0.23 ± 0.06 AB   1.00
                            L. innocua Wet          −1.50 ± 0.10 c   0.43 ± 0.03 C    0.92
                            L. innocua Dry          −3.61 ± 0.24 a   0.15 ± 0.03 A    0.99

                           Table 2. Weibull model kinetic parameters for the DUV LED inactivation of L. innocua and E. coli on stainless
                           steel metal coupons under wet and dry conditions.

Scientific Reports |   (2020) 10:3411 | https://doi.org/10.1038/s41598-020-60459-8                                                             5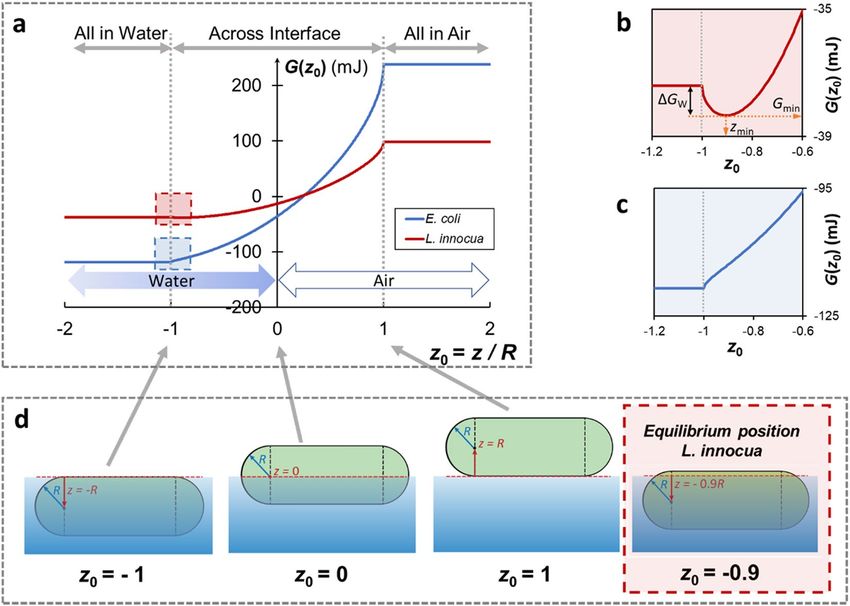
www.nature.com/scientificreports/                                                               www.nature.com/scientificreports

                           Figure 4. Distribution of untreated L. innocua and E. coli cells on SS coupons in the wet and the dry state
                           visualized using confocal microscopy. (a,c): a typical macroscopic view of the fluorescent bacterial cells in the
                           wet (a) and the dry (c) state. The insets are photos of the coupons in the respective states. (b) Cross-sectional
                           views of the top (corresponding to the yellow panel in (a)) and the side (blue panel) of typical bacteria-
                           containing droplets on SS coupons in the wet state. Black arrows denote the direction of observation. (d) Top-
                           down views (top panel) and side views (bottom panel) of typical pellets of bacteria on SS coupons in the dry
                           state.

                               The thickness (up to 500 µm) of the liquid droplets forms a sharp contrast with the flat morphology of the dry
                           bacteria pellets on SS surfaces, which are typically less than 20 µm thick (Fig. 4c). In the dry state scenario, both
                           E. coli and L. innocua cell lawns exhibit rather homogenous distribution within the horizontal plane (Fig. 4d, top
                           row) and dense packing in z direction (Fig. 4d, bottom row). The thickness of the bacteria pellet was estimated
                           to contain 10–20 cells in the z direction, which is similar to the outer shell of droplets at the liquid-air interface
                           in the wet scenario.

                           Bacteria distribution at the liquid-air interface: a thermodynamic model. To understand the driv-
                           ing forces behind the aggregation of both bacteria strains at the liquid-air interfaces, a thermodynamic model was
                           developed. The total surface energy (G) of the bacterium-water-air system was calculated as a function of a
                           dimensionless coordinate z 0, defined as the vertical coordinate of the center of the cell with regard to the water
                           level, z, normalized by its radius, R (Fig. 5). As the position of a bacterium cell changes from fully immersed in
                           water z0 ≤ −1, to partially immersed (−1 < z 0 < 1), to fully in air (z 0 ≥ 1), the total surface energy of the system
                           appears to increase for both strains, but this is more pronounced for E. coli (blue curve) than for L. innocua (red
                           curve) (Fig. 5a,d). The energy cost for an E. coli and L. innocua cell to move from the ‘all in water’ phase to ‘all in
                           air’ phase is 357 mJ and 136 mJ, respectively. A closer look at the energy curves where the bacterial cells are almost
                           fully submerged in water (dashed squares in Fig. 5a), reveals an energy well for L. innocua at z0 = −0.9R, corre-
                           sponding to an energy barrier (∆GW) of 0.93 mJ that a cell needs to overcome in order to fully immerse itself into
                           the bulk water phase (Fig. 5b). Thus, at equilibrium, most of an L. innocua cell is immersed in water, but the cell
                           remains interface-bound (Fig. 5d, red box). However, no energy well was found for E. coli cells anywhere on the
                           curve (Fig. 5c).

                           Effect of environmental conditions on post-UV cell repair.               To evaluate the potential repair of bac-
                           terial cells under environmental conditions representative of real-world applications, L. innocua on a SS coupon
                           was first exposed to the DUV LEDs, and subsequently subjected to various lighting and wetness conditions, and
                           bacterial counts were determined after each treatment. Due to the large variability of the reactivation results,
                           medians and interquartile range (depicted using a box-and-whisker plot) instead of means and standard devi-
                           ations were used to represent the data, in order to avoid overall results being skewed by a few extreme values

Scientific Reports |   (2020) 10:3411 | https://doi.org/10.1038/s41598-020-60459-8                                                              6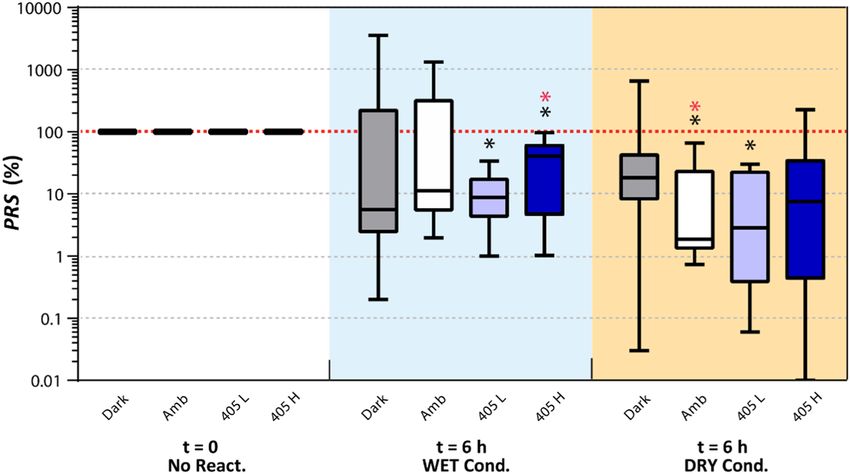
www.nature.com/scientificreports/                                                               www.nature.com/scientificreports

                           Figure 5. A thermodynamic model of bacterial distribution at the water-air interface. (a) System surface
                           energy, G, as a function of the relative position, z0, of an E. coli (EC, blue) or L. innocua cell (LI, red). z0 is
                           defined as the vertical coordinate of the center of the cell with regard to the water level, z, normalized by the
                           radius of the cell, R. (b) and (c): enlarged view of the energy curves at the ‘escape-to-water’ point (z0 = −1)
                           for L. innocua (red box) and E. coli (blue box), respectively. ∆Gw is the energy barrier a cell needs to overcome
                           to escape into the bulk water phase from the equilibrium position, zmin. (d) Schematic illustration of various
                           positions of a cell relative to the interface. The equilibrium position for L. innocua (z0 = −0.9) is highlighted by
                           the red dashed square.

                           (Fig. 6). The median post-reactivation survival ratio (PRS) of L. innocua population was below 100%, regardless
                           of the lighting and wetness conditions under which the reactivation process took place. It should be noted, how-
                           ever, that PRS > 100% did occur only rarely under certain reactivation conditions; more specifically: 3 out of the
                           11 biological replicates (i.e. 3/11) under the ‘Dark’-‘WET’ condition, 3/11 under ‘Amb’-‘WET’, 2/11 under ‘Dark’-
                           ‘DRY’, and 1/8 under ‘405 H’-‘DRY’. The ‘405 L’ was the only lighting condition that did not result in L. innocua
                           reactivation during the 6 h period in either the ‘WET’ (PRS range: 0.06–30%) or ‘DRY’ (1–34%) conditions. This
                           result is further substantiated by statistical analysis, which showed significantly lower PRS after reactivation under
                           ‘405 L’ than before (p < 0.05, Wilcoxon signed-rank test). The greatest variability in reactivation was observed
                           under the ‘Dark’-‘Wet’ conditions (PRS between 0.2–3556%). Because of the huge variability in data, no statisti-
                           cally significant differences among the medians from these eight reactivation conditions were found (p = 0.25,
                           Kruskal-Wallis rank sum test).

                           Discussion
                           DUV exposure is known to reduce microbial load on many fresh food products, including fruits, vegetables,
                           juices, water, other processed food products, and processing equipment surfaces18,19. In this study, 5 log reduction
                           of E. coli or L. innocua was achieved under a variety of surface conditions by exposure to DUV fluence between
                           1 to 10 mJ/cm2 (Figs. 1–3). These values are comparable to inactivation levels reported previously for aqueous
                           suspensions of bacteria of 6–7 mm thickness, under constant stirring9,10. However, the fluence to achieve this
                           level of inactivation was about 2 orders of magnitude higher than the fluence used to achieve similar inactivation
                           values on agar surface by Kim et al.14. This difference could be caused by both the higher accessibility to DUV of
                           the bacteria on the smooth agar surface, and the lower bacterial cell concentration used by Kim et al. compared
                           to the current study.
                               When treating TLFs under static conditions, much higher inactivation efficiency was observed for the thin-
                           ner TLFs than the thicker TLFs, at all fluence levels and for both microorganisms tested (Fig. 2b), which was
                           attributed to the significant attenuation of DUV irradiance by the thicker TLFs (Fig. 2d). Yet, despite the limited
                           penetration depth of DUV, up to 5 log reduction was achieved in the TLFs with thickness ≥1.2 mm (Fig. 2b). This
                           suggests that there may be a constant movement of bacterial cells, either by passive diffusion or by active flagella
                           propelled movement, which allows live cells to travel from the deep, low-exposure DUV zone into the ‘deadly’
                           high-exposure zone. This can explain the high level of bacterial death within the thick, highly light-absorbing
                           bacteria suspension.

Scientific Reports |   (2020) 10:3411 | https://doi.org/10.1038/s41598-020-60459-8                                                                7
www.nature.com/scientificreports/ www.nature.com/scientificreports
Figure 6. Box-and-whisker plot for post-reactivation survival (PRS) rate of L. innocua in the DRY and the
WET condition under various lighting conditions: dark, ambient light (‘Amb’), low-intensity 405 nm LED
(‘405 L’), and high-intensity 405 nm LED (‘405 H’). The line dividing each box into two parts represents the
median, the top and the bottom of the boxes represent upper and lower quartiles, and the upper and the lower
whiskers represent the max and the min values, respectively. Black asterisks denote significant difference in PRS
compared to ‘100%’ without adjusting for multiple comparison (p < 0.05); red asterisks denote significance after
adjusting for multiple comparison (padj < 0.05).
It has been previously reported that photoreactivation of DUV treated cells can occur after exposure to light
in 300–500 nm wavelength range, due to repair of the UV damaged DNA20. In this study, there was no evidence
of reactivation for cells exposed to 405 nm light post DUV exposure, under either DRY and WET conditions
(Fig. 6). It was previously reported that exposure to 280 nm UV LEDs significant repressed photoreactivation of E.
coli9,11. In the present study, although both dark and light repair were observed for L. innocua exposed to 280 nm
DUV LEDs, the treatment caused irreversible damage to the bacterial cells. The 280 nm wavelength represents the
peak absorbance for aromatic amino acids such as Tryptophan and Tyrosine21. This allows 280 nm DUV light to
be absorbed by proteins, which eventually induces a higher level of deterioration of membrane proteins compared
to shorter DUV wavelengths (i.e. the traditional germicidal 254 nm)11,14. In addition to DNA damage, 280 nm
light can inflict ROS-mediated damage on multiple key bacterial targets, including membrane lipid peroxidation
and respiratory enzyme activity22, physical membrane destruction14, and loss of membrane potential14. All these
lead to broad-target disruption and lower the likelihood of full restoration of all key cellular functions by light or
dark reactivation reactions.
Another important finding of this work is that E. coli and L. innocua cells spontaneously form a shell-like
structure at liquid-air interfaces that form when a droplet of bacterial suspension is deposited on a solid substrate
(Fig. 4b), whereas after the removal of the suspending liquid the bacterial population is distributed homogenously
onto the solid substrate (Fig. 4d, lower panels). These two distinct types of organization of bacterial commu-
nity, along with the low penetration depth of DUV in bacterial suspensions, as indicated by the sharp decline of
Eλ=280nm in Fig. 2d, inevitably result in the very different DUV irradiance distribution within a liquid droplet vs
a liquid-less bacterial pellet. These in turn lead to substantial differences in inactivation kinetics in the two states
for both E. coli (Fig. 3a) and L. innocua (Fig. 3b).
Both thermodynamic and bacterial mobility factors (e.g. flagella) may be responsible for the observed aggre-
gation of bacterial cells at the liquid-air interface. From a thermodynamic viewpoint, the positioning of the first
layer of L. innocua cells at the water-air interface can be explained by the energy well created across interfaces
(Fig. 5b, right panel). The phenomenon of solid particles aggregation at the water - air interface is well known
for hydrophobic abiotic microspheres in colloidal systems – phenomenon known as ‘Pickering Stabilization’23,24.
Hence, it is not surprising that bacterial cells, which have a size at the upper end of colloidal particles, also tend
to aggregate at liquid-air and liquid-liquid interfaces25,26, in an attempt to reduce the total energy of the system.
Figure 5b indicates that the energy required to overcome the energy barrier facing the water phase is many orders
of magnitude greater than kBT. Thus, it is extremely unlikely for cells to completely escape the water phase by
just Brownian motion. Interestingly however, the model suggests that there is no energy well for E. coli cells
near the water-air interface, and that it should be more energetically favorable for E. coli to remain in the water
phase. E. coli cells are more hydrophilic than L. innocua27,28, and thus should have a lower tendency to aggregate
at the interface than L. innocua29. Yet, the CLSM images obtained in this study show definite aggregation of the
E. coli cells at the interface (Fig. 5b, left panel), despite the lack of an energy well at the interface. This discrepancy
between the thermodynamic model prediction and the experimental result can be attributed to flagella-mediated
clustering. Both Hsu et al.28 and Peel et al.30 showed that flagella are expressed by E. coli cells but not L. innocua
grown at 37 °C. Chen et al.31 reported that actuated flagella can hydrodynamically induce bacterial aggregation
of Serratia marcescens: an inward, tangential fluid flow within a liquid-air interface, created by flagella-propelled
cells swimming toward the interface, can draw the neighboring cells in the interfacial plane together to form
Scientific Reports | (2020) 10:3411 | https://doi.org/10.1038/s41598-020-60459-8 8www.nature.com/scientificreports/ www.nature.com/scientificreports
dynamic clusters. This clustering effect can be further strengthened by the formation of transient intercellular
flagella bundles among adjacent cells32. Based on these prior studies it is reasonable to hypothesize that E. coli cells
may form flagella-mediated layers at the liquid-air interface, despite the absence of an interface-bound energy
well. Overall, our results imply that the formation bacterial layers at the water-air interface can be driven by
thermodynamics and/or bacterial surface appendages, and the relative contribution of these two factors could
vary greatly depending on the cells’ physicochemical properties (e.g. hydrophobicity) and physiology (e.g. expres-
sion of surface appendages). Future work is needed to investigate aggregation phenomena at various liquid-air
interfaces of a wide range of microbial species and strains that have been implicated in foodborne outbreaks and
nosocomial infections.
The deviation of inactivation kinetics on SS from the Weibull model under wet conditions, but not the dry
conditions, for which an extremely good fit of the model was obtained (Fig. 3c,d), is rather intriguing. The Weibull
model is well-suited for describing the inactivation kinetics of one bacterial population, with normally distributed
susceptibility to a given stimulus (e.g. DUV)33. In case of the wet SS coupons, the bacterial layers at the liquid-air
interface function as a protective shell, effectively reducing the intensity of DUV that is reaching the planktonic
bacteria inside the liquid droplet. The co-existence of a population of packed cells exposed to high DUV radiance,
and a population of planktonic cells exposed to a much lower level of DUV is likely the cause of the deviation of
the experimental results on wet SS coupons from the predictions by the Weibull model (Fig. 3e,f). It should be
noted that the agreement between the Weibull predictions and the results in TLFs is also very good (Table 1).
This study and previous studies prove the true potential of DUV LEDs for bacterial inactivation, both in
liquid and on solid substrates, and an exposure time of about 10 min is sufficient to achieve a 5-log reduction for
the bacteria and disinfection scenarios tested here. Microbial contamination and growth are most problematic
in certain hotspots where moisture and nutrients are readily accessible, and hence targeting DUV treatment at
these high-risk surfaces will be of highest practical advantage. These findings are based on work performed with a
single bacterial strains, so that the effects of substrate and environmental factors can be separated from biological
factors. To further validate these findings, future studies on microbial decontamination by DUV LEDs may con-
sider testing a broader range of challenge organisms and/or strain cocktails, so thatto also account for inter- and
intra-species variability34.
Conclusions
In this work, a proof-of-concept panel comprising an array of LEDs emitting DUV of 280 nm wavelength was
assembled, and its inactivation capability tested against surrogates for pathogenic E. coli and L. innocua, on sub-
strate types frequently encountered in environmental, clinical, and food processing and handling environments.
The tested DUV LEDs demonstrated very promising surface disinfection efficiency in all the scenarios tested,
with no detectable survivors for either strain after 5 min (or 11.9 mJ/cm2) treatment on nutrient-rich surfaces, and
5-log reduction within 10 min (or 23.8 mJ/cm2) on SS under both wet and dry conditions, and in TLFs of thick-
ness less than 0.6 mm. DUV inactivation of bacteria suspensions in liquid films thicker than 1.2 mm was much
slower, due to the low penetration depth of DUV through concentrated bacterial suspensions. Furthermore,
it was proven here that aggregation of bacterial cells at the liquid-air interface, driven by thermodynamic and
motility factors, shielded the cells inside of the liquid droplets from the bactericidal DUV, which slowed down the
initial stages of inactivation. Post DUV treatment exposure to low-intensity 405 nm lighting provided consistent
inhibition of reactivation.
This work also provides insights into how to select DUV LED treatment parameters in order to achieve effec-
tive and efficient surface disinfection, with broad implications on the disinfection of both biotic and abiotic sur-
faces. With the advent of robotics and computer vision technologies, it is now possible to design LEDs-integrated
robotics to deliver the appropriate level of DUV energy to contaminated, high-risk, surfaces, in a targeted man-
ner, which can become more energy efficient and sustainable than traditional DUV technology.
Materials and Methods
Bacterial cultures. Listeria innocua. FSL C2-008 (environmental isolate from a smoked fish plant) and
Escherichia coli ATCC 25922 (American Type Culture Collection, Manassas, VA) were stored in glycerol stock
solution at −80 °C prior to use. Culture reactivation was conducted by first streaking the frozen culture on
Trypticase Soy Agar (TSA; BD Difco, Franklin Lakes, NJ) and incubate (37 °C, 24 h) to obtain isolated colonies,
followed by loop-inoculation in 3 mL Tryptic Soy Broth (TSB; BD Difco, Franklin Lakes, NJ) for passage one
(37 °C, 24 h), and passing 30 µL of grown passage one culture to fresh 3 mL TSB for passage two (37 °C, 16 h). To
replace TSB with UV-transmitting phosphate buffer (Supplementary Fig. S1), the resulting early stationary phase
culture were centrifuged (5000 RPM, 10 min, 21 °C) and resuspended in sterile Butterfield Phosphate Buffer (BPB,
pH = 7.2). This wash step was repeated two more times to ensure minimal remnants of TSB in the final bacteria
suspension. The final concentration of bacteria suspended in the BPB was about 109 CFU/mL for both strains.
DUV LED treatment. A custom-made DUV LED chamber was used to perform all inactivation exper-
iments. The apparatus delivers DUV light via 16 individual DUV LEDs (SMD3535, TaoYuan Electron Ltd.,
Shenzhen, China) arranged as shown in Fig. 7a. These LEDs produce a monochromatic emission spectrum with
the peak at 280 nm (Fig. 7b). To determine an appropriate separation distance between the DUV LED panel and
target surfaces, spatial distribution of 280 nm irradiation maps at the target surfaces were simulated for separation
distances of 10 mm (Fig. 7c), 45 mm (Fig. 7d), and 75 mm (Fig. 7e). A separation distance of 45 mm was selected
for all DUV exposure experiments because it provided a good balance between the intensity of the irradiance and
the homogeneity of the distribution. At this distance, when the power source was operated under CV mode, with
the potential set to 5.30 V, resulting in a current of ~320 mA, the fluence rate below the middle of the panel was
40 µW/cm2.The entire apparatus was covered with aluminum foil to isolate the DUV treatment from any potential
Scientific Reports | (2020) 10:3411 | https://doi.org/10.1038/s41598-020-60459-8 9www.nature.com/scientificreports/ www.nature.com/scientificreports
Figure 7. The custom-made DUV LED panel and its performance characteristics. (a) Arrangement of DUV
LEDs on the panel. (b) Typical emission spectrum of the DUV LEDs. (c–e) Simulation of the distribution of
DUV energy received by a flat surface located at 10 mm, 45 mm, 75 mm away from the light source, respectively.
A larger intensity scale was used for (c) than (d) and (e), to capture the details of the distribution. The dashed-
line rectangles illustrate the position of a liquid chamber or a SS coupon, respectively, in the DUV energy field.
disturbance by ambient light. Meanwhile, as a safety precaution, the aluminum foil blocked the UV light from
human operators during the treatment. Additionally, on rare occasions when direct observation of the operat-
ing DUV LEDs was necessary, the operators were required to ware UV protection safety goggles. The following
treatment durations were chosen to deliver different UV doses: 60 s, 180 s, 300 s, 600 s, 1000 s, corresponding to
cumulative UV fluence of 2.38 mJ/cm2, 7.13 mJ/cm2, 11.88 mJ/cm2, 23.76 mJ/cm2, and 39.60 mJ/cm2.
Bacteria Inactivation by DUV LED on various substrates. Nutritive agar plate treatments. Both the
E. coli and L. innocua cultures were streaked in two parallel lines on TSA plates of 100 mm in diameter. Half
of each plate was covered with aluminum foil, to divide the surface of the plate and the bacterial streaks into a
‘Exposed’ section and a ‘Covered’ section (Fig. 1a), followed by exposure to DUV for a specified duration (10 s
to 25 min). After DUV treatment, the plates were incubated at 37 °C for 24 h for qualitative evaluation of bacteria
inactivation.
Thin liquid films (TLF) treatments. Liquid chambers (Lab-Tek II Chamber Slide chamber, 17 mm × 48 mm;
Fisher Scientific, Rochester, NY) were used to hold E. coli or L. innocua suspensions in the form of TLFs to mimic
contaminated standing water. Before the experiment, the liquid chambers were decontaminated by soaking in
70% ethyl alcohol (Fisher Scientific, Rochester, NY) for 24 h, followed by drying in a biosafety cabinet for 2 h to
evaporate the remaining ethyl alcohol. After that, bacteria suspensions were pipetted into the liquid chambers
and allowed to equilibrate for 3 min before starting the DUV exposure. The effect of strains on DUV inactivation
kinetics was investigated by exposing 1 mL of liquid film (thickness = 1.2 mm) containing either L. innocua or E.
coli, for the durations specified previously. To determine the effect of thin film thickness on inactivation kinetics,
0.5 mL, 1 mL, 1.5 mL, and 2 mL of L. innocua suspension was aliquoted into a liquid chamber, resulting in liquid
film thickness of 0.6 mm, 1.2 mm, 1.8 mm, and 2.4 mm, respectively, followed by 3-min equilibration and subse-
quent DUV LED treatment for various durations. Due to the concave meniscus exhibited by the liquid films at the
liquid chamber walls, the average thickness of the bacteria containing liquid films was calculated by dividing the
volume of bacteria suspension by the bottom area of the liquid chamber instead of being measured directly. The
bacteria suspension from both UV-treated and non-treated control samples were serially diluted with BPB and
enumerated using standard plate counting method on TSA agar. Total bacteria reduction was calculated using
the following equation:
N
Log Reduction = Log10
N (1)
0
where N0 and N are the bacteria counts (in colony forming units per mL of suspension, CFU/mL) before and
after DUV treatment, respectively. The detection limit of the inactivation experiments in TLF is 10 cells per mL of
bacteria suspension, for both E. coli and L. innocua.
Scientific Reports | (2020) 10:3411 | https://doi.org/10.1038/s41598-020-60459-8 10www.nature.com/scientificreports/ www.nature.com/scientificreports
All DUV LED treatments were performed in triplicate, with independently grown bacterial cultures used in
each replicate.
Transmittance spectra of DUV through TLFs of thickness of 0.6 mm, 1.2 mm, 1.8 mm, and 2.4 mm were deter-
mined using an HR2000CG-UV-NIR spectrometer equipped with a DH-2000-BAL UV-VIS-NIR light source
(Ocean Optics Inc, Largo, FL, USA). Briefly, E. coli and L. innocua suspensions (prepared as described above)
were aliquoted into a space of desired thickness, as specified above, which was created by inserting polyethylene
spacers between two clean DUV transmitting fused quartz slides (Grade GE124, Technical Glass Products, WA,
USA), placed horizontally on a metal stand. The optical fiber outlet (connected to light emitter) and the receiver
inlet (connected to the detector) were perpendicularly affixed to the top and bottom quartz slide, respectively.
An illustration of the setup is shown in Supplementary Fig. S3. The volume of the suspensions was adjusted to
ensure that it covered the entire cross-section of the beam emitted by the fiber outlet (about 4 cm2 surface area).
All transmittance measurements were taken immediately after the suspensions were aliquoted, to minimize the
potential interference by bacterial attachment onto the slides. Technical duplicates were performed on each sam-
ple to account for potential variation caused by the positioning of the suspension with respect to the beam.
Stainless-steel coupon treatments. Food-grade SS coupons (50 mm × 100 mm) with a glass bead blasted finish
(Ra = 0.78 µm) were used to simulate polished SS surfaces commonly encountered in food handling and medical
environments35. To remove any surface chemical contaminants, the SS coupons were sequentially submerged in
a rotating bath (100 RPM) of 95% acetone (Fisher Scientific, Rochester, NY), 95% ethyl alcohol and deionized
water, for 10 min at each step. The coupons were then autoclaved (15 min, 121 °C) in individually sealed steriliza-
tion pouches to kill any potential microbial contaminants. The SS coupons prepared as described here exhibited
a mean water contact angle of 62.2 ± 3.3°, as determined by a static sessile drop method with a Rame-Hart 500
goniometer (Rame-Hart Inc., Succasunna, NJ, USA).
For inoculation, a total of 1 mL bacteria suspension was deposited on the SS surfaces as 20 evenly spaced drop-
lets of 50 µL each. The inoculated coupons were then divided into two treatment groups, as follows: 1) for the wet
condition, inoculated coupons were left to equilibrate in the laminar flow hood (23 °C, relative humidity = 17%)
for 3 min; 2) for the dry condition, the inoculated coupons were left to dry under the hood for about 3 h, until they
reached a constant weight, without excessive drying (Supplementary Fig. S4).
The SS coupons prepared as described above were subjected to DUV LED treatments, as described in section
2.3.1, after which they were individually placed in sterile Whirl-Pak bags with 100 mL BPB and sonicated for
5 min at 40 kHz (Branson 1210 Ultrasonic Cleaner, Branson Ultrasonics, Danbury, CT). This method of recovery
was used since Bjerkan et al.36 showed that ultrasonication (>20 kHz) for 5 min achieved the highest recovery of
bacteria from metal plates compared to other commonly used methods such as manual scraping. Preliminary
experiments conducted as part of the present study also showed no effect of ultrasonication for 5 min on bacte-
rial viability (data not shown). After sonication, the BPB that contained recovered cells was subjected to serial
ten-fold dilutions with sterile BPB, spread plating on TSA plates, and enumeration of CFUs after incubation at
37 °C for 24 h. The control followed the same recovery and enumeration procedures except for the DUV LED
treatment. The detection limit of the inactivation experiments on SS surfaces was 100 cells per SS coupon (50 cm2)
for both E. coli and L. innocua. Inactivation effectiveness, expressed in Log reduction, was determined using Eq. 1.
All DUV LED treatments were performed in triplicate, with independently grown bacterial cultures.
Reactivation of DUV treated bacteria. To evaluate potential reactivation of DUV treated bacteria under
conditions mimicking real-world applications, L. innocua was spot-inoculated onto the SS coupons, exposed to
DUV under the wet condition for 600 s (or 23.76 mJ/cm2), and then subjected to a 6-h reactivation step under
four different lighting conditions: (1) Dark; (2) white ambient light (60 W, GreybaR Electrics, Philadelphia, PA),
labeled ‘Amb’; (3) low luminance flux (260–290 µW/cm2) and (4) high luminance flux (490–610 µW/cm2) 405 nm
LEDs (Vital Vio, Troy, NY), labeled ‘405 L’ and ‘405 H’, respectively. A 6-h reactivation period was used because
previous studies showed that the post-UV bacterial reactivation plateaus around this time9. Reactivation under
each lighting condition was also tested under the ‘DRY’ or the ‘WET’ condition (‘DRY’ and ‘WET’ were capital-
ized to be differentiated from the dry and the wet conditions used in the kinetics study). For reactivation under
‘DRY’ conditions, the DUV treated bacterial inoculum was allowed to dry on the SS coupons in a laminar flow
hood for 6 h, followed by the same recovery and enumeration steps described in 2.3.
For the ‘WET’ condition, the UV-treated bacteria on the SS coupons were first transferred into BPB following
the same procedures as for recovery. To conduct the ‘Dark’ reactivation under the ‘WET’ condition, 1 mL of the
resulting suspension was added to opaque 1.5 mL Eppendorf tubes (Eppendorf Flex-Tubes, Hauppauge, NY). To
conduct the ‘Amb’, ‘405 L, and ‘405 H’ reactivation, 1 mL of the suspension was added to a custom-made chamber
covered with an UV-transmitting quartz window lid, and all sides sealed with Parafilm to prevent evaporation of
the liquid during reactivation. All ‘WET’ samples were kept at 21 °C for 6 h under the specified lighting conditions
before enumeration.
For each of the 8 reactivation conditions tested (2 wetness conditions × 4 lighting conditions), the bacterial
concentration at the end of the UV treatment (NUV) and post-reactivation (NPR) were determined by standard
plate counting on TSA plates after incubation for 24 h at 37 °C. The percent post-reactivation survival ratio (PRS)
for each individual biological replicate was calculated using the equation:
N
PRS = PR ⋅ 100%
N (2)
UV
Scientific Reports | (2020) 10:3411 | https://doi.org/10.1038/s41598-020-60459-8 11www.nature.com/scientificreports/ www.nature.com/scientificreports
PRS greater than 100% represents an increase in survivor counts due to reactivation of injured cells, while PRS
equal to or less than 100% represents no change, or a further decrease in counts during the resuscitation process.
To account for potential genetic diversity within the strain, a larger number of biological replicates (6 ≤ n ≤ 11)
were included than in the previous experiments, in order to acquire representative, unbiased reactivation results.
Modelling of inactivation kinetics. Microbial inactivation by DUV LED was modelled by the Weibull
model37:
log10(N /N0) = αt β (3)
where N /N0 represents the ratio of survivors after treatment (N) over the initial population (N0), α is the scale
parameter and β is the shape factor. The non-linear regression was performed using the statistical software R (R
Foundation for Statistical Computing, version 1.1.463).
Confocal laser scanning microscopy (CLSM) imaging. The distribution of E. coli and L. innocua
cells within liquid droplets and dried pellets on the SS coupons was visualized using a Zeiss LSM 710 equipped
with inverted immersion objectives (Carl Zeiss, Jena, Germany), as described elsewhere27,38. Briefly, to image a
bacteria-containing liquid droplet, 5 µL bacteria-BPB suspension (prepared as described above), stained with
a LIVE/DEAD BacLight fluorescent dye (Thermo Fisher Scientific, Waltham, MA, USA), was aliquoted onto
the glass bottom of a confocal-compatible dish (Mat-Tek Corporation, Ashland, MA, USA). The scanning pro-
cess was performed in situ, with minimal mechanical disturbance on bacterial movement and distribution.
Apochromat 10 × and 40 × water immersion objective lenses were used for capturing the overall distribution
and the details at the liquid-air interfaces, respectively. The Z-scan mode was deployed to capture the cell distri-
butions in the three-dimensional space.
To image a dried bacteria pellet, 50 µL of bacterial suspension was aliquoted onto a smaller version (1 in ×
2 in) of the SS coupon used in the inactivation experiments, followed by drying for 3 h. After drying, diluted fluo-
rescent dye (5 µL in 3 mL BPB) was pipetted onto the dry bacteria pellet, incubated for 20 min in the dark at 21 °C,
and the unbound dye was rinsed off gently with a 0.15 M NaCl solution. Next, the SS coupon was inverted and
placed on the glass bottom of the dish, with the pellet side facing downward and immersed in BacLight mounting
oil. Z-scans were performed throughout the entire thickness of the pellet.
Considering that sample preparation procedures for confocal microscopy could result in biased conclusions
on bacterial viability, only the signal from the green fluorescent channel, which accounts for all cells, regardless of
their viability, was shown and discussed in the paper.
Thermodynamic modelling of bacterial cell distribution at the liquid-air interfaces. A ther-
modynamic model was developed to predict the distribution of bacteria at the liquid-air interface. For accu-
rate representation of the morphology of the E. coli and L. innocua cells, bacterial cells were modeled as
hemisphere-capped cylindrical rods. Neither bacterial appendages, nor active cellular motions were included in
this model, and their roles will be discussed separately. Only the bacteria that oriented parallel to the interface
were considered because it was previously shown that this orientation is thermodynamically favored and there-
fore most likely to be adopted by the cells at equilibrium39.
The total surface energy of the system, G, which comprises the surface energy contributed by the rod-shaped
bacterial cells (subscript ‘b’), air (subscript ‘a’), and water (subscript ‘w’) – was derived as a function of a dimen-
sionless coordinate, z0:
G(z 0) = Gcap(z 0) + Gcyl(z 0) (4)
Gcap(z 0) = 2πR2γbw(1 + z 0) + 2πR2γba(1 − z 0) − πR2γaw(1 − z 02) (4a)
Gcyl(z 0) = [2π − 2cos−1( − z 0)]R(l − 2R)γbw + 2cos−1( − z 0)R(l − 2R) γba − 2R 1 − z 02 (l − 2R)γwa (4b)
where Gcap and Gcyl are the surface energy contributions from the hemispherical caps and the cylinder connecting
the two caps; γbw , γba, and γaw are interfacial energy between bacteria and water, bacteria and air, and water and
air, respectively; z 0 is the vertical coordinate of the center of the bacterial cell in relation to the water level, z ,
normalized by the radius of the cell, R; l is the length of the cell. The values of γbw , γba, and γaw were calculated
from the contact angles of three probe liquids on bacterial cell lawns, as described elsewhere27,40. The contact
angle values and bacterial cellular dimensions used in the model are summarized in Supplementary Table S1.
Statistical analysis. Analysis of variance and post hoc Tukey’s HSD were used to compare experimental
and Weibull calculated inactivation data. Non-parametric statistics were used to analyze the reactivation results
because PRS data did not follow a Gaussian distribution. Specifically, the Kruskal-Wallis rank sum test was used
to compare the PRS from the eight reactivation conditions and the Wilcoxon signed-rank test (two-sided) was
used to evaluate the significance of the change in PRS before and after reactivation under each of the eight con-
ditions. The False Discovery Rate method was used to determine the adjusted p-value for multiple comparisons
(n = 8). A confidence level of 95% is adopted for all statistical tests. All statistical tests were performed using the
statistical software R (version 1.1.463).
Scientific Reports | (2020) 10:3411 | https://doi.org/10.1038/s41598-020-60459-8 12www.nature.com/scientificreports/ www.nature.com/scientificreports
Data availability
The data sets generated and analyzed during the current study are available from the corresponding author on
reasonable request.
Received: 5 November 2019; Accepted: 10 February 2020;
Published: xx xx xxxx
References
1. Donlan, R. M. & Costerton, J. W. Biofilms: survival mechanisms of clinically relevant microogranisms. Clin. Microbiol. Rev. 15,
167–193 (2002).
2. Chmielewski, R. A. N. & Frank, J. F. Biofilm formation and control in food processing facilities. Compr. Rev. Food Sci. Food Saf. 2,
22–32 (2003).
3. Minamata Convention on Mercury. Available at: http://www.mercuryconvention.org/. (Accessed: 28th March 2019)
4. Chatterley, C. & Linden, K. Demonstration and evaluation of germicidal UV-LEDs for point-of-use water disinfection. J. Water
Health 8, 479–486 (2010).
5. Shin, J., Kim, S., Kim, D. & Kang, D. Fundamental characteristics of Deep-UV light-emitting diodes and their application to control
foodborne pathogens. Appl. Environ. Microbiol. 82, 2–10 (2016).
6. Kim, S., Kim, D. & Kang, D. Using UVC light-emitting diodes at wavelengths of 266 to 279 nanometers to inactivate foodborne
pathogens and pasteurize sliced cheese. Appl. Environ. Microbiol. 82, 11–17 (2016).
7. D’Souza, C., Yuk, H. G., Khoo, G. H. & Zhou, W. Application of light-emitting diodes in food production, postharvest preservation,
and microbiological food safety. Compr. Rev. Food Sci. Food Saf. 14, 719–740 (2015).
8. Takayoshi, T. et al. Deep-ultraviolet light-emitting diodes with external quantum efficiency higher than 20% at 275 nm achieved by
improving light-extraction efficiency. Appl. Phys. Express 10, 31002 (2017).
9. Nyangaresi, P. et al. Effects of single and combined UV-LEDs on inactivation and subsequent reactivation of E. coli in water
disinfection. Water Res. 147, 331–341 (2018).
10. Rattanakul, S. & Oguma, K. Inactivation kinetics and efficiencies of UV-LEDs against Pseudomonas aeruginosa, Legionella
pneumophila, and surrogate microorganisms. Water Res. 130, 31–37 (2018).
11. Li, G. Q., Wang, W. L., Huo, Z. Y., Lu, Y. & Hu, H. Y. Comparison of UV-LED and low pressure UV for water disinfection:
Photoreactivation and dark repair of Escherichia coli. Water Res. 126, 134–143 (2017).
12. Sauer, A. & Moraru, C. I. Inactivation of Escherichia coli ATCC 25922 and Escherichia coli O157:H7 in apple juice and apple cider,
using pulsed light treatment. J. Food Prot. 72, 937–944 (2009).
13. Koutchma, T., Keller, S., Chirtel, S. & Parisi, B. Ultraviolet disinfection of juice products in laminar and turbulent flow reactors.
Innov. Food Sci. Emerg. Technol. 5, 179–189 (2004).
14. Kim, D. K., Kim, S. J. & Kang, D. H. Bactericidal effect of 266 to 279 nm wavelength UVC-LEDs for inactivation of Gram positive
and Gram negative foodborne pathogenic bacteria and yeasts. Food Res. Int. 97, 280–287 (2017).
15. Hu, M. & Gurtler, J. B. Selection of surrogate bacteria for use in food safety challenge studies: A review. J. Food Prot. 80, 1506–1536
(2017).
16. Uesugi, A. R. & Moraru, C. I. Reduction of listeria on ready-to-eat sausages after exposure to a combination of pulsed light and nisin.
J. Food Prot. 72, 347–353 (2009).
17. Wu, V. C. H. A review of microbial injury and recovery methods in food. Food Microbiol. 25, 735–744 (2008).
18. Akgün, M. P. & Ünlütürk, S. Effects of ultraviolet light emitting diodes (LEDs) on microbial and enzyme inactivation of apple juice.
Int. J. Food Microbiol. 260, 65–74 (2017).
19. Sommers, C. H., Cooke, P. H., Fan, X. & Sites, J. E. Ultraviolet light (254 nm) inactivation of Listeria monocytogenes on frankfurters
that contain potassium lactate and sodium diacetate. J. Food Sci. 74, 114–119 (2009).
20. Harris, G. D., Adams, V. D., Sorensen, D. L. & Curtis, M. S. Ultraviolet inactivation of selected bacteria and viruses with
photoreactivation of the bacteria. Water Res. 21, 687–692 (1987).
21. Pace, N. C., Vajdos, F., Fee, L., Grimsley, G. & Gray, T. How to measure and predict the molar absorption coefficient of a protein.
Prorein Sci. 4, 2411–2423 (1995).
22. Kim, D. & Dong-hyun, K. Elevated inactivation efficacy of a pulsed uvc light-emitting diode system for foodborne pathogens on
selective media and food surfaces. Food Microbiol. 84, 1–14 (2018).
23. Pickering, S. Emulsions. J. Chem. Soc. Trans. 91, 2001–2021 (1907).
24. Pieranski, P. Two-dimensional interfacial colloidal crystals. Phys. Rev. Lett. 45, 569–572 (1980).
25. Hejazi, A. & Falkiner, F. R. Serratia marcescens. J. Med. Microbiol. 46, 903–912 (1997).
26. Rabani, A., Ariel, G. & Be’er, A. Collective motion of spherical bacteria. PLoS One 8, 1–8 (2013).
27. Feng, G. et al. Alumina surfaces with nanoscale topography reduce attachment and biofilm formation by Escherichia coli and Listeria
spp. Biofouling 30, 1253–1268 (2014).
28. Hsu, L., Fang, J., Borca-Tasciuc, D., Worobo, R. & Moraru, C. I. The effect of micro- and nanoscale topography on the adhesion of
bacterial cells to solid surfaces. Appl. Environ. Microbiol. https://doi.org/10.1128/AEM.03436-12 (2013)
29. Schäfer, A., Harms, H. & Zehnder, A. J. B. Bacterial accumulation at the air-water interface. Environ. Sci. Technol. 32, 3704–3712
(1998).
30. Peel, M., Donachie, W. & Shaw, A. Temperature-dependent expression of flagella of Listeria monocytogenes studied by electron
microscopy, SDS-PAGE and Western blotting. J. Gen. Microbiol. 134, 2171–2178 (1988).
31. Chen, X., Yang, X., Yang, M. & Zhang, H. P. Dynamic clustering in suspension of motile bacteria. Epl 111, (2015).
32. Copeland, M. F., Flickinger, S. T., Tuson, H. H. & Weibel, D. B. Studying the dynamics of flagella in multicellular communities of
Escherichia coli by using biarsenical dyes. Appl. Environ. Microbiol. 76, 1241–1250 (2010).
33. Peleg, M. & Cole, M. B. Reinterpretation of microbial survival curves. Crit. Rev. Food Sci. Nutr. 38, 353–380 (1998).
34. NACMCF Executive Secretariat. Parameters for determining inoculated pack/challenge study protocols. J. Food Prot. 73, 140–202
(2009).
35. Woodling, S. E. & Moraru, C. I. Influence of surface topography on the effectiveness of pulsed light treatment for the inactivation of
Listeria innocua on stainless-steel surfaces. J Food Sci 70, m345–m351 (2005).
36. Bjerkan, G., Witso, E. & Bergh, K. Sonication is superior to scraping for retrieval of bacteria in biofilm on titanium and steel surfaces
in vitro. Acta Orthop. 80, 245–250 (2009).
37. Uesugi, A. R., Woodling, S. E. & Moraru, C. I. Inactivation kinetics and factors of variability in the pulsed light treatment of Listeria
innocua cells. J. Food Prot. 70, 2518–2525 (2007).
38. Cheng, Y. & Moraru, C. I. Long-range interactions keep bacterial cells from liquid-solid interfaces: Evidence of a bacteria exclusion
zone near Nafion surfaces and possible implications for bacterial attachment. Colloids Surfaces B Biointerfaces 162, 16–24 (2018).
39. Ballard, N. & Bon, S. A. F. Equilibrium orientations of non-spherical and chemically anisotropic particles at liquid-liquid interfaces
and the effect on emulsion stability. J. Colloid Interface Sci. 448, 533–544 (2015).
40. van Oss, C. J. Acid-base interfacial interactions in aqueous media. Colloids Surfaces A Physicochem. Eng. Asp. 78, 1–49 (1993).
Scientific Reports | (2020) 10:3411 | https://doi.org/10.1038/s41598-020-60459-8 13You can also read