Increased theta/alpha synchrony in the habenula-prefrontal network with negative emotional stimuli in human patients
←
→
Page content transcription
If your browser does not render page correctly, please read the page content below
RESEARCH ARTICLE

                                   Increased theta/alpha synchrony in the
                                   habenula-prefrontal network with
                                   negative emotional stimuli in human
                                   patients
                                   Yongzhi Huang1,2†, Bomin Sun3†, Jean Debarros4, Chao Zhang3, Shikun Zhan3,
                                   Dianyou Li3, Chencheng Zhang3, Tao Wang3, Peng Huang3, Yijie Lai3,
                                   Peter Brown4, Chunyan Cao3*, Huiling Tan4*
                                   1
                                    Academy of Medical Engineering and Translational Medicine, Tianjin University,
                                   Tianjin, China; 2Nuffield Department of Surgical Sciences, University of Oxford,
                                   Oxford, United Kingdom; 3Department of Neurosurgery, Affiliated Ruijin Hospital,
                                   Shanghai Jiao Tong University School of Medicine, Shanghai, China; 4Medical
                                   Research Council (MRC) Brain Network Dynamics Unit at the University of Oxford,
                                   Nuffield Department of Clinical Neurosciences, University of Oxford, Oxford,
                                   United Kingdom

                                   Abstract Lateral habenula is believed to encode negative motivational stimuli and plays key
                                   roles in the pathophysiology of psychiatric disorders. However, how habenula activities are
                                   modulated during the processing of emotional information is still poorly understood. We recorded
                                   local field potentials from bilateral habenula areas with simultaneous cortical
                                   magnetoencephalography in nine patients with psychiatric disorders during an emotional picture-
*For correspondence:               viewing task. Transient activity in the theta/alpha band (5–10 Hz) within the habenula and prefrontal
ccy40646@rjh.com.cn (CC);          cortical regions, as well as the coupling between these structures, is increased during the
huiling.tan@ndcn.ox.ac.uk (HT)     perception and processing of negative emotional stimuli compared to positive emotional stimuli.
†
 These authors contributed         The increase in theta/alpha band synchronization in the frontal cortex-habenula network correlated
equally to this work               with the emotional valence but not the arousal score of the stimuli. These results provide direct
                                   evidence for increased theta/alpha synchrony within the habenula area and prefrontal cortex-
Competing interests: The
                                   habenula network in the perception of negative emotion in human participants.
authors declare that no
competing interests exist.
Funding: See page 16
Received: 04 December 2020         Introduction
Accepted: 28 June 2021             The habenula is an epithalamic structure that functionally links the forebrain with the midbrain struc-
Published: 12 July 2021            tures that are involved in the release of dopamine (i.e., the substantia nigra pars compacta and the
                                   ventral tegmental area) and serotonin (i.e., raphe nucleus) (Wang and Aghajanian, 1977;
Reviewing editor: Ole Jensen,
University of Birmingham, United
                                   Herkenham and Nauta, 1979; Hikosaka et al., 2008; Hong et al., 2011; Proulx et al., 2014;
Kingdom                            Hu et al., 2020). As a region that could influence both the dopaminergic and serotonergic systems,
                                   the habenula is thought to play a key role in not only sleep and wakefulness but also in regulating
   Copyright Huang et al. This
                                   various emotional and cognitive functions. Animal studies showed that activities in lateral habenula
article is distributed under the
                                   (LHb) increased during the processing of aversive events such as omission of predicted rewards, and
terms of the Creative Commons
Attribution License, which         stimuli provoking anxiety, stress, pain and fear (Matsumoto and Hikosaka, 2007; Hikosaka, 2010;
permits unrestricted use and       Yamaguchi et al., 2013; Hu et al., 2020).
redistribution provided that the      Hyperexcitability and dysfunction of the LHb have been implicated in the development of psychi-
original author and source are     atric disorders including depressive disorder and bipolar disorders (Fakhoury, 2017; Yang et al.,
credited.                          2018b). In rodents, LHb firing rate and metabolism is elevated in parallel with depressive-like

Huang, Sun, et al. eLife 2021;10:e65444. DOI: https://doi.org/10.7554/eLife.65444                                                  1 of 21
Research article                                                                                                                  Neuroscience

                                     phenotypes such as reduction in locomotor and rearing behaviors (Caldecott-Hazard et al., 1988).
                                     Habenula activities also increase during acquisition and recall of conditioned fear (González-
                                     Pardo et al., 2012). In human participants, high-resolution magnetic resonance imaging has
                                     revealed smaller habenula volume in patients with depressive and bipolar disorders (Savitz et al.,
                                     2011a). Dysfunction of the LHb has also been involved in different cognitive disorders, such as
                                     schizophrenia (Shepard et al., 2006) and addiction (Velasquez et al., 2014). More direct evidence
                                     of the involvement of the LHb in psychiatric disorders in humans comes from deep brain stimulation
                                     (DBS) of the LHb that has potential therapeutic effects in treatment-resistant depression, bipolar dis-
                                     order, and schizophrenia (Sartorius et al., 2010; Zhang et al., 2019; Wang et al., 2020). However,
                                     how habenula activities are modulated during the processing of emotional information in humans is
                                     still poorly understood.
                                         The processing of emotional information is crucial for an individual’s mental health and has a sub-
                                     stantial influence on social interactions and different cognitive processes. Dysfunction and dysregula-
                                     tion of emotion-related brain circuits may precipitate mood disorders (Phillips et al., 2003b).
                                     Investigating the neural activities in response to emotional stimuli in the cortical-habenula network is
                                     crucial to our understanding of emotional information processing in the brain. This might also shed
                                     light on how to modulate habenula in the treatment of psychiatric disorders. In this study, we utilize
                                     the unique opportunity offered by DBS surgery targeting habenula as a potential treatment for psy-
                                     chiatric disorders. We measured local field potentials (LFPs) from the habenula area using the elec-
                                     trodes implanted for DBS in patients during a passive emotional picture-viewing task (Figure 1;
                                     Materials and methods). Whole-brain magnetoencephalography (MEG) was simultaneously
                                     recorded. This allowed us to investigate changes in the habenula neural activity and its functional
                                     connectivity with cortical areas induced by the stimuli of different emotional valence. The high tem-
                                     poral resolution of the LFP and MEG measurements also allowed us to evaluate how local activities
                                     and cross-region connectivity change over time in the processing of emotional stimuli. Previous stud-
                                     ies on rodent models of depression showed that, during the depression-like state in rodents, LHb
                                     neuron firing increased with the mean firing rate at the theta band (Li et al., 2011) and LHb neurons
                                     fire in bursts and phase locked to local theta band field potentials (Yang et al., 2018a). Therefore,
                                     we hypothesize that theta band activity in the habenula LFPs in humans would increase in response
                                     to negative emotional stimuli.

Figure 1. Experimental paradigm and ratings (valence and arousal) of the presented pictures. (A) Timeline of one individual trial: each trial started with
a white cross (‘+’) presented with black background for 1 s, indicating the participants to get ready and pay attention; then a picture was presented in
the center of the screen for 2 s. This was followed by a blank black screen presented for 3–4 s (randomized). (B) Valence and arousal ratings for figures
of the three emotional categories presented to the participants. Valence: 1 = very negative; 9 = very positive; arousal: 1 = very clam; 9 = very exciting.
Error bars indicate the standard deviation of the corresponding mean across participants (N = 9).

Huang, Sun, et al. eLife 2021;10:e65444. DOI: https://doi.org/10.7554/eLife.65444                                                                   2 of 21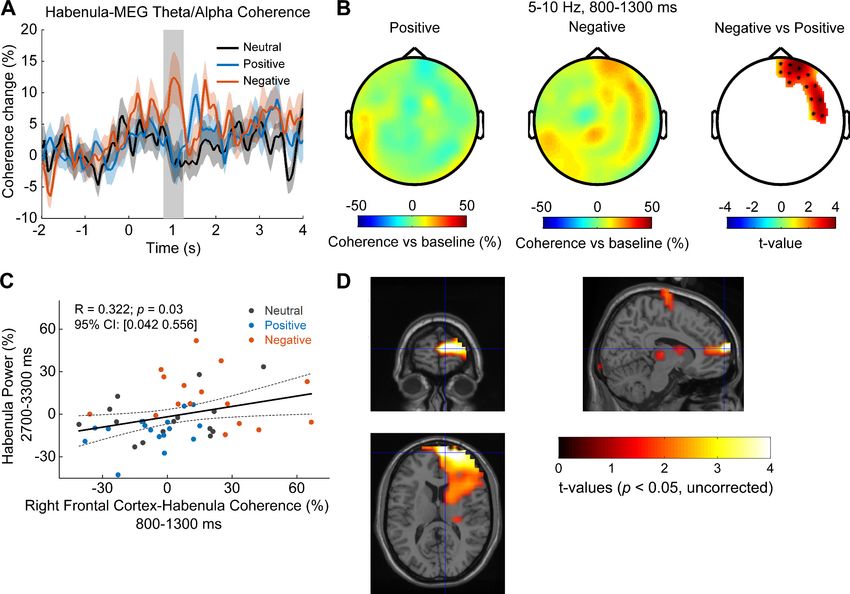
Research article Neuroscience
Results
Spontaneous oscillatory activity in the habenula during rest includes
theta/alpha oscillations
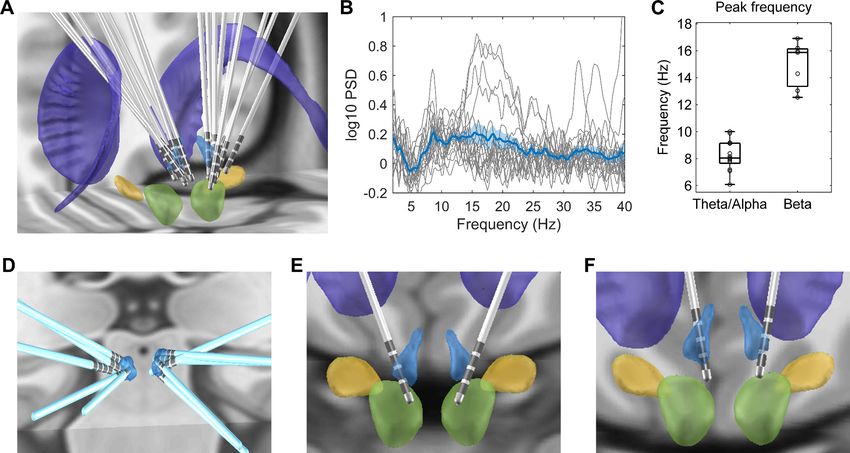
Electrode trajectories and contact positions of all recorded patients in this study were reconstructed
using the Lead-DBS toolbox (Horn and Kühn, 2015) and shown in Figure 2A. The peak frequency
of the oscillatory activities during rest for each electrode identified using the Fitting Oscillations and
One-Over-F (FOOOF) algorithm (Haller et al., 2018; Donoghue et al., 2020) is presented in
Table 1. We detected the power of oscillatory activities peaking in the theta/alpha frequency range
(here defined as 5–10 Hz) in 13 out of the 18 recorded habenula during rest compared to 7 of the 18
recorded habenula with peaks in beta band (12–30 Hz) (Figure 2B). The average peak frequency
was 8.2 ± 1.1 Hz (ranges from 6.1 Hz to 10 Hz) for theta/alpha, and 15.1 ± 1.8 Hz (ranges from 12.5
Hz to 16.9 Hz) for beta band (Figure 2C). 3 out of the 18 recorded habenula showed oscillatory
activities in both theta/alpha and beta bands. Figure 2D–F shows the position of the electrodes with
only theta/alpha band peaks, with only beta peaks in both sides (Case 3), with both theta/alpha and
beta band peaks during rest (Case 6), respectively. The electrodes from which only alpha/theta
peaks were detected are well placed in the habenula area.
Figure 2. Electrode location and spectral characteristics of local field potentials from recorded habenula at rest. (A) Electrode locations reconstructed
using Lead-DBS, with the structures colored in light blue for the habenula, purple for the caudate nucleus, light green for the red nucleus, and yellow
for subthalamic nucleus. (B) The log-transformed oscillatory power spectra fitted using fooof method (after removing the non-oscillatory 1/f
components). The bold blue line and shadowed region indicates the mean ± SEM across all recorded hemispheres, and the thin gray lines show
measurements from individual hemispheres. (C) Boxplot showing the peak frequencies at theta/alpha and beta frequency bands from all recorded
habenula. (D) Positions of the electrodes with theta peaks only during rest. (E) Electrode positions for Case 3, in whom only beta band peaks were
detected in the resting activities from both sides. (F) Electrode positions for Case 6, in whom both theta and beta band peaks were present in resting
activities from both sides.
The online version of this article includes the following source data for figure 2:
Source data 1. Source data for generating Figure 2B, C.
Huang, Sun, et al. eLife 2021;10:e65444. DOI: https://doi.org/10.7554/eLife.65444 3 of 21
Research article                                                                                                               Neuroscience

Table 1. Characteristics of enrolled subjects.
Patient      Sex       Age (years)        Duration (years)       Disease       HAMD score          BDI score       Resting oscillation peaks
                                                                                                                   L                     R
1            M         21                 5                      Schiz         NA                  32              9.1 Hz                9.8 Hz
2            M         21                 5                      Dep           12                  10              7.9 Hz                8.4 Hz
3            M         44                 10                     Bipolar       23                  22              14.3 Hz               15.9 Hz
4            F         19                 4                      Schiz         NA                  NA              10 Hz                 8.1 Hz
5            M         21                 3                      Dep           24                  38              7.1 Hz                16.9 Hz
6            M         16                 2                      Schiz         NA                  34              9.2 Hz; 13.0 Hz       7.2 Hz; 12.5 Hz
7            F         30                 8                      Bipolar       21                  33              6.1 Hz                7.8 Hz
8            F         28                 13                     Dep           28                  37              No peak               8.0 Hz
9            M         35                 20                     Dep           25                  34              16.2 Hz               7.9 Hz; 16.0 Hz

Hab: habenula; F: female; M: male; Dep: depressive disorder; Bipolar: bipolar disorder; Schiz: schizophrenia; HAMD: Hamilton Depression Rating Scale (17
items); BDI: Beck Depression Inventory; Both HAMD and BDI were acquired before the surgery. NA: not available.

                                     Transient theta/alpha activity in the habenula is differentially
                                     modulated by stimuli with positive and negative emotional valence
                                     The power spectra normalized to the baseline activity ( 2000 to 200 ms) showed a significant
                                     event-related synchronization (ERS) in the habenula spanning across 2–30 Hz from 50 to 800 ms after
                                     the presentation of all stimuli (pcluster < 0.05, Figure 3A–C). Permutation tests were applied to the
                                     power spectra in response to the negative and positive emotional pictures from all subjects. This
                                     identified two clusters with significant difference for the two emotional valence conditions: one in
                                     the theta/alpha range (5–10 Hz) at short latency (from 100 to 500 ms, Figure 3D, E) after stimulus
                                     presentation and another in the theta range (4–7 Hz) at a longer latency (from 2700 to 3300 ms,
                                     Figure 3D, F), with higher increase in the identified frequency bands with negative stimuli compared
                                     to positive stimuli in both clusters. The power of the activity at the identified frequency band for the
                                     neutral condition sits between the values for the negative condition and positive condition in both
                                     identified time windows (Figure 3G, H). It should be noted that there was an increase in a broad-
                                     band activity at short latency (from 100 to 500 ms) after the stimuli onset (Figure 3A–C). This raises
                                     the question as to whether the emotional valence-related modulation observed in Figure 3D, espe-
                                     cially the cluster at short latency, reflects a modulation of oscillations, which is not phase-locked to
                                     stimulus onset, or, alternatively, is it attributable to an evoked event-related potential (ERP). To
                                     address this question, we quantified the ERP for each emotional valence condition for each habe-
                                     nula. There was no significant difference in ERP latency or amplitude caused by different emotional
                                     valence stimuli (Figure 3—figure supplement 1). In addition, when only considering the non-phase-
                                     locked activity by removing the ERP from the time series before frequency-time decomposition, the
                                     emotional valence effect (presented in Figure 3—figure supplement 2) is very similar to those
                                     shown in Figure 3. These additional analyses demonstrated that the emotional valence effect in the
                                     LFP signal is more likely to be driven by non-phase-locked (induced only) activity, even though the
                                     possibility of the contribution from transient evoked potentials still cannot be completed excluded.
                                     Therefore, we refer to the activities in the habenula LFPs that are modulated by emotional valence
                                     at short latency after stimulus onset as ‘activity’ rather than ‘oscillations’.

                                     Theta/alpha activity in the prefrontal cortex is also differentially
                                     modulated by stimuli with positive and negative emotional valence
                                     For cortical activities measured using MEG, we first computed the time-frequency power spectra
                                     normalized to the baseline activity ( 2000 to 200 ms) averaged across all MEG frontal sensors
                                     highlighted in Figure 4A for different stimulus emotional valence conditions for each recorded par-
                                     ticipant. The average power spectra across eight participants for different valence conditions are
                                     shown in Figure 4B. Permutation test applied to the power spectra in response to the negative and
                                     positive emotional pictures from all subjects identified clusters with significant differences (pcluster <
                                     0.05) in the theta/alpha range at short latency (from 100 to 500 ms after stimulus onset) (Figure 4C).

Huang, Sun, et al. eLife 2021;10:e65444. DOI: https://doi.org/10.7554/eLife.65444                                                                  4 of 21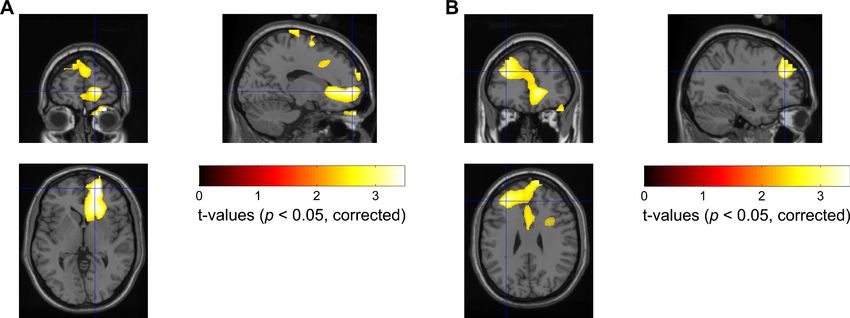
Research article                                                                                                                    Neuroscience

Figure 3. Habenular theta/alpha activity is differentially modulated by stimuli with positive and negative emotional valence (N = 18 habenula local field
potential samples from nine subjects). (A–C) Time-frequency representations of the power response relative to pre-stimulus baseline ( 2000 to 200
ms) for neutral (A), positive (B), and negative (C) valence stimuli, respectively. Significant clusters (p
Research article                                                                                                                Neuroscience

Figure 3 continued
Figure supplement 2. Non-phase-locked (induced only) activity in different emotional valence (neutral, positive, and negative) conditions (N = 18).

                                     Subsequent cluster-based permutation statistical analysis of power changes over the identified fre-
                                     quency band (5–10 Hz) and time window (100–500 ms) confirmed significantly increased activity with
                                     negative stimuli in frontal sensors only (Figure 4D).
                                        Next, we used a frequency-domain beamforming approach and statistics over eight subjects to
                                     identify the source of the difference in MEG theta/alpha reactivity within the 100–500 ms time win-
                                     dow at the corrected significance threshold of p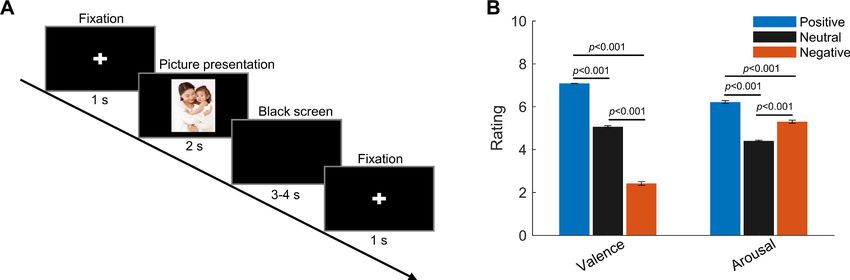
Research article                                                                                                            Neuroscience

Figure 5. Statistical source maps of t-values (p
Research article                                                                                                                  Neuroscience

Figure 6. Cortical-habenular coherence in the theta/alpha band is also differentially modulated by stimuli with positive and negative emotional valence
(N = 16 local field potential-magnetoencephalography [LFP-MEG] combination samples from eight subjects). (A) Time-varying theta (5–10 Hz) habenula-
cortical coherence changes relative to pre-cue baseline averaged across all MEG channel combinations for each recorded habenula. The thick colored
lines and shaded area show the mean and standard error across all recorded habenula. The coherence was significantly higher at 800–1300 ms after the
onset of negative emotional stimuli compared to positive stimuli (rectangular shadow showing the time window with p
Research article Neuroscience
0.7154]), p=0.2020 for neutral; R = 0.3846 (95% confidential interval: [ 0.1373 0.7394]), p=0.1474
for positive; R = 0.1655 (95% confidential interval: [ 0.6111 0.3597]), p=0.5474 for negative). In
addition, we tested whether this coherence-power correlation was specific to the time window iden-
tified based on Figure 6A. To do so, we quantified the correlation between the habenula theta
power at 2700–3300 ms and the habenula-PFC theta coherence at 200–300 ms, 300–800 ms,
1300–1800 ms, and 1800–2300 ms separately. None of the habenula-PFC coherences at other time
windows correlated with habenula theta at 2700–3300 ms. We acknowledge that the effect shown in
Figure 6C is weak and would not survive correction for multiple comparison. However, the selection
of time window for the test shown in Figure 6C was based on the previous test shown in Figure 6A,
not based on multiple tests.
Source localization of the theta/alpha habenula-cortical coherence difference for negative and
positive stimuli revealed that theta/alpha coherence was higher with negative stimuli in right frontal
regions, indicated in Figure 6D. The location of the peak t-statistic (t-value = 5.73, p=0.001, uncor-
rected) corresponds to MNI coordinate [10, 64, 12] and the region encompasses right medial PFC.
Increased theta/alpha synchrony in the PFC-habenula network
correlated with emotional valence, not arousal
It should be noted that there was co-variation between emotional valence and arousal in the stimuli
presented (Figure 1B), and previous studies have shown that some neural activity changes in
response to the viewing of affective pictures can be mediated by the effect of stimulus arousal
(Huebl et al., 2014; Huebl et al., 2016). Therefore, we used linear mixed-effect modeling to assess
whether the increased transient theta/alpha activity we observed in the habenula, the PFC, and in
the PFC-habenula coherence in response to the viewing of negative compared to positive emotional
pictures should be attributed to the emotional valence or the stimulus arousal. The nonlinear and
non-monotonic relationship between arousal scores and the emotional valence scores shown in
Figure 1B allowed us to differentiate the effect of the valence from arousal. The models identified
significant fixed effects of valence on all the reported changes in the PFC-habenula network, but
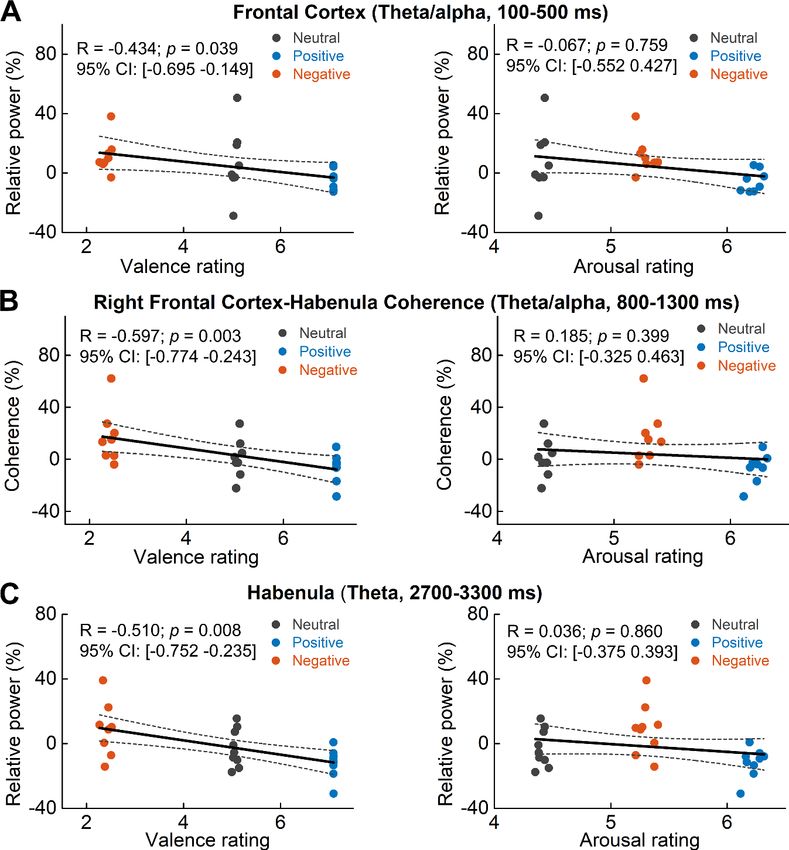
there was no effect of arousal (Table 2 for the modeling and results). The negative effects of valence
indicate that the lower the emotional valence score (more negative) of the presented stimuli, the
higher the theta/alpha increase within the habenula, the PFC, and in the PFC-habenula theta band
coherence, as shown in Figure 7.
Furthermore, we also investigated the relationship between the neural characteristics we
observed and the clinical symptoms. However, none of the electrophysiological effects we observed
correlated with clinical scores of depression (the Beck Depression Inventory score or Hamilton
Table 2. Linear mixed effect modeling details.
ID Model Fixed effect of valence Fixed effect of arousal R2
k-Value 95% CI p-Value k-Value 95% CI p-Value
1 HabTheta1~ 2.8044 ± 0.9840 [ 4.7800,–0.8289] 0.0063 2.5221 ± [ 7.6139, 2.5697] 0.3247 0.6191
Valence+Arousal+ 2.5363
1|SubID
2 HabTheta2̃ 4.4526 ± 1.1753 [ 6.8121,–2.0932] 0.0004 0.1975 ± 3.0295 [ 5.8844, 6.2794] 0.9483 0.2557
Valence+Arousal+
1|SubID
3 PFC_Theta~ 2.8921 ± 1.0221 [ 4.9507,–0.8334] 0.0069 3.6237 ± [ 8.9112, 1.6637] 0.1743 0.4368
Valence+Arousal+ 2.6252
1|SubID
4 rPFC_Hab_Coh~ 6.1031 ± 1.6785 [ 9.4837,–2.7225] 0.0007 3.5242 ± 4.3112 [ 5.1589, 12.2074] 0.4180 0.2766
Valence+Arousal+
1|SubID
HabTheta1: theta/alpha band (5–10 Hz) in habenula LFPs at 100–500 ms ; HabTheta2: theta band (4–7 Hz) in habenula LFPs at 2700–3300 ms; PFC_Theta:
theta/alpha band (5–10 Hz) averaged across frontal sensors at 100–500 ms; rPFC_Hab_Coh: theta/alpha band (5–10 Hz) coherence between right PFC and
habenula at 800–1300 ms; Valence: valence value for the displayed pictures (1 = unpleasant -> 5 = neutral -> 9 = pleasant); Arousal: arousal value of the
displayed pictures (1 = calm -> 9 = exciting); LFP: local field potential; PFC: prefrontal cortex.
Huang, Sun, et al. eLife 2021;10:e65444. DOI: https://doi.org/10.7554/eLife.65444 9 of 21Research article Neuroscience
Figure 7. Scatter plots showing how early theta/alpha band power increase in the frontal cortex (A) theta/alpha
band frontal cortex-habenula coherence (B) and theta band power increase at a later time window in habenula (C)
changed with emotional valence (left column) and arousal (right column). Each dot shows the average of one
participant in each categorical valence condition, which are also the source data of the multilevel modeling results
presented in Table 2. The estimated correlation coefficient R and 95% confidence interval (CI), as well as the p
value in the figure, are the results of partial correlation considering all data points together.
The online version of this article includes the following source data for figure 7:
Source data 1. Source data for generating Figure 7 and Table 2.
Depression Rating Scale score) measured before the surgery across patients after correcting for mul-
tiple correction.
Discussion
This study has showed that neural activities in the theta/alpha frequency band within the habenula
and prefrontal cortical regions, as well as the connectivity between these structures in the same fre-
quency band, are modulated in an emotional picture-viewing task in human participants. Compared
with positive emotional stimuli, negative emotional stimuli were associated with higher transient
increase in theta/alpha activity in both habenula and bilateral frontal cortex with a short latency
(from 100 to 500 ms) after stimulus onset. Furthermore, higher theta/alpha coherence between
habenula and right PFC was observed at 800–1300 ms after the stimulus onset, which was correlated
with another increase in theta power in the habenula with a long latency (from 2700 to 3300 ms)
after stimulus onset. These changes correlated with the emotional valence but not with the stimulus
Huang, Sun, et al. eLife 2021;10:e65444. DOI: https://doi.org/10.7554/eLife.65444 10 of 21Research article Neuroscience
arousal of the presented figures. These activity changes at different time windows may reflect the
different neuropsychological processes underlying emotion perception including identification and
appraisal of emotional material, production of affective states, and autonomic response regulation
and recovery (Phillips et al., 2003a). The later effects of increased theta activities in the habenula
when the stimuli disappeared were also supported by other literature showing that there can be pro-
longed effects of negative stimuli in the neural structure involved in emotional processing
(Haas et al., 2008; Puccetti et al., 2021). In particular, greater sustained patterns of brain activity in
the medial PFC when responding to blocks of negative facial expressions were associated with
higher scores of neuroticism across participants (Haas et al., 2008). Slower amygdala recovery from
negative images also predicts greater trait neuroticism, lower levels of likability of a set of social
stimuli (neutral faces), and declined day-to-day psychological well-being (Schuyler et al., 2014;
Puccetti et al., 2021). This is the first study, to our knowledge, implicating increased theta band
activities in the habenula-PFC network in negative emotions in human patients.
Habenula theta/alpha activity in negative emotional processing and
major depression
The LHb has shown consistent hyperactivity in multiple animal models of depression-like phenotypes
(Hu et al., 2020). Increased LHb activities have been observed during omission of a predicted
reward, depressive-like phenotype, fear or stress (Matsumoto and Hikosaka, 2009; Bromberg-
Martin and Hikosaka, 2011; Wang et al., 2017). Furthermore, manipulations enhancing or sup-
pressing LHb activity in rodents lead to depressive-like or antidepressant effects, respectively
(Li et al., 2013; Lecca et al., 2016; Cui et al., 2018; Yang et al., 2018a). Increased activation of the
LHb inhibits dopamine neurons (Ji and Shepard, 2007; Hikosaka, 2010) and allows avoidance of
threatening or unpleasant confrontations (Shumake et al., 2010; Friedman et al., 2011). In accor-
dance with findings in animal models, several studies have provided evidence for habenula hyperac-
tivity in human subjects with depressive disorders (Morris et al., 1999; Lawson et al., 2017).
To our knowledge, this is the first study showing increased neural activity in the habenula in the
theta/alpha frequency band with perception of negative emotion in human participants. This is con-
sistent with previous findings that LHb neurons in rodents in the depressive-like state showed
increased firing with a mean firing rate in the theta frequency band (Li et al., 2011), and that keta-
mine reversed both the increase in theta activity in the habenula and depressive-like behavior in
rodents (Yang et al., 2018a). The results in this study are also consistent with recent research show-
ing that acute 5 Hz DBS of the LHb is associated with depressive-like behavior such as increased
duration of immobility in a forced swim test in rodents (Jakobs et al., 2019). Possibly due to the lim-
ited sample size, we did not observe any correlation between the habenula theta/alpha activities
and the Beck Depression Inventory score or Hamilton Depression Rating Scale score measured
before the surgery across patients in this study. It therefore remains to be established whether
hypersynchrony in the theta band in habenula might be associated with the development of depres-
sive symptoms in human patients.
Prefrontal cortex-habenular coherence in negative emotional
processing
Apart from increased theta/alpha band synchronization within the bilateral habenula and PFC, our
data showed that negative emotional stimuli induced increased theta/alpha coherence between the
habenula and the right PFC. The increased rPFC-habenular coherence correlated with further
increase of theta activities within the habenula at a later latency. These results suggest a specific role
of the theta/alpha synchronization between habenula and frontal cortex in the perception of nega-
tive emotional valence. Previous studies have showed that LHb receives input from cortical areas
processing information about pain, loss, adversities, bad, harmful, or suboptimal choices, such as the
anterior insula and dorsal ACC (dACC) and the pregenual ACC (pgACC) (Vadovičová, 2014). Our
data is consistent with the hypothesis that PFC-to-habenular projections provide a teaching signal
for value-based choice behavior, helping to learn to avoid potentially harmful, low-valued or wrong
choices (Vadovičová, 2014).
Our data also showed that the increase of PFC-habenular coherence during the presentation of
negative emotional stimuli was mainly located in the right frontal cortex. Many studies have
Huang, Sun, et al. eLife 2021;10:e65444. DOI: https://doi.org/10.7554/eLife.65444 11 of 21Research article Neuroscience
investigated how both hemispheres have a role in emotional processing. The Right Hemisphere
Hypothesis (RHH) suggests that the right hemisphere would be involved, more than the left hemi-
sphere, in the processing of all emotional stimuli, irrespective of their emotional valence (Gain-
otti, 2012). On the other hand, the Valence Hypothesis (VH) posits that the left and the right
hemispheres would be specialized in processing positive and negative emotions, respectively
(Davidson, 1992; Wyczesany et al., 2018). The latter hypothesis has also been supported by stud-
ies of brain lesion (Starkstein et al., 1987; Morris et al., 1999), electroencephalography (EEG)
(Davidson, 1992; Wyczesany et al., 2018), transcranial magnetic stimulation (TMS) (Pascual-
Leone et al., 1996), and functional neuroimaging (Canli et al., 1998; Beraha et al., 2012) in the
PFC. Our findings suggest a more important role of the functional connectivity between the right
frontal cortex and habenula for the processing of negative emotions.
Implications for the development of DBS therapy
Although the exact underlying physiological mechanism of DBS remains elusive, high-frequency DBS
delivered to STN and GPi can reduce the firing rates of local neurons (Boraud et al., 1996;
Welter et al., 2004) and suppress the hypersynchrony of oscillatory activities in the beta frequency
band in the network, leading to symptom alleviation (Kuhn et al., 2008; Oswal et al., 2016) for Par-
kinson’s disease. In addition, high-frequency DBS may also dissociate input and output signals,
resulting in the disruption of abnormal information flow through the stimulation site (Chiken and
Nambu, 2016). This is supported by recent studies showing that patient-specific connectivity profiles
between the stimulation target and area of interest in the cortex can predict clinical outcome of DBS
for Parkinson’s disease (Horn et al., 2017), major depressive disorder (MDD) (Riva-Posse et al.,
2014), and obsessive-compulsive disorder (Baldermann et al., 2019). Our results suggest that
increased theta activity in the habenula and increased theta/alpha coherence between PFC and
habenula are associated with negative emotional valence in human patients. High-frequency DBS
targeting habenula may be beneficial for treatment-resistant MDD by inhibiting possible hyperactiv-
ity and theta band over-synchrony of neuronal activities in the habenula and by disrupting the infor-
mation flow from the PFC to other midbrain areas through the habenula. It remains to be explored
whether theta band synchronization can be used as a biomarker for closed loop habenula DBS for
better treatment of MDD.
Limitations
The response to emotional tasks is likely to be altered in patients with pathological mood states
compared to healthy subjects. This study cannot address whether the emotional valence effect we
observed is specific to psychiatric disorders or is a common feature of healthy emotional processing.
Another caveat we would like to acknowledge is that the human habenula is a small region. Existing
data from structural MRI scans reported combined habenula (the sum of the left and right hemi-
spheres) volumes of ~ 30–36 mm3 (Savitz et al., 2011a; Savitz et al., 2011b), meaning that each
habenula has the size of 2–3 mm in each dimension, which may be even smaller than the standard
functional MRI voxel size (Lawson et al., 2013). The size of the habenula is also small relative to the
standard DBS electrodes (as shown in Figure 2A). The electrodes used in this study (Medtronic
3389) have electrode diameter of 1.27 mm with each contact length of 1.5 mm and contact spacing
of 0.5 mm. We have tried different ways to confirm the location of the electrode and select the con-
tacts that are within or closest to the habenula: (1) the MRI was co-registered with a CT image (Gen-
eral Electric, Waukesha, WI, USA) with the Leksell stereotactic frame to obtain the coordinate values
of the tip of the electrode and (2) postoperative CT was co-registered to preoperative T1 MRI using
a two-stage linear registration using Lead-DBS software. We used bipolar signals constructed from
neighboring macroelectrode recordings, which have been shown to detect locally generated poten-
tials from subthalamic nucleus and especially when the macroelectrodes are inside the subthalamic
nucleus (Marmor et al., 2017). Considering that not all contacts for bipolar LFP construction are in
the habenula in this study, as shown in Figure 2, we cannot exclude the possibility that the activities
we measured are contaminated by activities from neighboring areas through volume conduction. In
particular, the human habenula is surrounded by thalamus and adjacent to the posterior end of the
medial dorsal thalamus, so we may have captured activities from the medial dorsal thalamus. How-
ever, we also showed that those bipolar LFPs from contacts in the habenula tend to have a peak in
Huang, Sun, et al. eLife 2021;10:e65444. DOI: https://doi.org/10.7554/eLife.65444 12 of 21Research article Neuroscience
the theta/alpha band in the power spectra density (PSD), whereas recordings from contacts outside
the habenula tend to have extra peak in beta frequency band in the PSD. This supports the habenula
origin of the emotional valence-related changes in the theta/alpha activities reported here. In addi-
tion, it should also be noted that a postoperative stun effect cannot be excluded, which could inter-
fere with neural recordings, considering that the experiment took place only a few days after
electrode implantation.
Conclusion
In this study, we exploited the high temporal resolution of LFP and MEG measurements and
observed an emotional valence effect in local activities and in cross-region coherence in the cortical-
habenula network in different time windows. Our results provide evidence for the role of neural
activity in the theta/alpha frequency band within the habenula and prefrontal cortical regions, as well
as of theta/alpha coherence between these structures in the processing and experiencing of nega-
tive emotions in human patients.
Materials and methods
Participants
Nine patients (six males, aged 16–44, more details in Table 1) were recruited for this study, who
underwent bilateral DBS surgery targeting the habenula as a clinical trial for treatment-resistant
major depression (ClinicalTrials.gov identifier: NCT03347487) or as a pilot study for intractable
schizophrenia or bipolar disorders. All participants gave written informed consent to the current
study, which was approved by the local ethics committee of Ruijin Hospital, Shanghai Jiao Tong Uni-
versity School of Medicine, in accordance with the Declaration of Helsinki. The surgical procedure
has been previously described (Zhang et al., 2019). The electrode position, stimulation parameters,
and clinical outcome in Case 1 have been separately reported (Wang et al., 2020).
DBS operation
Implantation of the quadripolar DBS electrodes (model 3389 [contact: 1.5 mm; distance: 0.5 mm;
diameter: 1.27 mm]; Medtronic, Minneapolis, MN, USA) was performed under general anesthesia
bilaterally using a MRI-guided targeting (3.0 T, General Electric). The MRI was co-registered with a
CT image (General Electric, Waukesha) with the Leksell stereotactic frame to obtain the coordinate
values (Zhang et al., 2019). The electrode leads were temporary externalized for 1 week.
Paradigm
Patients were recorded in an emotional picture-viewing task (Kuhn et al., 2005; Huebl et al., 2016)
2–5 days after the first stage of the surgery for electrode implantation and prior to the second oper-
ation to connect the electrode to the subcutaneous pulse generator. During the task, participants
were seated in the MEG scanner with a displaying monitor in front of them. Pictures selected from
the Chinese Affective Pictures System (CAPS) (Bai et al., 2005) were presented on the monitor in
front of them. The emotional valence (1 = unpleasant ) 5 = neutral ) 9 = pleasant) and arousal (1
= calm ) 9 = exciting) of the pictures were previously rated by healthy Chinese participants
(Bai et al., 2005). The figures can be classified into three valence categories (neutral, positive, and
negative) according to the average score on emotional valence. As low-level properties of the fig-
ures, such as contrast brightness and complexity of the figures, are not measured or reported in the
CAPS, only very dark or bright pictures were excluded from the paradigm. In our paradigm, each
experiment consisted of multiple blocks of 30 trials, with each block including 10 pictures of each
valence category (neutral, positive, and negative) in randomized order. Each trial started with a white
cross (‘+’) presented with a black background for 1 s, indicating the participants to get ready and
pay attention, then a picture was presented in the center of the screen for 2 s. This was followed by
a blank black screen presented for 3–4 s (randomized). The task was programed using PsychoPy
(https://www.psychopy.org/) with the timeline of each individual trial shown in Figure 1A. The partic-
ipants were reminded to pay attention to the pictures displayed on the monitor and instructed to try
to experience the emotions the pictures conveyed. An additional neutral picture was presented ran-
domly three times per block, upon which the patients were supposed to press a button to ensure
Huang, Sun, et al. eLife 2021;10:e65444. DOI: https://doi.org/10.7554/eLife.65444 13 of 21Research article Neuroscience
constant attention during the paradigm. All participants completed 2–4 blocks of the paradigm and
none of them missed any response to the additional figure, indicating that they kept focus and that
their working memory required for the task is normal. Pictures displayed to different participants are
overlapped but not exactly the same; the average valence and arousal values of the displayed pic-
tures are as shown in Figure 1B. There were significant differences in the emotional valence scores,
as well as in the arousal scores for the presented figures of the three emotional valence categories
(one-way ANOVA followed by Bonferroni post hoc test, F2,24 = 14642.02, pResearch article Neuroscience
to the 2–40 Hz range of the raw power spectra of the LFPs from each recorded hemisphere. We set
the maximal number of power peaks (max_n_peaks) to be 4, the width of the oscillatory peak
(peak_width_limits) to be between 1 and 15, and the threshold for detecting the peak (peak_thres-
hold) to be 2. The goodness of fit was visually inspected for recordings from each hemisphere to
make sure that the parameter settings worked well. After removing the aperiodic component, the
periodic oscillatory components in the LFP power spectra were parameterized by their center fre-
quency (defined as the mean of the Gaussian), amplitude (defined as the distance between the peak
of the Gaussian and the aperiodic fit), and bandwidth (defined as two standard deviations of the fit-
ted Gaussian) of the power peaks.
In the next step, we investigated the event-related power changes in the habenula LFPs and
MEG signals in response to the presentation of figures of different emotional valence categories. All
LFP and MEG signals were divided into event-related epochs aligned to the stimuli onset ( 2500 to
4500 ms around the stimulus onset) and visually inspected for artifacts due to movement and other
interferences. Trials with artifacts were removed from final analysis, leaving a mean number of 27 tri-
als (range 18–30) for each valence category for each subject. A time-frequency decomposition using
the wavelet transform-based approach with Morlet wavelet and cycle number of 6 was applied to
each trial. We used a 500 ms buffer on both sides of the clipped data to reduce edge effects. The
time-frequency representations were then averaged across trials of the same valence condition and
baseline corrected to the average of pre-stimulus activity ( 2000 to 200 ms) for each frequency
band. Thus, resulting time-frequency values were percentage changes in power relative to the pre-
stimulus baseline.
MEG-specific data analysis
Statistical comparison of power over a determined frequency band and time window between stimu-
lus conditions across the group of subjects was performed to find topographical space difference.
MEG source localization was conducted using a frequency-domain beamforming approach. The
dynamic imaging of coherent sources (DICS) beamformer in SPM8 with a single-shell forward model
was used to generate maps of the source power difference between conditions on a 5 mm grid co-
registered to MNI coordinates (Gross et al., 2001). A beamformer regularization parameter of 1%
was used based on the previous study (Litvak et al., 2010). This beamforming method has been
demonstrated to effectively suppress artifacts due to the presence of percutaneous extension wires
and enable localization of cortical sources exhibiting stimuli-related power changes and cortical sour-
ces coherent with deep brain LFPs (Litvak et al., 2010; Hirschmann et al., 2011; Litvak et al.,
2011). In this study, we focused our source analysis on the frequency band and time window identi-
fied by previous sensor-level power analysis to locate cortical sources of significant difference in the
power response to negative and positive emotional stimuli.
Cortical-habenular connectivity
The functional connectivity between habenula and cortical areas was investigated using coherence
analysis, which provides a frequency-domain measure of the degree of co-variability between signals
(Litvak et al., 2010; Neumann et al., 2015). The time-varying cross-trial coherence between each
MEG sensor and the habenula LFP was first calculated for each emotional valence condition. For
this, time-frequency auto- and cross-spectral densities in the theta/alpha frequency band (5–10 Hz)
between the habenula LFP and each MEG channel at sensor level were calculated using the wavelet
transform-based approach from 2000 to 4000 ms for each trial with 1 Hz steps using the Morlet
wavelet and cycle number of 6. Cross-trial coherence spectra for each LFP-MEG channel combina-
tion were calculated for each emotional valence condition for each habenula using the function
‘ft_connectivityanalysis’ in Fieldtrip (version 20170628). Stimulus-related changes in coherence were
assessed by expressing the time-resolved coherence spectra as a percentage change compared to
the average value in the 2000 to 200 ms (pre-stimulus) time window for each frequency. Sec-
ondly, we determined the time window of interest by statistically comparing the sensor-level coher-
ence between stimulus conditions. Third, cortical sources coherent with habenula-LFP activity in the
determined frequency band and time window were located using DICS beamformer for each stimuli
condition (Gross et al., 2001; Litvak et al., 2011).
Huang, Sun, et al. eLife 2021;10:e65444. DOI: https://doi.org/10.7554/eLife.65444 15 of 21Research article Neuroscience
Statistics
A non-parametric cluster-based permutation approach (Maris and Oostenveld, 2007) was applied
to normalized time-frequency matrices to identify clusters (time window and frequency band) with
significant differences in the power changes induced by the presentation of pictures of different
emotional valence. To achieve this, the original paired samples were randomly permuted 1000 times
such that each pair was maintained but its assignment to the condition (negative or positive) may
have changed to create a null-hypothesis distribution. For each permutation, the sum of the z-scores
within suprathreshold clusters (pre-cluster threshold: pResearch article Neuroscience
University Challenge Seed UCSF 459 Jean Debarros
Fund, Medical and Life Huiling Tan
Sciences Translational Fund,
University of Oxford
The funders had no role in study design, data collection and interpretation, or the
decision to submit the work for publication.
Author contributions
Yongzhi Huang, Conceptualization, Data curation, Formal analysis, Methodology, Writing - original
draft, Writing - review and editing; Bomin Sun, Resources, Funding acquisition, Investigation, Project
administration, Writing - review and editing; Jean Debarros, Yijie Lai, Peter Brown, Formal analysis,
Writing - review and editing; Chao Zhang, Shikun Zhan, Dianyou Li, Chencheng Zhang, Tao Wang,
Peng Huang, Investigation, Writing - review and editing; Chunyan Cao, Conceptualization, Data
curation, Formal analysis, Supervision, Funding acquisition, Investigation, Project administration,
Writing - review and editing; Huiling Tan, Conceptualization, Data curation, Formal analysis, Supervi-
sion, Funding acquisition, Investigation, Writing - original draft, Project administration, Writing -
review and editing
Author ORCIDs
Yongzhi Huang https://orcid.org/0000-0002-2503-1589
Peter Brown http://orcid.org/0000-0002-5201-3044
Huiling Tan https://orcid.org/0000-0001-8038-3029
Ethics
Clinical trial registration ClinicalTrials.gov Identifier: NCT03347487.
Human subjects: Informed consent, and consent to publish, was obtained before the recording. The
study was approved by the local ethics committee of Ruijin hospital, Shanghai Jiao Tong University
School of Medicine in accordance with the declaration of Helsinki.
Decision letter and Author response
Decision letter https://doi.org/10.7554/eLife.65444.sa1
Author response https://doi.org/10.7554/eLife.65444.sa2
Additional files
Supplementary files
. Source code 1. The source code file is a compressed folder containing the MATLAB scripts to gen-
erate the figures and separate files for the source data to generate different figures with the file
names indicating the figure or table with which the data was associated.
. Transparent reporting form
Data availability
All data generated or analysed during this study are included in the manuscript and supporting files.
References
Avants BB, Epstein CL, Grossman M, Gee JC. 2008. Symmetric diffeomorphic image registration with cross-
correlation: evaluating automated labeling of elderly and neurodegenerative brain. Medical Image Analysis 12:
26–41. DOI: https://doi.org/10.1016/j.media.2007.06.004, PMID: 17659998
Bai L, Ma H, Huang Y-X. 2005. The development of native chinese affective picture system-a pretest in 46 college
students. Chinese Mental Health J 11:719–722. DOI: https://doi.org/10.3321/J.ISSN:1000-6729.2005.11.001
Baldermann JC, Melzer C, Zapf A, Kohl S, Timmermann L, Tittgemeyer M, Huys D, Visser-Vandewalle V, Kühn
AA, Horn A, Kuhn J. 2019. Connectivity profile predictive of effective deep brain stimulation in Obsessive-
Compulsive disorder. Biological Psychiatry 85:735–743. DOI: https://doi.org/10.1016/j.biopsych.2018.12.019,
PMID: 30777287
Huang, Sun, et al. eLife 2021;10:e65444. DOI: https://doi.org/10.7554/eLife.65444 17 of 21Research article Neuroscience
Beraha E, Eggers J, Hindi Attar C, Gutwinski S, Schlagenhauf F, Stoy M, Sterzer P, Kienast T, Heinz A, Bermpohl
F. 2012. Hemispheric asymmetry for affective stimulus processing in healthy subjects–a fMRI study. PLOS ONE
7:e46931. DOI: https://doi.org/10.1371/journal.pone.0046931, PMID: 23056533
Boraud T, Bezard E, Bioulac B, Gross C. 1996. High frequency stimulation of the internal globus pallidus (GPi)
simultaneously improves parkinsonian symptoms and reduces the firing frequency of GPi neurons in the MPTP-
treated monkey. Neuroscience Letters 215:17–20. DOI: https://doi.org/10.1016/S0304-3940(96)12943-8,
PMID: 8880743
Bromberg-Martin ES, Hikosaka O. 2011. Lateral habenula neurons signal errors in the prediction of reward
information. Nature Neuroscience 14:1209–1216. DOI: https://doi.org/10.1038/nn.2902, PMID: 21857659
Caldecott-Hazard S, Mazziotta J, Phelps M. 1988. Cerebral correlates of depressed behavior in rats, visualized
using 14C-2-deoxyglucose autoradiography. The Journal of Neuroscience 8:1951–1961. DOI: https://doi.org/
10.1523/JNEUROSCI.08-06-01951.1988, PMID: 3385484
Canli T, Desmond JE, Zhao Z, Glover G, Gabrieli JD. 1998. Hemispheric asymmetry for emotional stimuli
detected with fMRI. NeuroReport 9:3233–3239. DOI: https://doi.org/10.1097/00001756-199810050-00019,
PMID: 9831457
Chiken S, Nambu A. 2016. Mechanism of deep brain stimulation: inhibition, excitation, or disruption? The
Neuroscientist : A Review Journal Bringing Neurobiology, Neurology and Psychiatry 22:313–322. DOI: https://
doi.org/10.1177/1073858415581986, PMID: 25888630
Crosse MJ, Foxe JJ, Molholm S. 2020. PERMUTOOLS: A MATLAB Package for Multivariate Permutation Testing.
Github. 9f4c6c8. https://github.com/mickcrosse/PERMUTOOLS
Cui Y, Yang Y, Ni Z, Dong Y, Cai G, Foncelle A, Ma S, Sang K, Tang S, Li Y, Shen Y, Berry H, Wu S, Hu H. 2018.
Astroglial Kir4.1 in the lateral habenula drives neuronal bursts in depression. Nature 554:323–327. DOI: https://
doi.org/10.1038/nature25752, PMID: 29446379
Davidson RJ. 1992. Anterior cerebral asymmetry and the nature of emotion. Brain and Cognition 20:125–151.
DOI: https://doi.org/10.1016/0278-2626(92)90065-T, PMID: 1389117
Donoghue T, Haller M, Peterson EJ, Varma P, Sebastian P, Gao R, Noto T, Lara AH, Wallis JD, Knight RT,
Shestyuk A, Voytek B. 2020. Parameterizing neural power spectra into periodic and aperiodic components.
Nature Neuroscience 23:1655–1665. DOI: https://doi.org/10.1038/s41593-020-00744-x, PMID: 33230329
Fakhoury M. 2017. The habenula in psychiatric disorders: more than three decades of translational investigation.
Neuroscience & Biobehavioral Reviews 83:721–735. DOI: https://doi.org/10.1016/j.neubiorev.2017.02.010,
PMID: 28223096
Fonov V, Evans AC, Botteron K, Almli CR, McKinstry RC, Collins DL. 2011. Unbiased average age-appropriate
atlases for pediatric studies. NeuroImage 54:313–327. DOI: https://doi.org/10.1016/j.neuroimage.2010.07.033
Friedman A, Lax E, Dikshtein Y, Abraham L, Flaumenhaft Y, Sudai E, Ben-Tzion M, Yadid G. 2011. Electrical
stimulation of the lateral habenula produces an inhibitory effect on sucrose self-administration.
Neuropharmacology 60:381–387. DOI: https://doi.org/10.1016/j.neuropharm.2010.10.006
Gainotti G. 2012. Unconscious processing of emotions and the right hemisphere. Neuropsychologia 50:205–218.
DOI: https://doi.org/10.1016/j.neuropsychologia.2011.12.005
González-Pardo H, Conejo NM, Lana G, Arias JL. 2012. Different brain networks underlying the acquisition and
expression of contextual fear conditioning: a metabolic mapping study. Neuroscience 202:234–242.
DOI: https://doi.org/10.1016/j.neuroscience.2011.11.064
Gross J, Kujala J, Hamalainen M, Timmermann L, Schnitzler A, Salmelin R. 2001. Dynamic imaging of coherent
sources: Studying neural interactions in the human brain. PNAS 98:694–699. DOI: https://doi.org/10.1073/
pnas.98.2.694
Haas BW, Constable RT, Canli T. 2008. Stop the sadness: Neuroticism is associated with sustained medial
prefrontal cortex response to emotional facial expressions. NeuroImage 42:385–392. DOI: https://doi.org/10.
1016/j.neuroimage.2008.04.027
Haller M, Donoghue T, Peterson E, Varma P, Sebastian P, Gao R. 2018. Parameterizing neural power spectra.
bioRxiv. DOI: https://doi.org/10.1101/299859
Herkenham M, Nauta WJH. 1979. Efferent connections of the habenular nuclei in the rat. The Journal of
Comparative Neurology 187:19–47. DOI: https://doi.org/10.1002/cne.901870103
Hikosaka O, Sesack SR, Lecourtier L, Shepard PD. 2008. Habenula: crossroad between the basal ganglia and the
limbic system. Journal of Neuroscience 28:11825–11829. DOI: https://doi.org/10.1523/JNEUROSCI.3463-08.
2008, PMID: 19005047
Hikosaka O. 2010. The habenula: from stress evasion to value-based decision-making. Nature Reviews
Neuroscience 11:503–513. DOI: https://doi.org/10.1038/nrn2866
Hirschmann J, Özkurt TE, Butz M, Homburger M, Elben S, Hartmann CJ, Vesper J, Wojtecki L, Schnitzler A.
2011. Distinct oscillatory STN-cortical loops revealed by simultaneous MEG and local field potential recordings
in patients with Parkinson’s disease. NeuroImage 55:1159–1168. DOI: https://doi.org/10.1016/j.neuroimage.
2010.11.063, PMID: 21122819
Hong S, Jhou TC, Smith M, Saleem KS, Hikosaka O. 2011. Negative reward signals from the lateral habenula to
dopamine neurons are mediated by rostromedial tegmental nucleus in primates. Journal of Neuroscience 31:
11457–11471. DOI: https://doi.org/10.1523/JNEUROSCI.1384-11.2011
Horn A, Reich M, Vorwerk J, Li N, Wenzel G, Fang Q, Schmitz-Hübsch T, Nickl R, Kupsch A, Volkmann J, Kühn
AA, Fox MD. 2017. Connectivity predicts deep brain stimulation outcome in parkinson disease. Annals of
Neurology 82:67–78. DOI: https://doi.org/10.1002/ana.24974, PMID: 28586141
Huang, Sun, et al. eLife 2021;10:e65444. DOI: https://doi.org/10.7554/eLife.65444 18 of 21Research article Neuroscience
Horn A, Li N, Dembek TA, Kappel A, Boulay C, Ewert S, Tietze A, Husch A, Perera T, Neumann WJ, Reisert M, Si
H, Oostenveld R, Rorden C, Yeh FC, Fang Q, Herrington TM, Vorwerk J, Kühn AA. 2019. Lead-DBS v2: towards
a comprehensive pipeline for deep brain stimulation imaging. NeuroImage 184:293–316. DOI: https://doi.org/
10.1016/j.neuroimage.2018.08.068, PMID: 30179717
Horn A, Kühn AA. 2015. Lead-DBS: a toolbox for deep brain stimulation electrode localizations and
visualizations. NeuroImage 107:127–135. DOI: https://doi.org/10.1016/j.neuroimage.2014.12.002, PMID: 254
98389
Hu H, Cui Y, Yang Y. 2020. Circuits and functions of the lateral habenula in health and in disease. Nature Reviews
Neuroscience 21:277–295. DOI: https://doi.org/10.1038/s41583-020-0292-4
Huebl J, Spitzer B, Brücke C, Schönecker T, Kupsch A, Alesch F, Schneider G-H, Kühn AA. 2014. Oscillatory
subthalamic nucleus activity is modulated by dopamine during emotional processing in Parkinson’s disease.
Cortex 60:69–81. DOI: https://doi.org/10.1016/j.cortex.2014.02.019
Huebl J, Brücke C, Merkl A, Bajbouj M, Schneider G-H, Kühn AA. 2016. Processing of emotional stimuli is
reflected by modulations of beta band activity in the subgenual anterior cingulate cortex in patients with
treatment resistant depression. Social Cognitive and Affective Neuroscience 11:1290–1298. DOI: https://doi.
org/10.1093/scan/nsw038
Husch A, V. Petersen M, Gemmar P, Goncalves J, Hertel F. 2018. PaCER - A fully automated method for
electrode trajectory and contact reconstruction in deep brain stimulation. NeuroImage: Clinical 17:80–89.
DOI: https://doi.org/10.1016/j.nicl.2017.10.004
Jakobs M, Pitzer C, Sartorius A, Unterberg A, Kiening K. 2019. Acute 5-Hz deep brain stimulation of the lateral
habenula is associated with depressive-like behavior in male wild-type Wistar rats. Brain Research 1721:146283.
DOI: https://doi.org/10.1016/j.brainres.2019.06.002, PMID: 31170383
Ji H, Shepard PD. 2007. Lateral Habenula Stimulation Inhibits Rat Midbrain Dopamine Neurons through a
GABAA Receptor-Mediated Mechanism. Journal of Neuroscience 27:6923–6930. DOI: https://doi.org/10.1523/
JNEUROSCI.0958-07.2007
Kuhn AA, Hariz MI, Silberstein P, Tisch S, Kupsch A, Schneider G-H, Limousin-Dowsey P, Yarrow K, Brown P.
2005. Activation of the subthalamic region during emotional processing in Parkinson disease. Neurology 65:
707–713. DOI: https://doi.org/10.1212/01.wnl.0000174438.78399.bc
Kuhn AA, Kempf F, Brucke C, Gaynor Doyle L, Martinez-Torres I, Pogosyan A, Trottenberg T, Kupsch A,
Schneider G-H, Hariz MI, Vandenberghe W, Nuttin B, Brown P. 2008. High-Frequency Stimulation of the
Subthalamic Nucleus Suppresses Oscillatory Activity in Patients with Parkinson’s Disease in Parallel with
Improvement in Motor Performance. Journal of Neuroscience 28:6165–6173. DOI: https://doi.org/10.1523/
JNEUROSCI.0282-08.2008
Lawson RP, Drevets WC, Roiser JP. 2013. Defining the habenula in human neuroimaging studies. NeuroImage
64:722–727. DOI: https://doi.org/10.1016/j.neuroimage.2012.08.076
Lawson RP, Nord CL, Seymour B, Thomas DL, Dayan P, Pilling S, Roiser JP. 2017. Disrupted habenula function in
major depression. Molecular Psychiatry 22:202–208. DOI: https://doi.org/10.1038/mp.2016.81
Lecca S, Pelosi A, Tchenio A, Moutkine I, Lujan R, Hervé D, Mameli M. 2016. Rescue of GABAB and GIRK
function in the lateral habenula by protein phosphatase 2A inhibition ameliorates depression-like phenotypes in
mice. Nature Medicine 22:254–261. DOI: https://doi.org/10.1038/nm.4037
Li B, Piriz J, Mirrione M, Chung C, Proulx CD, Schulz D, Henn F, Malinow R. 2011. Synaptic potentiation onto
habenula neurons in the learned helplessness model of depression. Nature 470:535–539. DOI: https://doi.org/
10.1038/nature09742
Li K, Zhou T, Liao L, Yang Z, Wong C, Henn F, Malinow R, Yates JR, Hu H. 2013. bCaMKII in Lateral Habenula
Mediates Core Symptoms of Depression. Science 341:1016–1020. DOI: https://doi.org/10.1126/science.
1240729
Litvak V, Eusebio A, Jha A, Oostenveld R, Barnes GR, Penny WD, Zrinzo L, Hariz MI, Limousin P, Friston KJ,
Brown P. 2010. Optimized beamforming for simultaneous MEG and intracranial local field potential recordings
in deep brain stimulation patients. NeuroImage 50:1578–1588. DOI: https://doi.org/10.1016/j.neuroimage.
2009.12.115
Litvak V, Jha A, Eusebio A, Oostenveld R, Foltynie T, Limousin P, Zrinzo L, Hariz MI, Friston K, Brown P. 2011.
Resting oscillatory cortico-subthalamic connectivity in patients with Parkinson’s disease. Brain 134:359–374.
DOI: https://doi.org/10.1093/brain/awq332
Maris E, Oostenveld R. 2007. Nonparametric statistical testing of EEG- and MEG-data. Journal of Neuroscience
Methods 164:177–190. DOI: https://doi.org/10.1016/j.jneumeth.2007.03.024
Marmor O, Valsky D, Joshua M, Bick AS, Arkadir D, Tamir I, Bergman H, Israel Z, Eitan R. 2017. Local vs. volume
conductance activity of field potentials in the human subthalamic nucleus. Journal of Neurophysiology 117:
2140–2151. DOI: https://doi.org/10.1152/jn.00756.2016
Matsumoto M, Hikosaka O. 2007. Lateral habenula as a source of negative reward signals in dopamine neurons.
Nature 447:1111–1115. DOI: https://doi.org/10.1038/nature05860
Matsumoto M, Hikosaka O. 2009. Representation of negative motivational value in the primate lateral habenula.
Nature Neuroscience 12:77–84. DOI: https://doi.org/10.1038/nn.2233
Morris JS, Smith KA, Cowen PJ, Friston KJ, Dolan RJ. 1999. Covariation of Activity in Habenula and Dorsal
Raphé Nuclei Following Tryptophan Depletion. NeuroImage 10:163–172. DOI: https://doi.org/10.1006/nimg.
1999.0455
Huang, Sun, et al. eLife 2021;10:e65444. DOI: https://doi.org/10.7554/eLife.65444 19 of 21You can also read