Integrated defect sensor for the inspection of fiber-reinforced plastics using air-coupled ultrasound
←
→
Page content transcription
If your browser does not render page correctly, please read the page content below
J. Sens. Sens. Syst., 9, 127–132, 2020
https://doi.org/10.5194/jsss-9-127-2020
© Author(s) 2020. This work is distributed under
the Creative Commons Attribution 4.0 License.

               Integrated defect sensor for the inspection of
           fiber-reinforced plastics using air-coupled ultrasound
                                        Yannick Bernhardt and Marc Kreutzbruck
                       Institut für Kunststofftechnik, University of Stuttgart, Stuttgart, 70569, Germany
                       Correspondence: Yannick Bernhardt (yannick.bernhardt@ikt.uni-stuttgart.de)

         Received: 30 September 2019 – Revised: 5 February 2020 – Accepted: 21 February 2020 – Published: 31 March 2020

       Abstract. Air-coupled ultrasound (ACU) is a non-destructive testing (NDT) method with a rising significance
       in industrial use. Common cases where ACU is used are the testing of fiber-reinforced plastic or testing of weld
       joints between metal sheets. The advantage compared to contact ultrasound is the absence of a liquid, solid or gel-
       like couplant. The usage of a couplant is an obstacle for developers of automatic scanning systems for ultrasonic
       testing because it takes a huge effort to integrate a system that delivers a continuous flow of the couplant. In
       addition a further step of cleaning is often necessary. ACU needs specially adapted probes to compensate for
       the tremendous impedance difference between a solid and air. A standard method uses two ACU probes in a
       normal transmission mode. With slanted probes, it is possible to generate Lamb waves in plate-like materials.
       Because of the contact to the surrounding air, Lamb waves transmit ultrasound to the air on both sides of the plate
       continually. These so-called leaky Lamb waves can be used with only one accessible side, and by using a specific
       resonance angle, a higher signal-to-noise ratio (SNR) is achievable. In the past, the correct angle was determined
       using an iterative method, where the angle of incidence was changed manually while observing the amplitude
       level. With the stepper-motor-driven angle scanning system, introduced here, the determination of the resonance
       angle is possible automatically. The system allows changes of the incidence angle during the ultrasound scan
       too. This makes it possible to adapt the system to wall thickness changes and changes of the radii of the parts
       contour.

1   Introduction                                                   attacking loads and the materials properties exactly. By re-
                                                                   ducing the ratio between bearable loads of the material and
Due to the high demand on environment safety on the                the attacking load, lighter designs are possible. Already small
modern automotive industry, lightweight design is reaching         defects in the structure can cause catastrophic damage when
higher level of importance. By reducing the mass of an air-        the safety factors are low. Therefore, the influence of struc-
plane structure by about 12 %, reductions of fuel consump-         tural damage has to be evaluated very carefully, and periodi-
tion of about 7 % are possible (Amendola et al., 2011). Be-        cal testing of structural parts is necessary.
sides the aim to achieve climate goals by CO2 reduction,              Typical defects in this material class are delaminations,
there is also a cost-driven factor for lightweight design be-      fiber rupture, matrix cracks, inhomogeneities with low fiber
cause of the reduction of fuel consumption. Weight reduc-          content, fiber undulations, pores or trapped particles. In re-
tion can be achieved by the variation of different parame-         cent years, several non-destructive testing (NDT) methods
ters. One example is to replace materials with a high density      were developed for testing fiber-reinforced plastics. There
with materials with a lower density but with similar perfor-       are methods only suitable for detection of near-surface de-
mance in stiffness and strength. This can be reached by the        fects like shearography (Gregory, 2003) or lock-in thermog-
usage of fiber-reinforced plastic instead of aluminum alloys       raphy (Rahammer, 2018). These methods are usable for
in aircraft fuselages. Similarly, lightweight engineers try to     most fiber-reinforced lightweight structures due to thin walls.
achieve lower masses by reducing the material volume. In           There are also volume methods like X-ray (computed to-
order to have a correct design, it is necessary to know the        mography), contact ultrasound (Holmes et al., 2005) or air-

Published by Copernicus Publications on behalf of the AMA Association for Sensor Technology.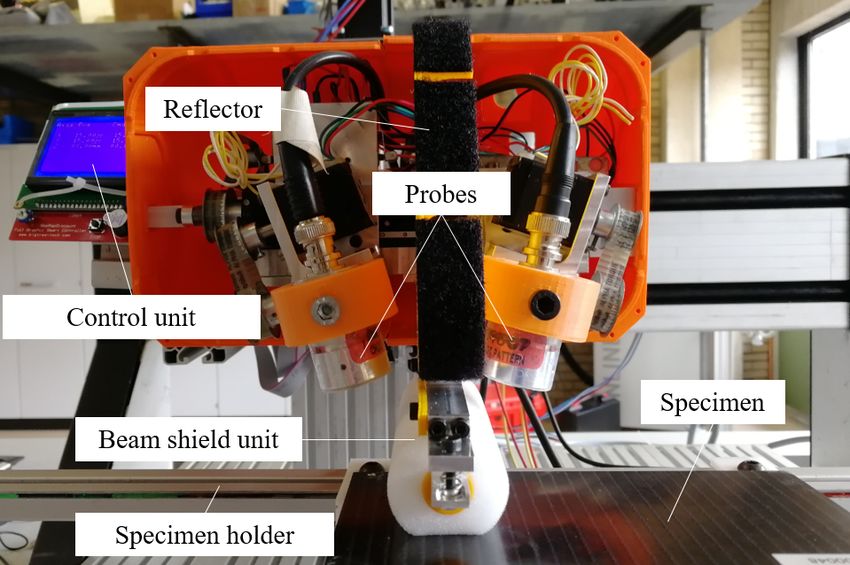
128                 Y. Bernhardt and M. Kreutzbruck: Integrated defect sensor for the inspection of fiber-reinforced plastics

coupled ultrasound (ACU; Gaal et al., 2012), which is a            3     Integrated defect sensor
contact-free testing method.
                                                                   3.1    Beam shield
2   Air-coupled ultrasound                                         The beam shield between both transducers is crucial for good
                                                                   sensor performance. On one side, the reflected and directly
For contact-free ultrasound, acoustic waves have to be trans-      transmitted signals need to be shielded (see Fig. 2), to not
mitted through the air directly. This leads to several obstacles   overdrive the receiving transducer. On the other side, the
that have to be overcome. One main obstacle is the large dif-      guided wave in the specimen should not be damped by the
ference of the acoustic impedance between a solid and air          high pressure which is applied by the beam shield.
which causes more than 99.9 % signal loss due to reflection.          To suppress unwanted sound signals, either reflexion or
Another main obstacle is that frequencies higher than 1 MHz        absorption can be used. By adapting a foam roll to the intro-
are not applicable, because the frequency dependent attenua-       duced sensor here, a combination of both shielding mecha-
tion will lead to signal reduction as well, and the signal will    nisms was used. Inside of the sensors head a 3D-printed re-
be smaller than the noise.                                         flector shield was assembled (Fig. 3). The foam roll has the
   The problem of the high impedance difference can be re-         advantage to easily roll over the specimen’s surface instead
solved by special probe design, high sound pressure and sen-       of causing too high of a pressure and damping the plate wave.
sitive low-noise amplification (Bhardwaj, 2001). Due to the        Foam-like beam shields that are sliding over the surface in-
strong reflections, air-coupled ultrasound is commonly used        stead of rolling can fold down due to the movement of the
in normal transmission mode. By using the slanted transmis-        sensor head and lose the ability to shield sound waves.
sion mode, it is possible to generate Lamb waves and gain
several decibels in the signal-to-noise ratio (SNR). The travel
                                                                   3.2    Incidence angle control algorithm
speed of Lamb waves depends on excitation frequency, plate
thickness and plate stiffness. Lamb waves traveling through        The correct angle of incidence is an important test parameter.
the material transfer their energy continuously to the air. This   Only when the transducers are set to a correct angle are high-
phenomenon is called “leaky Lamb waves”. Due to this ef-           amplitude dynamic levels possible. Practically a common so-
fect, ultrasonic waves are excited in air on both sides of the     lution is to manually vary the angle until a high-amplitude
specimen. It is possible to place an ultrasonic transducer ei-     level is reached. For an automatic system, the manual way
ther on the opposite side of excitation or on the same side (see   to find the angle which gives the highest amplitude is not a
Fig. 1). If the second transducer is placed at the same side, it   suitable solution. Therefore an automatic angle scanning sys-
is necessary to shield direct reflections from the specimen’s      tem was developed. Using two stepper motors, the incidence
surface. Therefore, a beam shield between the two transduc-        angle of both transducers is independently adjustable.
ers is mandatory. Castaings (Castaings, 1998) has developed           There are several ways to find an optimal angle of inci-
a method for using air-coupled ultrasound in single-sided ac-      dence. The simplest search algorithm is to sweep linearly
cess. In recent years air-coupled ultrasound was developed as      through the whole angle range and record the amplitude sig-
an NDT method in industrial use (Hillger, 2014). With a in-        nal in specific small intervals. The angle with the highest am-
tegrated single-sided air-coupled sensor, the incidence angle      plitude is the optimal angle of incidence. Another possible
of the probes can be adjusted automatically, and fast adapta-      way is by using a special optimization algorithm to find the
tions to new test scenarios are possible.                          signal with the highest amplitude in a faster way. One pos-
   The angle of incidence θ (see Fig. 1) for the excitation of     sible algorithm similar to the bisection method (Munz and
a Lamb wave with a specific travel speed in a plate cLamb can      Westermann, 2012) is to first define a specific angle interval,
be calculated using Snell’s law (Eq. 1),                           in which the highest amplitude is assumed. In Fig. 4 the bi-
                                                                   section procedure is shown schematically in a diagram. At
sin θ1    cair                                                     first, the amplitude signals on the boundaries and in the cen-
       =       ,                                            (1)
sin θ2   cLamb                                                     ter of the interval range are recorded. Second, the amplitude
where cair is the velocity of sound in air, θ1 is the incidence    levels of left boundary and right boundary are compared, and
angle of the incident wave and θ2 is the angle of the trans-       the next point is chosen in the middle of the interval between
mitted wave. Lamb waves travel perpendicular to the normal         the center and boundary with higher amplitude. With this
direction. This results in sin(θ2 ) = 1 and for the angle of in-   new points, the method is repeated several times, until the
cidence in Eq. (2).                                                residuum is small enough to assume convergence.

             cair                                                  3.3    Areal scan with air-coupled ultrasound in
θ = sin−1                                                   (2)
            cLamb                                                         re-emission
                                                                   After setting the correct angle of incidence on a test piece
                                                                   without defects, the next step is to perform a non-destructive

J. Sens. Sens. Syst., 9, 127–132, 2020                                                  www.j-sens-sens-syst.net/9/127/2020/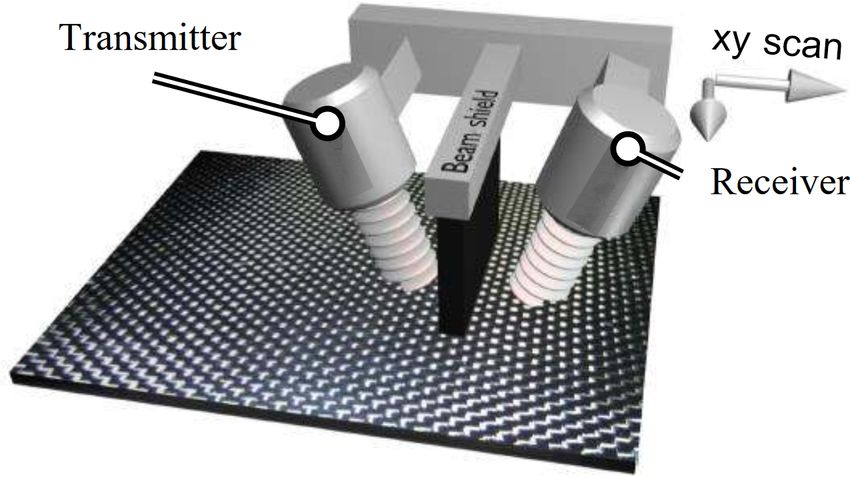
Y. Bernhardt and M. Kreutzbruck: Integrated defect sensor for the inspection of fiber-reinforced plastics                          129

Figure 1. Excitation of Lamb waves with air-coupled ultrasound. The Lamb wave is excited by the transmitter and propagates from the left
to right with a velocity of cLamb .

Figure 2. Schematic drawing of a beam shield in re-emission
(single-sided) setup. In green, blue and red the different paths of
possible wave propagation are shown.

                                                                      Figure 4. The bisection optimization method for finding the opti-
                                                                      mal angle of incidence.

Figure 3. Open ultrasound sensor including beam shield and two
slanted ACU probes.

                                                                      Figure 5. Setup for a C scan in re-emission, where the transmitter
                                                                      and receiver are placed on the same side of the specimen.
evaluation of the specimen. It is always assumed that the an-
gle optimization was performed on a flawless spot of the
specimen. While moving the sensor head over a carbon-
fiber-reinforced plastic (CFRP) part, the amplitude over time         ning line by line over a specific area and color-coding the
(A scan) changes in relation to the materials stiffness and           amplitude level in an x–y plot, a defect map is successively
thickness. Defects usually show different material behavior           created. These color maps are called a C scan. In Fig. 5 the
regarding the stiffness and sometimes thickness. While scan-          setup for C scans in re-emission is shown.

www.j-sens-sens-syst.net/9/127/2020/                                                       J. Sens. Sens. Syst., 9, 127–132, 2020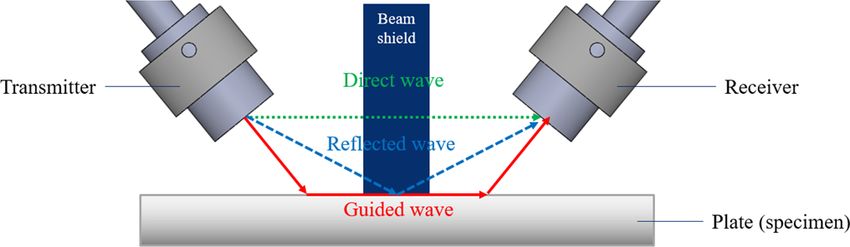
130 Y. Bernhardt and M. Kreutzbruck: Integrated defect sensor for the inspection of fiber-reinforced plastics
Figure 6. Schematic drawing of the test setup. The angles θ1 and
θ2 indicate the angles of incidence between the center axis of the
probe and a line normal to the specimen.
Figure 7. Results of a two-parametric incidence angle scan.
4 Test results and discussion
angle deviations in the opposite way. Differences in probe
The following tests were performed with the air-coupled that can influence the optimal angle of incidence can be de-
ultrasound system Airscope TT (Dasel Sistemas, Madrid, viations in frequency because of the frequency dependence
Spain) and with two circular, point-focused 200 kHz (fo- of Lamb wave velocity. Another point that can influence the
cal distance: 38 mm, active diameter: 13 mm) NCG200-D13- angle of incidence could be differences in the focusing of the
P38 transducers produced by the ultran group (State Col- probes. Using the symmetrical approach takes less time than
lege, PA, USA). The signal was preamplified using the low- the two-parametric scan.
noise amplifier ULTRASONIC PREAMP by Olympus K.K. In Fig. 8, the use of the optimization approach via bisec-
(Tokyo, Japan). The scans over flat specimens were per- tion is visualized. The necessary points for finding the opti-
formed with a three-axis scanning table FLACHBETTEIN- mal angle of incidence are not equally distributed over the
HEIT by isel® Germany AG (Eichenzell, Germany). The mo- angle range. Finding the angle using a symmetrical approach
tor control unit for the scanning table is the MotorMOTION takes less time than a two-parametric scan (10 s compared to
system (Dasel Sistemas, Madrid, Spain). The stepper motor 60 s), but the angle adjustment has to be done just once, and
controller for the angular scanning system is based on an with the two-parametric scan a higher SNR can be achieved.
Arduino Mega2560 controller together with a RAMPS 1.4 This can be explained with small differences in the center fre-
stepper motor driver. The controller was programmed so that quency of the probes. When the setup does not have exactly
the motors are controllable either by an external display or symmetrical parameters, the optimal angles are not symmet-
via USB. The automatic angle optimization tool was pro- rical.
grammed in MATLAB © (MathWorks, Natick, MA, USA).
The tests were performed with an overall amplification of 4.2 Areal scan
85 dB on the receiver side and with burst excitation on the
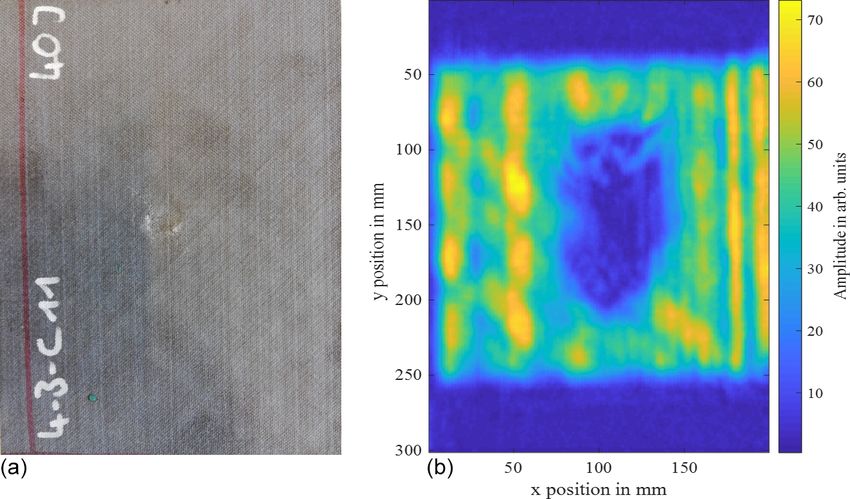
sender side (pulse train of six rectangular pulses at 200 V). A Quasi-isotropic carbon-fiber-reinforced plastic (CFRP)
schematic drawing of the whole setup is shown in Fig. 6. plates with a thickness of 4 mm were tested after an impact
with an energy of 40 J (drop test with an impactor with a
nose radius of 10 mm). A quasi-isotropic layup consists
4.1 Angular scan
of unidirectional CFRP layers with a fiber orientation at
The first tests were performed with a two-parametric-scan 0, 45, −45 and 90◦ with an equal distribution. On the
method on a flawless 4 mm thick poly (i.e., polymethyl impact side the defect can be barely seen (see Fig. 9a).
methacrylate; PMMA) plate. Using the two-parametric scan, This kind of damage usually shows large defect areas on
the incidence angles were swept independently. Theoreti- the backside. With a single-sided visual inspection, it is not
cally it is also possible to only change the angles symmet- possible to determine the real defect size. In many cases
rically. Results in Fig. 7. show that the maximum amplitude it is even not possible to access the backside. The right
is not reached at a symmetrical angle configuration but at image of Fig. 9 shows the results of an aerial ultrasonic
θ1 = 10◦ and θ2 = 14◦ (see Fig. 8). This angle deviation re- scan with air-coupled ultrasound. In comparison to the small
sults most probably from differences in the air-coupled ultra- impact damage on the photographic image, the dark-blue
sound probes. Switching the positions of the probes showed area in the center of the ultrasonic C scan shows the real
J. Sens. Sens. Syst., 9, 127–132, 2020 www.j-sens-sens-syst.net/9/127/2020/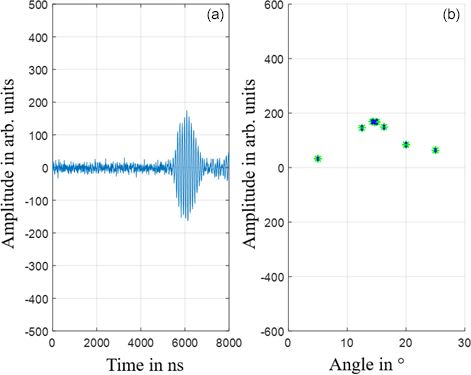
Y. Bernhardt and M. Kreutzbruck: Integrated defect sensor for the inspection of fiber-reinforced plastics                            131

                                                                    matched, it is still possible to use a symmetrical-angle ap-
                                                                    proach. Better results can be achieved by finding the opti-
                                                                    mal angle with a two-parametric scan. This procedure takes
                                                                    somewhat longer for finding the optimal amplitude, but the
                                                                    contrast between defect area and non-defect area will be
                                                                    higher. The NDT ACU system is suitable for combination
                                                                    with an automated six-axis robot system and a system for
                                                                    3D surface recognition. The latter helps to automatically per-
                                                                    form NDT on components, where no CAD information is
                                                                    available or fabrication tolerances are larger than the required
                                                                    positioning of the NDT sensor. Especially when it comes to
                                                                    testing plastic components like CFRP and GFRP (glass-fiber-
                                                                    reinforced plastic) in the field of transportation for applica-
                                                                    tions such as aircraft, train, automotive and wind power, the
                                                                    new approach can help to reduce testing time and increase
                                                                    the inspection quality.
Figure 8. A scan of (amplitude over time) of a Lamb wave (a).
Search pattern for the highest amplitude dynamic (b).               Data availability. The data presented in this article are stored in an
                                                                    internal system according to the guidelines of the German Research
                                                                    Foundation (DFG).

                                                                    Author contributions. YB is responsible for the sample prepara-
                                                                    tion, the construction of the prototype and the measurements. Both
                                                                    authors contributed to the NDT approach and the interpretation of
                                                                    the data. Both authors were involved in the writing process. YB and
                                                                    MK approved the final paper.

                                                                    Competing interests. The authors declare that they have no con-
                                                                    flict of interest.

Figure 9. Photography of the tested CFRP plate (a). C scan of the
tested plate (b).                                                   Special issue statement. This article is part of the special issue
                                                                    “Sensors and Measurement Systems 2019”. It is a result of the
                                                                    “Sensoren und Messsysteme 2019, 20. ITG-/GMA-Fachtagung”,
                                                                    Nuremberg , Germany, 25–26 June 2019.
defect size. The C scan is based on the following signal
processing: a time window of the first pulse is defined, and
the corresponding Fourier transformation is calculated for          Acknowledgements. The underlying research project, ADJU-
this time window and its main amplitude. While usually a            TANT, is funded within the ZIM program of the German Federal
standard minimum/maximum feature is used, the Fourier               Ministry for Economic Affairs and Energy (BMWi) on the basis
approach helps to focus on the amplitude of the main                of a decision by the German Bundestag. The authors would like to
excitation frequency.                                               express their gratitude for the funding.
   The resulting C scan of the impacted side shows the whole
defect area, hidden on the backside. Areas with low ampli-
tude on the top and bottom of the C scan result from bound-         Financial support. This  research has been supported by
ary effects due to the small specimen size.                         the Bundesministerium für Wirtschaft und Energie (grant no.
                                                                    ZF4041123DB7).

5   Conclusions                                                     This open-access publication was funded
                                                                    by the University of Stuttgart.
The sensor head for one-sided ACU testing made it pos-
sible to automatically conduct non-destructive testing on
CFRP parts. Defects are shown in an amplitude change of             Review statement. This paper was edited by Eric Starke and re-
the A scan. Even though the ACU probes are not exactly              viewed by two anonymous referees.

www.j-sens-sens-syst.net/9/127/2020/                                                      J. Sens. Sens. Syst., 9, 127–132, 2020
132 Y. Bernhardt and M. Kreutzbruck: Integrated defect sensor for the inspection of fiber-reinforced plastics
References Hillger, W., Bühling, L., and Ilse, D.: Air-coupled Ultrasonic
Testing-Method, System and practical Applications, 11th Euro-
Amendola, A., Iannuzzo, G., Cerreta, P., und Pinto, R.: Future pean Conference on Non-Destructive Testing (ECNDT 2014), 6–
aerostructure for the next generation green civil aircraft, Aero- 10 October 2014, Prague, Czech Republic, 2014.
days 2011, Madrid, 2011. Holmes, C., Drinkwater, B. W., und Wilcox, P. D.: Post-processing
Bhardwaj, M. C.: Non-Destructive Evaluation: Introduction of Non- of the full matrix of ultrasonic transmit-receive array data for
Contact Ultrasound, in: Encyclopedia of Smart Materials, edited non-destructive evaluation, NDT & E International, 38, 701–711,
by: Schwartz, M., John Wiley & Sons, New York, 690–714, ISSN 09638695, 2005.
2001. Munz, C. D. und Westermann, T.: Numerische Behandlung
Castaings, M., Cawley, P., Farlow, R., and Hayward, G.: Single gewöhnlicher und partieller Differenzialgleichungen, Springer-
Sided Inspection of Composite Materials Using Air Coupled Ul- Verlag Berlin Heidelberg, https://doi.org/10.1007/978-3-642-
trasound, J. Nondestruct. Eval., 17, 37–45, 1998. 24335-6, 2012.
Gaal, M., Döring, J., Bartusch, J., Lange, T., Hillger, W., Rahammer, M.: Nachweis von Impact-Schäden in Faserkunststof-
Brekow, G., und Kreutzbruck, M.: Ferroelektret-Prüfköpfe für fverbunden mittels Resonanter Frequenzsweep Thermografie,
berührungslose Ultraschallprüfung von faserverstärkten Kunst- Dissertation, Universität Stuttgart, Institut für Kunststofftechnik,
stoffen, DACH-Jahrestagung 2012 in Graz, 2012. 2018.
Gregory, R.: Rapid, Sensitive Inspection of Marine Composites us-
ing Laser Shearography, ACMC/SAMPE Conference on Marine
Composites Plymouth, 11–12 September 2003, ISBN 1-870918-
02-09, 2003.
J. Sens. Sens. Syst., 9, 127–132, 2020 www.j-sens-sens-syst.net/9/127/2020/You can also read