INVESTIGATIVE PROPERTIES OF CEO2 DOPED WITH NIOBIUM: A COMBINED CHARACTERIZATION AND DFT STUDIES - DE ...
←
→
Page content transcription
If your browser does not render page correctly, please read the page content below
Nanotechnology Reviews 2022; 11: 191–203
Research Article
Toyin Shittu and Mohammednoor Altarawneh*
Investigative properties of CeO2 doped with
niobium: A combined characterization and DFT
studies
https://doi.org/10.1515/ntrev-2022-0019 catalytic propensity of the material because the O atoms
received August 10, 2021; accepted November 30, 2021 will exhibit higher affinity for adsorbed reactants. Cerium
Abstract: Catalytic capacity of ceria mainly stems from a oxide (CeO2) after Nb doping displays a noticeable band
facile switch in the Ce oxidation states from +4 to +4 − x. gap narrowing, confirming the possible improvement in
While various experimental and computational studies the catalytic behavior. The 4d states of the Niobium pent-
pinpoint the reduction chemistry of Ce atom through oxide (Nb2O5) is found to fill up the 4f states of CeO2 around
the creation of oxygen vacancies, the analogous process the Fermi energy level promoting electrons excitation in the
when ceria surface is decorated with cations remains CeO2. Reported electronic, structural, and thermal charac-
poorly understood. Where such results are available, a teristics herein indicate promising catalytic applications of
synergy between experimental and first principle calcu- niobium-promoted ceria.
lation is scarce. Niobium materials are evolving and their Keywords: ceria, niobium pentoxide, particle growth, 4f
use in catalysis is being widely investigated due to their states
high surface acidity and thermal and chemical stability.
This study aims to report structural and electronic prop-
erties of various configurations of mixed Ce–Nb oxides
and elaborates on factors that underpin potential cata- 1 Introduction
lytic improvements. Evaluations of the samples through
X-ray diffraction (XRD), Fourier transform infrared (FTIR), Doped or pure metal oxides have been widely deployed
N2-adsorption–desorption, scanning electron microscope to improve the catalytic activity and selectivity of both
(SEM), energy dispersive spectroscope (EDS), and thermo- oxidation and reduction reactions through substitution of
gravimetric (TGA) analyses are examined and discussed. the cation of the base metal oxide with the cation of a
First principles density functional theory (DFT) calcula- second metal oxide [1]. Niobium pentoxide (Nb2O5) exhibits
tions provide structural features of the Ce–Nb solutions amorphous or crystalline structures, and possesses wide
at low concentration of Nb via computing atomic charge band gap, good chemical stability, efficient electron injec-
distribution. Contraction in the lattice parameter after Nb tion efficiency, and efficiently serves as acid catalyst for
doping was confirmed with both XRD and DFT results. the production of a wide array of chemicals and fuels [2,3].
SEM analysis reveals particle growth at the loading of Defected Nb2O5 synthesized either through incorporation
50 wt%. FTIR results established the Ce–Nb–O bond at of ad-atoms or oxygen exhibits promising catalytic capa-
1,100 cm−1 and the TGA analysis confirms the thermal sta- city in niche industrial operations [4,5]. The promotional
bility of Nb-doped ceria. Tetrahedral O atoms demonstrate effect of Nb2O5 as a second metal or metal oxide in opera-
an increase in electronegativity and this in turn facilitates tions such as catalysis is gaining attention due to the rela-
tive ease of their reaction with other metal oxides to form
mixed metal oxide phases with a complex structure [6].
This complex structure could result from the distortion of
* Corresponding author: Mohammednoor Altarawneh, Department niobium oxide deposited on the parent metal or originated
of Chemical and Petroleum Engineering, United Arab Emirates from the actual disruption of the chemical bonds at the
University, Sheikh Khalifa Bin Zayed Street, Al-Ain, 15551,
surface of the parent oxide [1,7]. In either case, electron
United Arab Emirates, e-mail: mn.altarawneh@uaeu.ac.ae
Toyin Shittu: Department of Chemical and Petroleum Engineering,
transfer occurs, and the active centers are the dopants or
United Arab Emirates University, Sheikh Khalifa Bin Zayed Street, the oxygen atoms close to the dopants, leading to a mate-
Al-Ain, 15551, United Arab Emirates rial behavior that departs from the pure metal oxides [1].
Open Access. © 2022 Toyin Shittu and Mohammednoor Altarawneh, published by De Gruyter. This work is licensed under the Creative
Commons Attribution 4.0 International License.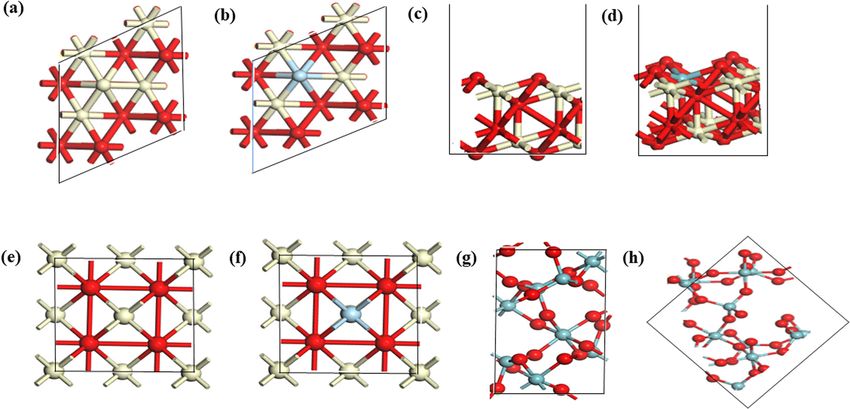
192 Toyin Shittu and Mohammednoor Altarawneh
The synthesis of a truly homogenous-mixed oxide with a 2 Materials and methods
profound improvement in catalytic activity is a channeling
endeavor. The presence of other materials such as impu-
2.1 Materials preparation
rities in the precursors might as well contribute to the
observed changes in their performance [1].
Cerium–niobium mixed oxide samples were prepared with
On the other hand, cerium oxide (CeO2) enjoys var-
the incipient wet-impregnation method. The cerium(IV)
ious applications due to the inherent electrical, chemical,
oxide (Sigma Aldrich; 99.99%) was first dried in an oven
and physical properties [8]. Stand-alone CeO2 has been
for 2 h at 200°C to drive out moisture. Nb2O5 (Sigma Aldrich;
effective in numerous catalytic applications, most promi-
99.99%) serves as the precursor with the loading of Nb2O5
nently in the semi-hydrogenation of alkynes to alkenes
varied from 1.5, 2.5, 3.0, and 50 wt%. Aqueous solution of
[9], and water and gas splitting reactions [10]. Due to
the samples was added to an identified mass of CeO2. The
their profound redox properties, efficient oxygen storage
resulting mixtures were heated at 70°C for 30 min on a
ability, and low cost, CeO2 has been deployed as mixed
magnetic stirrer at a stirring rate of 150 rpm. The samples
oxide catalyst for enhanced performance [11]. Among the
various metal oxides, CeO2 offers high interaction with were then dried overnight at 100°C. Calcination was carried
Nb2O5 [7]. As a reducible oxide, CeO2 could switch oxida- out under the flow of air for 4 h at 550°C with a heating rate
tion from Ce4+ to a reduced form as Ce4−x by interaction of 10°C/min. Powder X-ray diffraction (XRD) patterns were
with the Nb5+ of the niobium oxide [12]. This phenom- recorded on X-ray diffractometer (PANalytical Instrument,
enon induces a notable effect on the chemistry of the X’Pert3 Powder, Philips, Holland) equipped with CuK radia-
mixed oxide formed. The selective catalytic reduction tion (k = 1.540598 nm) and operated at 45 mV and 40 mA.
(SCR) performance of CeO2 displays significant improve- The scanning was performed within 2θ range of 10–80° with
ment when doped with niobium oxide owing to the a step size of 0.02°/min. A Quantachrome Instrument
strong acidity and redox ability of the latter [12]. A (NOVAtouch NT 2LX-1, USA) performed the N2 adsorption
100% selectivity to N2 was achieved for NOx reduction and desorption experiment. All the catalyst samples were
in NH3-SCR reaction when cerium was doped with outgassed at 300°C for 3 h utilizing liquid nitrogen (N2) at
niobium [13–15]. the temperature of −196°C. The Brunauer–Emmett–Teller
To provide an atomic base insight into the observed (BET) surface areas were computed by employing partial
catalytic improvement of mixed Ce–Nb oxides, it is pressure (P/P0) in the ranges of 0.02–0.35, which are
essential to comprehend governing structural and elec- reliable based on the obtained C constant values [17].
tronic attributes of these configurations. For instance, The Barrett–Joyner–Halenda (BJH) was used to determine
doping metal oxides that display dissimilar cation– the average pore size and the pore size distribution
oxygen bond lengths affects their catalytic behavior; with P/P0 range of the desorption branches of 0.80–0.35.
however, a robust evaluation of such scenario necessi- The Fourier Transform Infrared (FTIR) analysis was per-
tates materials modeling via density functional theory formed with FTIR Spectrometer (Jasco Corporation, Japan).
(DFT) calculations [1]. Experimentally, the various avail- Before analysis, the catalyst samples were mixed with
able spectroscopy techniques could be used to underpin potassium bromide (KBr; Sigma Aldrich) initially dried in
structural changes from the pure metal oxides after doping. the oven at 105°C in order to eliminate possible water
Literature provides a detailed account on pure oxide forms interference. The recorded spectra were varied in the range
of CeO2 and Nb2O5 [16]. However, to the best of our knowl- of 4,000–400 cm−1. A multifunctional general-purpose
edge, studies that report properties of the mixed Ce–Nb scanning electron microscope (SEM) by (JEOL JSM. 6010
oxides from both experimental and DFT studies are rather PLUS/LA) integrated with Energy Dispersive Spectroscope
scarce. (EDS) was used to perform surface and elemental analyses.
Thus, this article aims to evaluate the energetic, atomic, The instrument is equipped with an auto-coater which enables
and electronic features of clean, defect-free, and doped the sample to be coated with gold particles before analysis. In
CeO2(111) and Nb2O5(111) structures using DFT and to con- order to investigate the thermal stability and the composition
firm the formation of the mixed oxides using material char- of the pure and prepared samples, Thermogravimetric analysis
acterization techniques. The main motivation behind this (TGA) was carried out with (TGA Q50 V20.10 Build 36 ana-
work is to illustrate attributes that may improve the catalytic lyzer). The temperature was changed from 0 to 650°C at a
activity of Nb–Ce–O materials. heating rate of 10°C/min under the flow of nitrogen.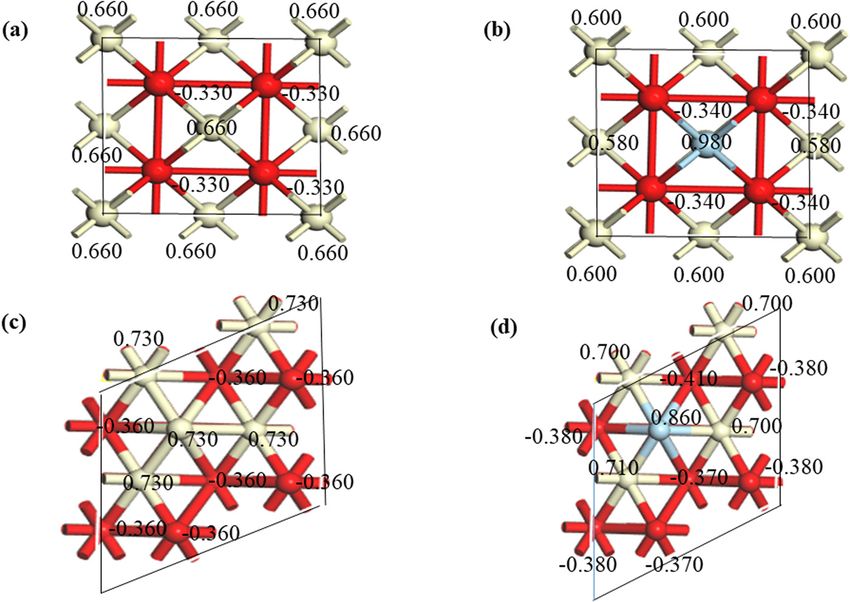
Properties of CeO2 doped with Nb: A combined characterization and DFT studies 193
2.2 Computational details
The CASTEP code performs all the structural optimi-
zations and energy estimations [18] within the DFT fra-
mework to examine the properties of CeO2 and Nb2O5.
Generalized gradient approximation is employed to obtain
precise structural parameters and the exchange–correla-
tion function of Perdew–Burke–Ernzerhof is adopted in
the local density approximation. On the fly pseudopoten-
tial describes the interaction between the valence electron
and the ion core. The energy of the convergence tolerance
is set at 0.001 eV/atom. The maximum force, maximum
stress, and maximum displacement are set at 0.03 eV/Å,
0.05 GPa, and 0.001 Å, respectively. To describe the on-
site Coulomb interactions for the Nb 4d and Ce 4f states,
effective Hubbard U parameters of 3.0 and 4.5 eV are Figure 1: XRD patterns of the prepared catalyst samples.
employed, respectively. This choice of U value follows
from previous theoretical investigations [19,20]. The plane
wave cutoff energy amounts to 320 eV and a κ-point sam- This signifies that the crystallinity of the CeO2 is not dis-
pling of 2 × 2 × 1 was generated by the Monkhorst–Pack torted with Nb incorporation [1,22,24,25]. However, at a
scheme. The doping is performed by substituting the Ce 50.0 wt% Nb loading, the effect of loading is observable
atom of the CeO2 with Nb, and the electronic changes are with the formation of two new peaks from Nb2O5 around
examined. Appropriate choice of dopant concentration is 22° and 50°.
essential to preserve the catalytic activity of the materials. The lattice parameters were computed from the XRD
Low concentration of dopant is preferred over the high peaks in order to investigate the doping effect. The inter-
value because the recombination rate of electron/hole planar spacing was evaluated with the Bragg’s law, equa-
pair is decreased and the reaction rate such as photode- tion (1), and the lattice parameter was calculated with
gradation is improved [21]. Thus, computations are per- equation (2). The crystallite sizes of the samples were
formed by replacing the Ce atom with one Nb atom. computed with the Scherrer’s equation (equation (3)) by
utilizing the full width at half maximum (FWHM).
nλ
d= , (1)
2 sin θ
3 Results and discussion a=d⋅ h2 + k 2 + l 2 , (2)
kλ
3.1 XRD patterns D= , (3)
β cos θ
The diffraction patterns observed for the referenced pure where d signifies the inter-planar spacing, λ is the wave-
CeO2 and all the prepared catalysts are shown in Figure 1. length, a is the lattice parameter, h, k, and l denote the
Conventionally, doped oxide displays a similar structure miller indices, β is the FWHM, k is the Scherrer constant,
as that of the host oxide [1]. The patterns observed are D represents the crystallite size, and θ stands for the
typical of the pure fluorite cubic CeO2 structure (JCPDS Bragg or diffraction angle. The equations were applied
43-1002) [22]. All except one (50 wt% loading) of the XRD to the peak highest intensity, CeO2(111) plane. The results
results show an absence of the peaks associated with obtained are shown in Tables 1–3. The pure CeO2 gave the
Nb-containing species. This might be due to either low highest value of the lattice parameter 5.410 Å which is in
loading or high dispersion. In our experiment, the Nb good agreement with previous experimental values of
loading exceeded the optimum solubility weight of 5.410 Å [26,27] and computed values of 5.490 Å [28].
Nb (1.4 wt%) on CeO2, appropriately, the absence of The doped samples assume lower lattice parameter.
Nb peaks is ascribed to a high dispersion [23]. The dis- This decrease in value is associated with the contraction
persed state of Nb2O5 phase on the CeO2 is in the NbOx of the CeO2 lattice, and the possible substitution of the
form and the presence as metallic Nb cannot be excluded. Ce4+ by the Nb5+ [29,30]. This is due to the lower ionic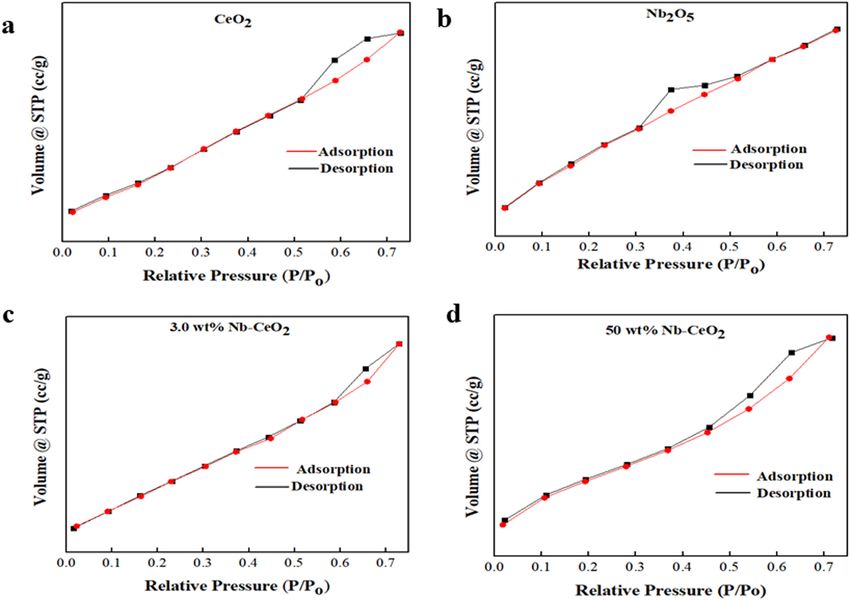
194 Toyin Shittu and Mohammednoor Altarawneh
Table 1: Miller indices of the XRD peaks shown with the SEM results [25]. However, this assertion
remains valid at low loading. Increasing the Nb loading
N 2θ Θ sin θ sin2 θ Ratio Index D was found to affect the CeO2 phase, with the formation of
1 28.54 14.270 0.2465 0.0607 3 111 3.12384 new peaks at the highest loading. The slight increase in
2 33.11 16.555 0.2849 0.0812 4 200 2.70270 the intensity at the (311) plane corresponding to the peaks
3 47.55 23.775 0.4031 0.1625 8 220 1.91020 at 2θ = 56.37° confirms that the amorphous Nb2O5 is incor-
4 56.37 28.185 0.4723 0.2231 11 311 1.63032 porated into the CeO2 crystals and that the CeO2 content is
5 59.16 29.580 0.4936 0.2437 12 222 1.55997
decreased, compensating for the minute decrease in the
6 69.53 34.765 0.5702 0.3251 16 400 1.35040
7 76.73 38.365 0.6207 0.3852 19 331 1.24053
crystallinity [13,32].
8 79.17 39.585 0.6372 0.4061 20 420 1.20841
3.2 FTIR analysis
Table 2: Inter-plane spacing and lattice parameters of the prepared
samples
The FTIR results present the possible presence of the Nb
Sample 2θ Θ D A phases on the CeO2 as shown in Figure 2. All the Nb-
doped CeO2 samples show the absence of the carboxylic
Pure CeO2 28.54 14.270 3.12384 5.41065
groups C]O stretching at 1,700 cm−1 and C–O asymme-
1.5 wt% Nb–CeO2 28.59 14.295 3.11849 5.40138
2.5 wt% Nb–CeO2 28.65 14.325 3.11209 5.39031 trical stretching at 1,380 cm−1 that are typical of Nb cont-
3.0 wt% Nb–CeO2 28.66 14.330 3.11103 5.38846 aining species. This is indicative that the sample contains
50 wt% Nb–CeO2 28.70 14.350 3.10679 5.38111 only Nb2O5 [17]. The spectra of the Nb2O5 exhibits the sur-
face Nb]O stretches at the region of 1,050–948 cm−1 [33].
The Nb–O peak at 929.52 cm−1 denotes the stretching
radius of niobium (0.64 Å) compared with cerium (0.97 Å) vibrations of Nb–O of NbO6 units and the Nb–O peak at
which induced the contraction of the crystal lattice [31]. 880 cm−1 is due to angular vibrations [33]. In addition to
The incorporation of neodymium (Nd) into CeO2 expands the OH groups on pure CeO2, the characteristic stretch-
the crystal lattice owing to the higher ionic radius of Ce4+ ing vibrational peaks associated with the Ce–O bond is
(0.970 Å) when compared to Nd3+ (1.109 Å) [10]. The shifts observed around 590 cm−1 [34].
in lattice parameter are vital in confirming the formation The characteristic peaks associated with the lattice
of doped oxide [1]. This assertion is further corroborated vibrations of metal–oxygen bonds are observed for the
with the result of the crystallite size enlisted in Table 3.
Although significant variations in the crystallite size of all
the samples were not prevalent, (maximum difference
of ±1.8), this difference further supports the formation of
doped oxides. This is in agreement with the findings of
Amarsingh [31] that the substitution of pentavalent ions
such as Nb in CeO2 does not initiate significant reduction
in the crystallite size. Thus, pure CeO2 affords the highest
size of 26.154 nm. Additionally, the minute reduction in the
crystallite size suggests that the incorporation of Nb into
CeO2 crystal inhibits the grain growth of the CeO2, as later
Table 3: Crystallite size of the prepared samples
Sample Crystallite size (nm)
CeO2 26.154
1.5 wt% Nb–CeO2 24.354
2.5 wt% Nb–CeO2 25.328
3.0 wt% Nb–CeO2 25.932
50 wt% Nb–CeO2 28.707
Figure 2: FTIR spectral of the pure and doped samples.
Properties of CeO2 doped with Nb: A combined characterization and DFT studies 195
Nb-doped samples with the increase in the loading. The associated with the Nb–O and Nb–O–Nb bonds present in
peak observed around 1,123 cm−1 is typical of Ce–Nb–O NbOx species. Increasing Nb loading beyond the disper-
spectral which affirms the formation of doped mixed oxide sion capacity will limit the formation of the Brønsted and
sample [35]. With the additional loading, the Nb]O dis- Lewis acid sites [13]. However, as observed at 50 wt%
appeared (at 50 wt% Nb–CeO2), and the observed broad- loading, the broad and intense peak of NbO reappeared.
ened peak of Nb–O shows the incorporation of the nio- This suggests that a very high loading diminishes the cat-
bium ions into the CeO2 lattice, resulting in little distortion alytic activity of cerium-niobium mixed oxide. Exceeding
[23,31,36]. In comparison to the pure CeO2 spectra, the the monolayer coverage will lead to the formation of multi-
stretching mode vibration of Ce–O at around 590 cm−1 in layer inactive NbOx.
the other samples shifted to a lower wavenumber. This
indicates the weakening of this bond in favor of the for-
mation of the Ce–Nb–O linkage [31,37].
The intensity of the peak of Nb–O identified at wave- 3.3 N2 adsorption–desorption
number of 929.52 cm−1 on the pure Nb2O5 sample becomes
lessened as the Nb2O5 loading was increased from The isotherms plot and the structural properties of
1.5 wt% to 3.0 wt%. This shows that the further addition the prepared samples obtained with the N2 adsorption–
of Nb might facilitate the reduction in NbO to metallic Nb desorption analysis are depicted in Figure 3 and Table 4,
[13]. Thus, the interaction of Nb with CeO2 is strengthened, respectively. All the prepared sample shows a typical
while the interaction between Nb–O and CeO2 is weakened. type IV isotherms associated with the capillary conden-
Also, higher Nb loading enhances both the Brønsted sation in mesopores. The pure samples show the H1 type
acidity and strong Lewis acidity. These acidic sites serve hysteresis loop and the addition of Nb to CeO2 preserves
as the active centers for surface-assisted reaction and are the H1 type. This observation is consistent with the earlier
Figure 3: N2 adsorption–desorption isotherms for the prepared samples. (a) CeO2; (b) Nb2O5; (c) 3 wt% doped, and (d) 50 wt% doped
Nb-CeO2.
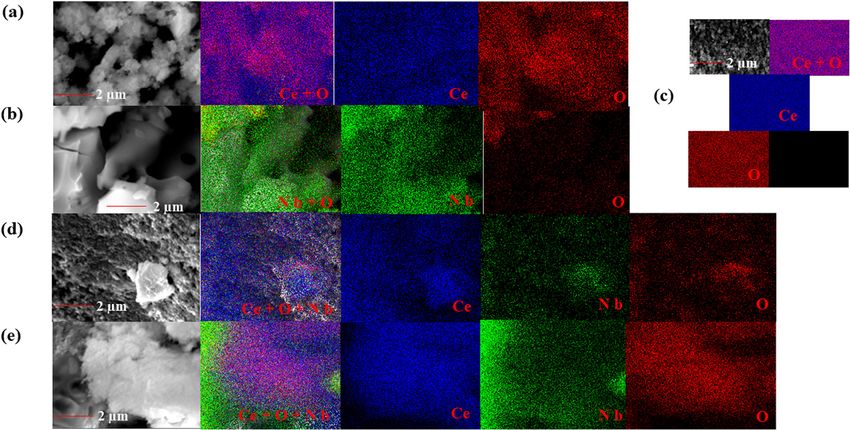
196 Toyin Shittu and Mohammednoor Altarawneh Table 4: BET surface area and pore volume of the catalyst samples Sample BET surface area (m2/g) Pore volume (cc/g) Pore diameter (nm) CeO2 50.437 0.021 3.319 Nb2O5 38.451 0.032 3.309 1.5 wt% Nb–CeO2 43.815 0.017 3.294 2.5 wt% Nb–CeO2 43.114 0.018 3.296 3.0 wt% Nb–CeO2 41.741 0.018 3.306 50 wt% Nb–CeO2 40.833 0.017 3.318 report involving Nb–CeO2-doped catalysts [38]. The values Nb on the samples’ inter-particle volume. This is supported of the pore diameter obtained for all the samples show a by the slight decrease shown in the pore volume [13]. mesoporous structure. The pore cerium oxide gives a par- Similar results have been reported for the nanostructured ticle size of 3.4 nm in agreement with the values between CeO2 doped with platinum [40]. 3.24–3.89 nm earlier reported for ceria prepared via precipi- tation method [39]. Likewise, the pore volume obtained for all the samples is approximately constant despite increasing the Nb loading, suggesting the samples entail a narrow 3.4 SEM and EDS analyses particle size distribution [40]. However, the observable dif- ferences result from the evaluated BET surface area. The The elemental composition, morphology, and shape of the Nb2O5 gives the lowest surface area of 38.451 m2/g, while prepared samples are analyzed with the SEM. The SEM a value of 50.437 m2/g is obtained for CeO2. Loading the images and EDS mapping of the cerium oxide and the nio- CeO2 with Nb decreases the surface area from 43.815 m2/g bium-doped cerium oxide are displayed in Figures 4 and 5. at 1.5 wt% Nb–CeO2 to 40.833 m2/g at 50 wt% Nb–CeO2. The The pure cerium particles show cerium as fine and well minimal reduction observed among the doped materials in dispersed, with uniform morphology and with the absence the BET surface area might have evolved from the blocking of any specific shape [24,41]. This fine structure suggests effect on the sample pores due to the incorporation of the that CeO2 is able to withstand the operational temperature Figure 4: SEM images and EDS mapping obtained for the materials (a) CeO2; (b) Nb2O5; (c) 2.5 wt% doped, (d) 3 wt% doped, and (e) 50 wt% doped Nb–CeO2.
Properties of CeO2 doped with Nb: A combined characterization and DFT studies 197
Figure 5: EDS plots obtained for the materials (a) CeO2; (b) Nb2O5; (c) 1.5 wt% doped, (d) 2.5 wt% doped, (e) 3 wt% doped, and (f) 50 wt%
doped Nb–CeO2.
employed during the calcination process [39]. The mor- doped samples [43]. The EDS profiles confirm the presence
phology of the pure Nb2O5 discloses fine particles together of only cerium, niobium, and oxygen on all samples. For
with agglomerated and sponge shaped particles. The doped the pure samples, the identified oxides are CeO2 and
samples present similar structure as that of the pure CeO2 Nb2O5, confirming the purity of the starting materials.
sample at low to moderate loading of 1.5–3.0 wt% of Nb. Weak peaks associated with Nb atoms are observed on
Figure 4 demonstrates the EDS mapping of the pre- the doped CeO2 samples.
pared samples. CeO2 and Nb2O5 reveals a homogenous Additionally, the quantitative EDS analysis reveals
well dispersed atoms of the constituent elements. The that increase in the loading weight gives a corresponding
addition of 1.5 and 2.5 wt% of Nb do not show any pre- increase in the amount of Nb deposited on the CeO2. The %
sence of Nb atoms in the mapping analysis (Figure 4c, atomic composition predicts the formula for the 1.5 wt%,
only 2.5 wt% loading is present). However, as confirmed 2.5 wt%, 3.0 wt%, and 50.0 wt% samples as Ce0.985Nb0.015O2,
by the EDS profiles later, there is the presence of Nb Ce0.975Nb0.025O2, Ce0.97Nb0.03O2, and Ce0.5Nb0.5O2, respec-
atoms at this loading values. This can be attributed tively. This further affirms the incorporation of the Nb into
to the very high dispersion and incorporation of the Nb the CeO2 lattice and the reduction in the Ce atom.
atoms into the CeO2 [42]. Increasing the loading to 3 wt%,
Nb atoms are detected by the EDS mapping (not too con-
spicuous), and the atoms are well dispersed over the CeO2 3.5 TGA analysis
surface. This further confirms that the non-detection of
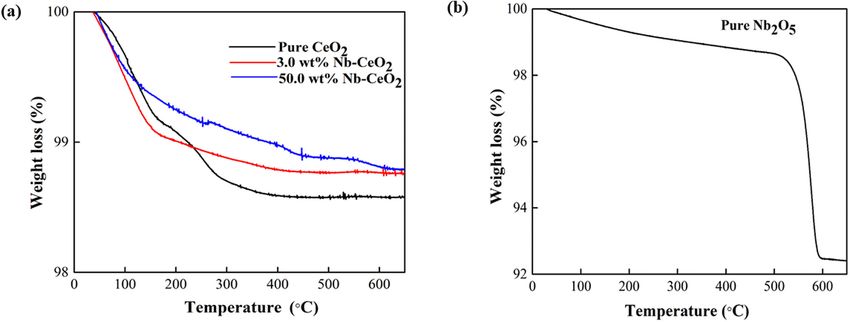
the Nb atoms at lower loading cannot solely be attributed Figure 6 shows the TGA measurements obtained for pure
to complete absence of Nb atoms. The Nb atoms becomes CeO2 and Nb2O5 samples. In order to determine the
more feasible at 50 wt%, with the high concentration thermal effects on the doped oxides, only samples with
at the corner of the sample. This might have resulted 3.0 and 50 wt% are considered. Pure CeO2 shows a mass
from the possible Nb agglomeration due to high loading. loss of about 1.4%, and equilibrium is reached at about
Additionally, the high dispersion observed at low load- 350°C. This loss is ascribed to the H2O present in the
ing of Nb loading together with the reduction in the sample surface [10]. This result is in good agreement
calculated values of crystallite size indicates the strong with mass loss of about 1.3% and 350°C that was reported
interaction between the CeO2 and Nb2O5 oxides of the earlier [10]. Similarly, the doped samples show a mass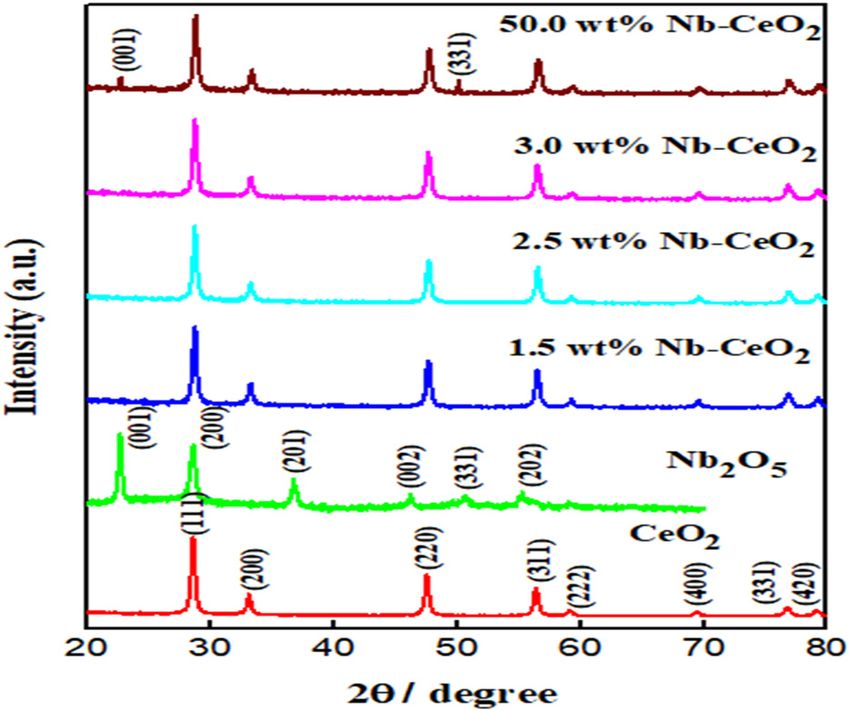
198 Toyin Shittu and Mohammednoor Altarawneh
Figure 6: TGA results of the prepared samples (a) CeO2, 3 wt% doped, and 50 wt% doped Nb-CeO2 and (b) Nb2O5.
loss at about 1.1%, suggesting that the crystallinity of and slightly shrinks to 5.284 Å after Nb doping. This
CeO2 is preserved after the doping [44]. The impregnation reduction trend agrees with the XRD prediction where
of Nb in CeO2 is found to affect the thermal stability of the the lattice parameters reduce with increase in the loading
doped samples, reducing the mass loss as the tempera- weight of Nb. Although, our calculation result gives a
ture is raised [45,46]. This is corroborated with the result sizeable reduction in the lattice parameter as compared
of enhanced thermal stability obtained for the pure Nb2O5 with XRD values, both results confirm that Nb doping
samples. Two stages of mass loss are observed for the reduces the lattice parameter [1].
Nb2O5. Stage 1 (about 1.5% loss), the interval 50−450°C Table 5 enlists the bond length of the considered
encompasses the elimination of the adsorbed H2O, and structures. Generally, Ce–O bond distance is used to vali-
stage 2 (6.2% loss) between 450 and 600°C signifies the date the possible expansion or contraction of the crystal
loss of structural H2O [44,47,48]. As observed, after about lattice of doped materials. Ionic radius of dopants is
450°C, all the samples assumed a steady value, thus the essential in determining the behavior of the bond length.
calcination temperature was kept below 600°C. Earlier reports have provided contrasting observation.
For instance, CeO2 doped with Yb, Er, and Y presents
a similar Ce–O and dopant-oxygen distances, while for
Gd, Sm, La dopants, observed distances were higher for
3.6 CeO2 structure and charge distribution the dopant-oxygen than the Ce–O distance. It is expected
analysis that dopants with higher ionic radius than Ce should
induce higher dopant-oxygen distance, and dopants having
The effect of Nb content on CeO2 has been evaluated with lesser ionic radius should give lesser bond distance. This is
the DFT calculations. The electronic interaction and dis- not always true, because similar distance was observed for
tribution are examined on the CeO2(111) structure. CeO2 Ce–O and Yb–O, Er–O and Y–O, despite Yb, Er, and Y
exhibits a fluorite crystallographic structure with the Ce possessing higher ionic radius [49].
atoms located at the face center cubic (fcc) positions, Perfect CeO2 shows a Ce–O bond length of 2.370 Å,
while the O atoms prefer the tetrahedral sites. Addition which is in a perfect agreement with 2.352 Å and 2.340 Å
of the Nb atoms preserves the fluorite structure, a result reported previously [10,27]. The Ce–O distance in the
previously confirmed with our XRD analysis. perfect CeO2 demonstrates an overshoot of 0.073 Å in
Figure 7 shows the optimized geometries of the bulk the bulk as compared to the surface. In comparison
and surface structures of both the perfect CeO2(111) and with the doped structures, the Ce–O distance shortens
niobium-doped structures. The optimized bulk and sur- by 0.011 Å for the bulk, while an increase of 0.066 Å is
face geometries of Nb2O5(111) are likewise shown. The observed for the surface (in reference to experimentally
lattice parameter of the perfect CeO2 stands at 5.464 Å measured value for the bulk CeO2). The Nb–O bond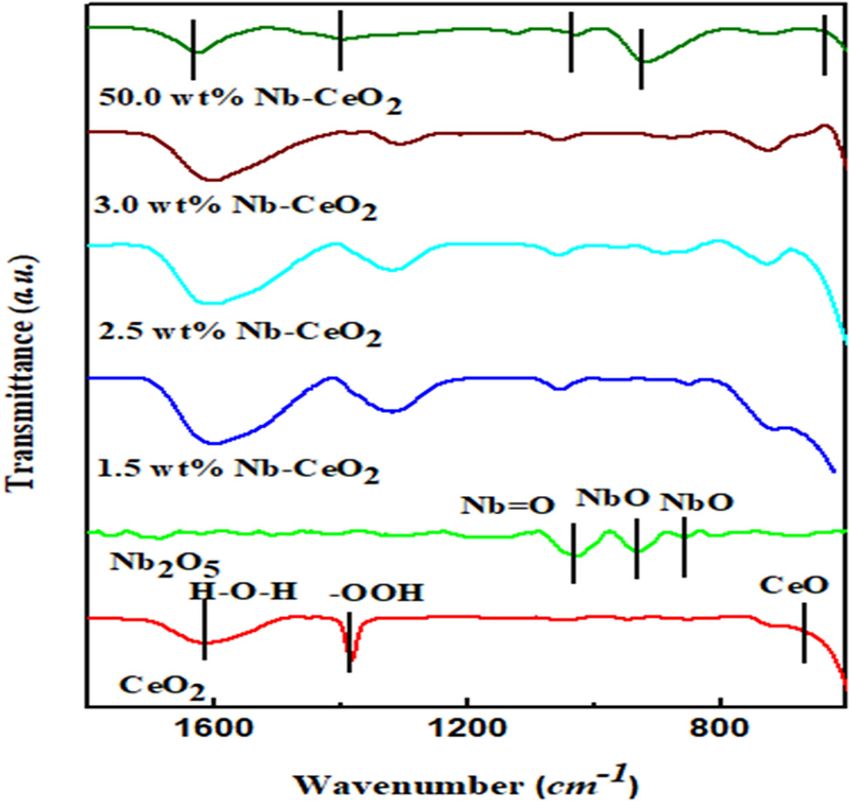
Properties of CeO2 doped with Nb: A combined characterization and DFT studies 199
Figure 7: Structural geometries of (a) top view of un-doped, (b) top view of doped, (c) side view of un-doped, and (d) side view of doped
CeO2 surfaces (slightly bent); (e) un-doped bulk and (f) doped bulk CeO2; (g) bulk Nb2O5; and (h) Nb2O5 surface. Red, grey, and light blue
spheres refer to oxygen, cerium, and niobium atoms, respectively.
distance amounts to 2.287 Å for the bulk and 2.127 Å for tetrahedral O atoms are improved with a charge increase
the surface, which reasonably agrees with the experimen- of 0.01 e. This is expected to improve the catalytic ten-
tally reported values of 1.73–2.26 Å [50]. The Nb–O dis- dency of the material since the O atoms will assume
tance in the pure Nb2O5 structure is shorter in the surface more affinity for adsorbed reactant [51]. Simultaneously,
than the corresponding value in the bulk by 0.16 Å. After after doping, the Ce atoms are less positively charged
doping, the Nb–O is found to reduce by 0.096 Å for the (i.e., there is presence of more electrons), suggesting
bulk and by 0.187 Å for the surface. that the Nb atoms derives more reduction on the two Ce
Thus, our result demonstrates that doping Ce with Nb atoms bounding the tetrahedral O atoms, engendering
ensures the reduction in the Ce–O and Nb–O distances, the Ce atoms more reactive. The edge and corner Ce
which corroborates the result of the lattice parameter. atoms surrounding the bulk CeO2 are likewise reduced
The contraction in the bond length of both Ce–O and to that obtained for the perfect bulk structure. This is
Nb–O bonds obtained with DFT is indicative of the con- a desirable result for improved catalyst performance,
traction of the oxygen atoms and not the Nb environment ratifying the possible interswitch of Ce atom oxidation
itself. state between Ce4+ to Ce4−x [10]. Analysis of the atomic
Figure 8 shows a disparate charge distribution for the charge on the surface structures presents similar trend
bulk and surface structures of the perfect and Nb-doped observed for the bulk structure. The Ce atoms on the
CeO2. The perfect bulk structure shows that the atomic perfect surface exceeds that of the bulk by 0.07 e, while
charge on O atom are constant at −0.330 e, while the Ce the O atoms is 0.03 e which is higher. Doping the surface
atom maintains a positive charge of 0.660 e throughout presents a lower negative charge for all the O atoms on
the structure. Introducing the Nb atom to the bulk struc- the surface, this will expedite their removal as oxygen
ture reveals that the electronegativity values of the molecules during reduction reactions [9].
Table 5: Bond distance (Å) of the optimized structures
Bond type Perfect Perfect CeO2 Doped Doped CeO2 Perfect Perfect Nb2O5
CeO2 (bulk) (surface) CeO2 bulk surface Nb2O5 bulk surface
Ce–O 2.443 2.370 2.432 2.436 — —
Nb–O — — 2.191 1.940 2.287 2.127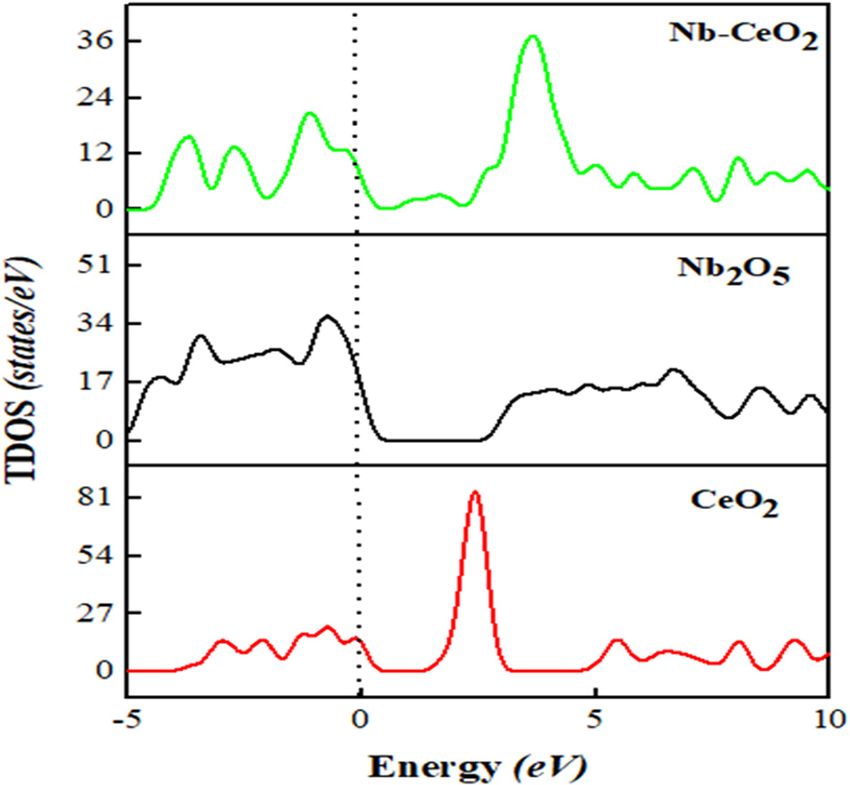
200 Toyin Shittu and Mohammednoor Altarawneh
Figure 8: Atomic Hirshfeld charges (in e) of (a) un-doped bulk, (b) doped bulk, (c) un-doped surface, (d) and doped surface of CeO2(111).
3.7 Analysis of total and partial density of surface un-doped CeO2. The band width is examined
states (TDOS and PDOS) of CeO2 and between −5 and −20 eV for all structures. The pure bulk
Nb2O5 CeO2 reveals the concentration of electrons with a narrow
band within the 0–5 eV region, and a relative electron
The TDOS and the PDOS are calculated to explicate the distribution at a higher energy. Our calculated band gap
electronic states of the prepared samples and to provide of Nb2O5 amounts to 3.037 eV, a value that is in a very good
information germane to contribution of the orbitals around accord with the corresponding experimental measurement
the Fermi energy level (Ef = 0 eV, represented by the dotted of 3.09 eV [21]. The electron concentration in the doped
lines) [52]. Figure 9 shows the DOS of both the bulk and sample, Nb–CeO2, shifts to a higher energy level and
demonstrates a band gap of 1.086 eV (that is, a reduction
of 0.614 eV), in a close agreement with the analogous
experimental value which shows a reduction of 0.59 eV
in the band gap for Pb–CeO2 system [53]. This reveals
that lower unoccupied molecular orbital and higher un-
occupied molecular orbital are shortened, accounting for
improved electron excitation into the conduction band.
The band gap reduction observed shows that Nb will sig-
nificantly promote the optical and catalytic properties of
the mixed oxide [21].
Figure 10 portrays the PDOS of the prepared samples.
The O 2s and Ce 3p states lie at the lowest energy band
(not shown) and the O 2p and Ce 4f states interact around
the Fermi energy level with a hybridization of the Ce 5d
and Ce 4f states [54]. The bandwidth of the O 2p band is
4.2 eV and the Ce 4f states exhibit a spacing of 1.5 eV
which agrees with the computational values of 4.5 and
1.4 eV for O and Ce, respectively [28]. Our computed
values for O 2p–Ce 5d orbitals band gap shows a band
Figure 9: TDOS of the samples. separation of 5.7 eV, which is in a good agreement withProperties of CeO2 doped with Nb: A combined characterization and DFT studies 201 Figure 10: PDOS plots of (a) Nb-doped CeO2, (b) un-doped CeO2, and (c) Nb2O5. literature values reported between 5.3–5.7 eV [28]. Nb2O5 electron transfer between atoms of similar doped sys- reveals an O 2p bandwidth of 6 eV mainly concentrated at tems [56]. the top of the valence band. The Nb 4d states span between −5 eV and 8 eV. The p and d electrons are found to be active at the Fermi level, with some contribution of Nb 2p states around the conduction band leading to high 4 Conclusion interaction between the O-2p, Nb-4p, and 4d states. There is an overlap between the Nb 4p states and 2p states at Nb2O5 is found to improve the properties of CeO2 in terms the regions of 2–6 eV. The Nb-doped CeO2 shows that, of the narrowed band gap and the electronic states of the in addition to the occupied Ce 4f states around 2 eV, Ce and O atoms. Experimental results of XRD confirm the more 4f electrons that are absent in the pure CeO2 formation of new peaks associated with Nb at high now concentrates around 4–6 eV (segment marked with loading, and the EDS analysis detects the presence of arrow). The presence of excess electrons can either be Nb. There is a narrow distribution of the crystallite size initiated through the creation of oxygen vacancies or the of the prepared samples with the reduction in BET surface addition of dopant. These excess electrons would occupy area as the Nb loading increases. TGA analysis predicts the Ce 4f states, localizing on individual Ce atoms [28]. that the calcination temperature should be limited to This infers that the f states occupation observed herein below 600°C. DFT calculations support the experimental originates from the addition of Nb atoms. In addition, observation pertinent to the decrease in the lattice para- the Nb 4d electrons which are conspicuous in the pure meter of the CeO2 when Nb atom is incorporated. The Nb2O5 sample is redundant after doping, indicating the Hirshfeld charges reveal the reduction in Ce atom after possible electron transfer to the Ce 4f states, thus, reducing Nb doping with maximum reduction in the Ce atoms the Ce4+ to Ce3+. The availability of Ce3+ is known to pro- nearer to the Nb atom. The electronegativity values of mote catalytic reactions, and the excess electron gain by the tetrahedral O atoms are increased by 0.01 e after Nb the 4f would give rise to n-type conductivity and the doping. This will promote the catalytic tendency of the charge carrier in the band [55]. Similar analogy involving material since more O atoms will exhibit higher affinity peaks shortening and disappearance was used to confirm for adsorbed reactants. Analysis of the TDOS successfully
202 Toyin Shittu and Mohammednoor Altarawneh
re-produces the experimentally measured analogous values [9] Rawadieh SE, Altarawneh M, Altarawneh IS, Batiha MA,
for pure CeO2 and Nb2O5. Nb doping is found to improve the Al-Makhadmeh LA. A kinetic model for evolution of H2 and CO
semi conductivity nature of CeO2 through the reduction in over Zr-doped ceria. J Mol Catal. 2020;498:111256–63.
[10] Mordekovitz Y, Sagi S, Barzilai S, Hayun S. Effect of Nd content
the band gap of CeO2 by ∼0.60 eV. PDOS identifies the filling
on the energetics of H2O adsorption and defect structure
of the Ce-4f states from the Nb-4d states electron which is in the Ce(1−x)NdxO(2−0.5x) system. J Mater Chem A.
expected to improve the catalytic capacity of CeO2. 2020;8(41):21842–51.
[11] Maitarad P, Han J, Zhang D, Shi L, Namuangruk S,
Funding information: This study has been supported by Rungrotmongkol T. Structure–activity relationships of NiO on
CeO2 nanorods for the selective catalytic reduction of NO with
and a start-up grant from the College of Engineering at
NH3: experimental and DFT studies. J Phys Chem C.
the United Arab Emirates University, UAEU (grant number: 2014;118(18):9612–20.
31N421). Computations were carried out at the high perfor- [12] Wang P, Chen S, Gao S, Zhang J, Wang H, Wu Z. Niobium oxide
mance cluster (HPC) of the UAEU. confined by ceria nanotubes as a novel SCR catalyst with
excellent resistance to potassium, phosphorus, and lead.
Appl Catal B-Environ. 2018;231:299–309.
Author contributions: All authors have accepted respon-
[13] Ma Z, Wu X, Si Z, Weng D, Ma J, Xu T. Impacts of niobia loading
sibility for the entire content of this manuscript and
on active sites and surface acidity in NbOx/CeO2–ZrO2
approved its submission. NH3–SCR catalysts. Appl Catal B-Environ. 2015;179:380–94.
[14] Ding S, Liu F, Shi X, He H. Promotional effect of Nb additive on
Conflict of interest: The authors state no conflict of the activity and hydrothermal stability for the selective cata-
interest. lytic reduction of NOx with NH3 over CeZrOx catalyst. Appl Catal
B-Environ. 2016;180:766–74.
[15] Qu R, Peng Y, Sun X, Li J, Gao X, Cen K, et al. Identification of
the reaction pathway and reactive species for the selective
catalytic reduction of NO with NH3 over cerium–niobium oxide
catalysts. Catal Sci Technol. 2016;6(7):2136–42.
References [16] Khan W, Betzler SB, Šipr O, Ciston J, Blaha P, Scheu C, et al.
Theoretical and experimental study on the optoelectronic
[1] McFarland EW, Metiu HJCR. Catalysis by doped oxides. Chem properties of Nb3O7 (OH) and Nb2O5 photoelectrodes. J Phys
Rev. 2013;113(6):4391–427. Chem C. 2016;120(41):23329–38.
[2] Skrodczky K, Antunes MM, Han X, Santangelo S, Scholz G, [17] de Sousa Lima LF, Coelho CR, Gomes GHM, Mohallem ND.
Valente AA, et al. Niobium pentoxide nanomaterials with dis- Technology. Nb2O5/SiO2 mesoporous monoliths synthetized
torted structures as efficient acid catalysts. Commun Chem. by sol–gel process using ammonium niobate oxalate hydrate
2019;2(1):1–11. as porogenic agent. J Sol-Gel Sci Technol. 2020;93(1):168–74.
[3] Sathasivam S, Williamson BA, Althabaiti SA, Obaid AY, [18] Shi L, Xu C, Yuan H. A CASTEP study on magnetic properties of
Basahel SN, Mokhtar M, et al. Chemical vapor deposition C-doped ZnO crystal. Physica B Condens Matter.
synthesis and optical properties of Nb2O5 thin films with 2011;406(17):3187–91.
hybrid functional theoretical insight into the band structure [19] Wang Y, Puggioni D, Rondinelli JM. Assessing exchange-cor-
and band gaps. Appl Mater Interfaces. 2017;9(21):18031–8. relation functional performance in the chalcogenide lacunar
[4] Siddiki SH, Rashed MN, Ali MA, Toyao T, Hirunsit P, Ehara M, spinels GaM4Q8 (M = Mo, V, Nb, Ta; Q = S, Se). Phys Rev B.
et al. Lewis acid catalysis of Nb2O5 for reactions of carboxylic 2019;100(11):115149–63.
acid derivatives in the presence of basic inhibitors. [20] Miran HA, Jiang Z-T, Altarawneh M, Veder J-P, Zhou Z-F,
ChemCatChem. 2019;11(1):383–96. Rahman MM, et al. Influence of DC magnetron sputtering
[5] Xin Y, Dong L, Guo Y, Liu X, Hu Y, Wang YJ. Correlation of the reaction gas on structural and optical characteristics of
catalytic performance with Nb2O5 surface properties in the Ce-oxide thin films. Ceram Int. 2018;44(14):16450–8.
hydrodeoxygenation of lignin model compound. J Catal. [21] Oliveira JA, Reis MO, Pires MS, Ruotolo LA, Ramalho TC,
2019;375:202–12. Oliveira CR, et al. Zn-Doped Nb2O5 photocatalysts driven by
[6] Ushikubo T. Recent topics of research and development of visible-light: an experimental and theoretical study. Chem
catalysis by niobium and tantalum oxides. Catal Today. Phys. 2019;228:160–7.
2000;57(3–4):331–8. [22] Lian Z, Shan W, Zhang Y, Wang M, He HJI, Research EC.
[7] Casapu M, Krocher O, Mehring M, Nachtegaal M, Borca C, Morphology-dependent catalytic performance of NbOx/CeO2
Harfouche M, et al. Characterization of Nb-containing catalysts for selective catalytic reduction of NOx with NH3. Ind
MnOx−CeO2 catalyst for low-temperature selective catalytic Eng Chem Res. 2018;57(38):12736–41.
reduction of NO with NH3. J Phys Chem C. 2010;114(21): [23] Fonseca ROD, da Silva AA, Signorelli MR, Rabelo-Neto RC,
9791–801. Noronha FB, Simões RC, et al. Nickel/doped ceria solid oxide
[8] Zhang N, Tsang EP, Chen J, Fang Z, Zhao DJ. Critical role of fuel cell anodes for dry reforming of methane. J Braz Chem Soc.
oxygen vacancies in heterogeneous Fenton oxidation over 2014;25:2356–63.
ceria-based catalysts. J Colloid Interface Sci. [24] You R, Zhang X, Luo L, Pan Y, Pan H, Yang J, et al. NbOx/CeO2-
2020;558:163–72. rods catalysts for oxidative dehydrogenation of propane:Properties of CeO2 doped with Nb: A combined characterization and DFT studies 203
Nb–CeO2 interaction and reaction mechanism. J Catal. catalyst in ethyl acetate combustion. Langmuir.
2017;348:189–99. 2006;22(16):7072–7.
[25] Liu Z, Zhang X, Cai T, Yuan J, Zhao K, Lu W, et al. Niobium [41] Sumathi S, Kavipriya A. Structural, optical and photocatalytic
modification of Au/CeO2 for enhanced catalytic performance activity of cerium doped zinc aluminate. Solid State Sci.
over benzene combustion. Nanomaterials. 2021;11(1):189–99. 2017;65:52–60.
[26] Wuilloud E, Delley B, Schneider W-D, Baer Y. Spectroscopic [42] Lee SM, Park KH, Hong SC. MnOx/CeO2–TiO2 mixed oxide
evidence for localized and extended f-symmetry states in catalysts for the selective catalytic reduction of NO with NH3 at
CeO2. Phys Rev Lett. 1984;53(2):202–5. low temperature. Chem Eng J. 2012;195:323–31.
[27] Gerward L, Olsen JS, Petit L, Vaitheeswaran G, Kanchana V, [43] Qi G, Yang RT. Characterization and FTIR studies of MnOx−CeO2
Svane A, et al. Bulk modulus of CeO2 and PrO2 – an experimental catalyst for low-temperature selective catalytic reduction of
and theoretical study. J Alloys Compd. 2005;400(1–2):56–61. NO with NH3. J Phys Chem B. 2004;108(40):15738–47.
[28] Sun L, Huang X, Wang L, Janotti A. Disentangling the role of [44] Li S, Xu Q, Uchaker E, Cao X, Cao G. Comparison of amorphous,
small polarons and oxygen vacancies in CeO2. Phys Rev B. pseudohexagonal and orthorhombic Nb2O5 for high-rate
2017;95(24):245101–8. lithium ion insertion. CrystEngComm. 2016;18(14):2532–40.
[29] Santander J, López E, Diez A, Dennehy M, Pedernera M, [45] Özel RE, Hayat A, Wallace KN, Andreescu S. Effect of cerium
Tonetto G. Ni–Nb mixed oxides: one-pot synthesis and cata- oxide nanoparticles on intestinal serotonin in zebrafish. Rsc
lytic activity for oxidative dehydrogenation of ethane. Chem Adv. 2013;3(35):15298–309.
Eng J. 2014;255:185–94. [46] Han R, Wang Z, Zhang Y, Niu K. Thermal stability of CeO2/
[30] Heracleous E, Lemonidou A. Ni–Nb–O mixed oxides as highly graphene/phenyl silicone rubber composites. Polym. Test.
active and selective catalysts for ethene production via ethane 2019;75:277–83.
oxidative dehydrogenation. Part I: characterization and cata- [47] Morawa Eblagon K, Malaika A, Ptaszynska K, Pereira MFR,
lytic performance. J Catal. 2006;237(1):162–74. Figueiredo JL. Impact of thermal treatment of Nb2O5 on its
[31] Amarsingh KB, Theerthagiri J, Madhavan J, Balu T, performance in glucose dehydration to 5-hydroxymethylfur-
Rajasekaran T, Arof AK. Investigations on acceptor (Pr3+) and fural in water. Nanomaterials. 2020;10(9):1685.
donor (Nb5+) doped cerium oxide for the suitability of solid [48] Lin J, Yuan Y, Su Q, Pan A, Dinesh S, Peng C, et al. Facile
oxide fuel cell electrolytes. Ionics. 2016;22(12):2461–70. synthesis of Nb2O5/carbon nanocomposites as advanced
[32] Wandre T, Gaikwad P, Tapase A, Garadkar K, Vanalakar S, anode materials for lithium-ion batteries. Electrochim Acta.
Lokhande P, et al. Sol–gel synthesized TiO2–CeO2 nanocom- 2018;292:63–71.
posite: an efficient photocatalyst for degradation of methyl [49] Schmitt R, Nenning A, Kraynis O, Korobko R, Frenkel AI,
orange under sunlight. J Mater Sci. 2016;27(1):825–33. Lubomirsky I, et al. A review of defect structure and chemistry
[33] Gómez CD, Rodríguez-Páez JE, Ceramics AO. The effect of the in ceria and its solid solutions. J Chem Soc Rev.
synthesis conditions on structure and photocatalytic activity 2020;49(2):554–92.
of Nb2O5 nanostructures. Process. Appl Ceram. [50] Kreissl HT, Li MM, Peng Y-K, Nakagawa K, Hooper TJ, Hanna JV,
2018;12(3):218–29. et al. Structural studies of bulk to nanosize niobium oxides
[34] Katta PP, Nalliyan R. Corrosion resistance with self-healing with correlation to their acidity. J Am Chem Soc.
behavior and biocompatibility of Ce incorporated niobium 2017;139(36):12670–80.
oxide coated 316L SS for orthopedic applications. Surf Coat [51] Nwosu C. An electronegativity approach to catalytic perfor-
Tech. 2019;375:715–26. mance. J Tech Sci Technol. 2012;1(2):25–8.
[35] Su T, Zhai Y, Jiang H, Gong H. Calorimetry. Studies on the [52] Patel V, Somaiya RN, Kansara S, Singh D, Prajapati N,
thermal decomposition kinetics and mechanism of ammonium Sonvane Y, et al. Structural and electrical properties of CeO2
niobium oxalate. J Therm Anal Calorim. 2009;98(2):449–55. monolayers using first-principles calculations. Solid State
[36] Hardcastle FD, Wachs IE. Determination of niobium-oxygen Commun. 2020;307:113801–5.
bond distances and bond orders by Raman spectroscopy. [53] Murugadoss G, Ma J, Ning X, Kumar MR. Selective metal ions
Solid State Ion. 1991;45(3–4):201–13. doped CeO2 nanoparticles for excellent photocatalytic activity
[37] Liu YH, Zuo JC, Ren XF, Yong L. Synthesis and character of under sun light and supercapacitor application. Inorg Chem
cerium oxide (CeO2) nanoparticles by the precipitation Commun. 2019;109:107577–87.
method. Metalurgija. 2014;53(4):463–5. [54] Mehrotra S, Sharma P, Rajagopalan M, Bandyopadhyay A.
[38] Qu R, Gao X, Cen K, Li J. Relationship between structure and High pressure phase transition and band structures of
performance of a novel cerium-niobium binary oxide catalyst different phases in CeO2. Solid State Commun.
for selective catalytic reduction of NO with NH3. Appl Catal 2006;140(6):313–7.
B-Environ. 2013;142:290–7. [55] Su Y-Q, Filot IA, Liu J-X, Tranca I, Hensen E. Charge transport
[39] Valechha D, Lokhande S, Klementova M, Subrt J, Rayalu S, over the defective CeO2(111) surface. Chem Mater.
Labhsetwar N. Study of nano-structured ceria for catalytic CO 2016;28(16):5652–8.
oxidation. J Mater Chem. 2011;21(11):3718–25. [56] Liu H, Yuan X, Rao L, Liu S, Shi Z, Zhou Y, et al. Refinement
[40] Perkas N, Rotter H, Vradman L, Landau MV, Gedanken A. mechanism of NbC by CeO2 in hypereutectic Fe-Cr-C hard-
Sonochemically prepared Pt/CeO2 and its application as a facing coating. J Alloys Compd. 2019;770:1016–28.You can also read