Investor update for the year ended December 31, 2022 - March 2, 2023 - Polestar Automotive Holding UK PLC - Investor Relations | Polestar
←
→
Page content transcription
If your browser does not render page correctly, please read the page content below

March 2, 2023

Investor update
for the year ended
December 31, 2022

                     Polestar Automotive Holding UK PLC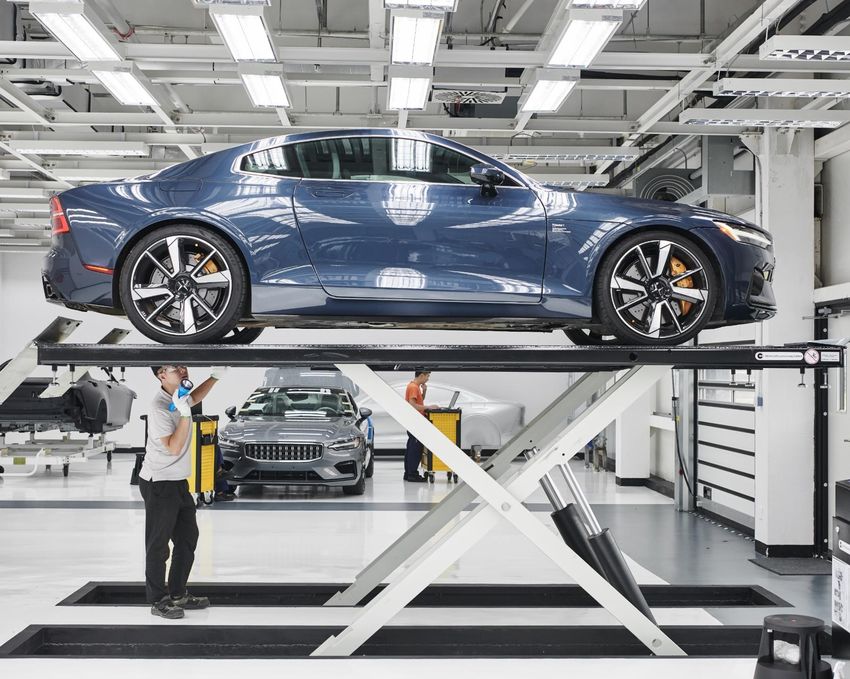
Polestar                                                                                                                                                                                              2

                                                                                                        Disclaimer
Forward-LookingStatements                                                                               particular for lithium-ion cells or semiconductors; Polestar’s reliance on its partners to           SM symbols, but the absence of those symbols is not intended to indicate, in any way, that
Certain statements in this presentation (“Presentation”) of Polestar Automotive Holding UK              manufacture vehicles at a high volume, some of which have limited experience in producing            Polestar or its affiliates will not assert its or their rights or that the applicable owner will not
PLC (“Polestar”) constitute forward-looking statements, within the meaning of the “safe                 electric vehicles, and on the allocation of sufficient production capacity to Polestar by its        assert its rights to these trademarks, trade names and service marks to the fullest extent
harbor” provisions of the United States Private Securities Litigation Reform Act of 1995, that          partners in order for Polestar to be able to increase its vehicle production volumes and meet        under applicable law. Polestar does not intend its use or display of other parties’ trademarks,
express Polestar’s opinions, expectations, beliefs, plans, objectives, assumptions or                   timings for product launches; competition, the ability of Polestar to grow and manage growth         trade names or service marks to imply, and such use or display should not be construed to
projections regarding future events or future results and involve significant risks and                 profitably, maintain relationships with customers and suppliers and retain its management            imply, a relationship with, or endorsement or sponsorship of Polestar by, these other parties.
uncertainties. These forward-looking statements can generally be identified by the use of               and key employees; the possibility that Polestar may be adversely affected by other
forward-looking terminology, including the terms “believes,” “estimates,” “anticipates,”                economic, business, and/or competitive factors; risks related to future market adoption of           Statement RegardingPreliminaryUnaudited Financialand OperationalResults
“expects,” “seeks,” “projects,” “intends,” “plans,” “may,” “will” or “should” or, in each case, their   Polestar’s product offerings; risks related to Polestar’s distribution model; the effects of         The unaudited financial and operational information published in this press release is
negative or other variations or comparable terminology. These forward-looking statements                competition and the high barriers to entry in the automotive industry, and the pace and depth        preliminary and subject to potential adjustments. Potential adjustments to operational and
include all matters that are not historical facts. They appear in a number of places throughout         of electric vehicle adoption generally on Polestar’s future business; changes in regulatory          consolidated financial information may be identified from work performed during Polestar’s
this Presentation and include statements regarding Polestar’s intentions, beliefs or current            requirements (including environmental laws and regulations), governmental incentives and             year-end audit. This could result in differences from the unaudited operational and financial
expectations concerning, among other things: results of operations; financial condition;                fuel and energy prices; Polestar’s ability to rapidly innovate;   risks associated with changes      information published herein. For the avoidance of doubt, the preliminary unaudited
liquidity; prospects; growth; strategies and the markets in which Polestar operates, including          in applicable laws or regulations and with Polestar’s international operations; Polestar’s ability   operational and financial information published in this press release should not be considered
estimates and forecasts of financial and operational metrics, projections of market                     to effectively manage its growth and recruit and retain key employees, including its chief           a substitute for the financial information to be filed with the SEC in Polestar’s Annual Report
opportunity, market share, vehicle sales, revenue or other financial or operation results;              executive officer and executive team; Polestar’s reliance on its partnerships with vehicle           on Form 20-F for the year ended December 31, 2022.
expectations and timing related to commercial product launches, including the start of                  charging networks to provide charging solutions for its vehicles and its reliance on strategic
production and launch of any future products of Polestar, and the performance, range,                   partners for servicing its vehicles and their integrated software; Polestar’s ability to establish   Non-GAAP FinancialInformation
autonomous driving and other features of the vehicles of Polestar; future market                        its brand and capture additional market share, and the risks associated with negative press or       This presentation includes certain financial measures that are not presented in accordance
opportunities, including with respect to energy storage systems and automotive                          reputational harm, including from lithium-ion battery cells catching fire or venting smoke; the      with generally accepted accounting principles in the U.S. (“GAAP”), including adjusted
partnerships; future manufacturing capabilities and facilities; future sales channels and               outcome of any potential litigation, government and regulatory proceedings, investigations           operating loss, adjusted EBITDA, adjusted net loss, and free cash flow. Please see slide 40 for
strategies; access to financing and liquidity support from major shareholders; the adequacy             and inquiries; Polestar’s ability to continuously and rapidly innovate, develop and market new       a reconciliation of the non-GAAP financial measures to their most directly comparable GAAP
of funding through 2023; and future market launches and expansion. Such forward-looking                 products; the impact of the global COVID-19 pandemic, new lockdowns in China, government             financial measures.
statements are based on available current market information and the current expectations               mandated quarantines, inflation, interest rate changes, the ongoing conflict between Ukraine
of Polestar including beliefs and forecasts concerning future developments and the potential            and Russia, supply chain disruptions and logistical constraints on Polestar’s business,              ***
effects of such developments on Polestar. Factors that may impact such forward-looking                  projected results of operations, financial performance or other financial and operational            Past results are not indicative of future performance and investing in securities of Polestar
statements include: the failure to realize the anticipated benefits of the business combination         metrics or on any of the foregoing risks; the need to raise additional funds to support business     involves significant risks. Potential investors should read and understand the explanations of
(the “Business Combination”) that Polestar consummated on June 23, 2022 with Gores                      growth; and the other risks and uncertainties described in Polestar’s filings with the U.S.          risks disclosed by Polestar in its filings with the SEC before making any decisions.
Guggenheim, Inc. (“GGI”); the outcome of any legal proceedings that may be instituted                   Securities and Exchange Commission (the “SEC”). There can be no assurance that future
against GGI or Polestar in connection with the Business Combination; the ability to continue            developments affecting Polestar will be those that Polestar has anticipated. These forward-          The information set forth herein is based upon information reasonably available to Polestar as
to meet stock exchange listing standards; our securities’ potential liquidity and trading;              looking statements involve a number of risks, uncertainties (some of which are beyond                of the date of this Presentation (or any such earlier date referenced herein), and Polestar does
changes in domestic and foreign business, market, financial, political and legal conditions;            Polestar’s control) or other assumptions that may cause actual results or performance to be          not undertake any obligation to update such information at any time after such date. No
Polestar’s ability to enter into or maintain agreements or partnerships with its strategic              materially different from those expressed or implied by these forward-looking statements.            representation, warranty or undertaking, express or implied, is made as to, and no reliance
partners, including Volvo Car AB (publ) and its subsidiaries, and Zhejiang Geely Holding                These risks and uncertainties include, but are not limited to, those factors described in            should be placed on, the fairness, accuracy, completeness or correctness of the information
Group Company Limited, original equipment manufacturers, vendors and technology                         Polestar’s filings with the SEC. Should one or more of these risks or uncertainties materialize,     or the opinions contained herein and as may be amended.
providers, and to source new suppliers for its critical components, and to complete building            or should any of the assumptions prove incorrect, actual results may vary in material respects
out its supply chain, while effectively managing the risks due to such relationships; risks             from those projected in these forward-looking statements. Polestar will not undertake any            This presentation shall not constitute an offer to sell or the solicitation of an offer to buy any
relating to the uncertainty of any projected financial information or operational results of            obligation to update or revise any forward-looking statements, whether as a result of new            securities of Polestar, nor shall there be any sale or offer of any securities in any state or
Polestar, including underlying assumptions regarding expected development and launch                    information, future events or otherwise, except as may be required under applicable                  jurisdiction in which such offer, solicitation or sale would be unlawful. This Presentation is not
timelines for Polestar’s carlines, manufacturing in the United States starting as planned,              securities laws. You are cautioned not to put undue reliance on these forward-looking                intended to constitute, and should not be construed as investment, tax, legal or other advice.
demand for Polestar’s vehicles or car sale volumes, revenue and margin development based                statements.                                                                                          Certain information contained herein has been derived from sources prepared by third
on pricing, variant and market mix, cost reduction efficiencies, logistics and growing                                                                                                                       parties. While such information is believed to be reliable for the purposes used herein neither
aftersales as the total Polestar fleet of cars and customer base grow; delays in the                    Trademarks                                                                                           Polestar nor any of its directors, officers, employees, affiliates or advisors makes any
development, design, manufacture, launch and financing of Polestar’s vehicles and Polestar’s            This Presentation includes trademarks, trade names and service marks, certain of which               representation or warranty with respect to the accuracy of such information. This
reliance on a limited number of vehicle models to generate revenues; risks related to the               belong to Polestar or Polestar’s affiliates and others that are the property of other                Presentation does not purport to contain all of the information that may be required to
timing of expected business milestones and commercial launches, including Polestar’s ability            organizations. The Polestar logo and other trademarks or service marks of Polestar                   evaluate Polestar and has solely been prepared for the purpose of generally familiarizing the
to mass produce its current and new vehicle models and complete the upgrade or tooling of               appearing in this prospectus are the property of Polestar. Solely for convenience, trademarks,       reader with Polestar.
its manufacturing facilities; increases in costs, disruption of supply or shortage of materials, in     trade names and service marks referred to in this prospectus appear without the ®, TM and
Polestar
Polestar 4
—
Recent developments
Delivered 51,4911 vehicles for the full year 2022, an increase of 80% year on year
Aim to deliver approximately 80,000 cars in 2023, an increase of about 60% year on year
Achieved $2.5bn2 in revenues for the full year 2022
Mainly driven by higher Polestar 2 vehicle sales with continued commercial expansion across markets
Launched a major update to Polestar 2 Model Year 2024
High-tech front end, all-new electric motors, more powerful batteries, sustainability improvements and rear-wheel drive
Polestar 3 showcased at Las Vegas CES 2023
For the first time on US soil, together with Smart Eye, supplier of premium driver monitoring technology which is included as standard
Latest in-car Google tech to feature in Polestar cars
Developments include Google’s new HD map that will debut in Polestar 3, and the roll-out of remote actions for Polestar 2
Expanded partnership with Luminar to include Polestar 5
Under existing partnership, Luminar supplies LiDAR for Polestar 3 which is now available to order
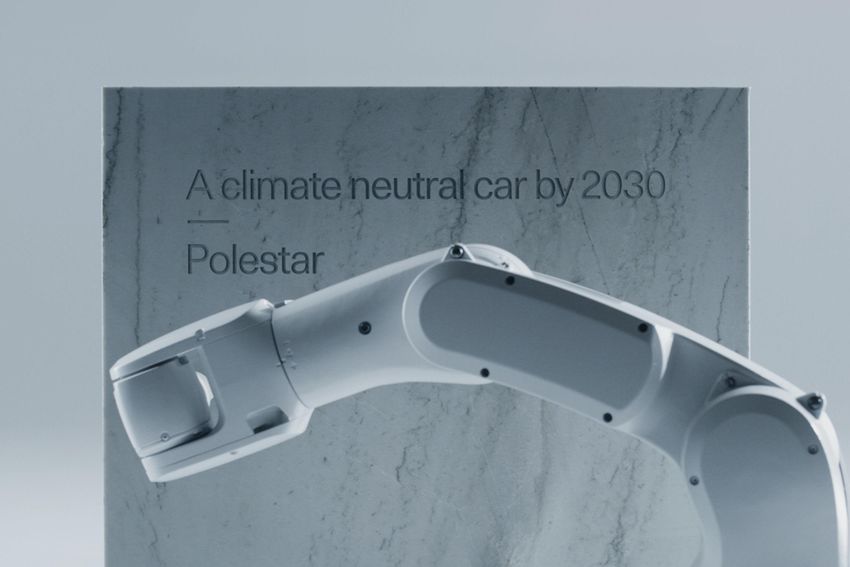
Polestar 0 project adds eight new partners to create a truly climate-neutral car by 2030
Vitesco, Stora Enso and six other new global industry-leading partners join Polestar 0 project
Initiated a Pathway Report in response to the climate crisis
Collaborating with pioneering EV maker and calls for new forms of collaboration to build rapid momentum
1. Represents total volumes of new vehicles delivered, including 48,531 external sales with recognition of revenue at time of delivery, 1,296 external sales with repurchase commitments and
1,664 internal sales of vehicles transferred for demonstration and commercial purposes as well as vehicles transferred to Polestar employees at time of registration. Transferred vehicles
for demonstration and commercial purposes are owned by Polestar and included in Inventory (unaudited).
2. Rounded. See slide 37 for unaudited condensed consolidated statement of loss for figure in thousands of U.S. dollars.
Polestar                                                                                                                          5

                                                                —
                                                                Our past, our present and our future

History in performance                                          Launching the new Polestar brand                               Growing rapidly
1996–2017                                                       2017–2021                                                      2021 onwards
–    Founded in 1996 as a racing team                           – Launched Polestar 1 in 2017 and Polestar 2 in 2019           –   Listed on Nasdaq New York in June 2022
–    Developed and sold performance software for Volvo Cars     – First customer handovers and retail locations open in 2020   –   Launched limited edition Polestar 6 in August 2022
–    The official performance partner to Volvo Cars from 2009   – Global from day one in 2020, with presence in 10 markets     –   Launched Polestar 3 in October 2022
–    Acquired by Volvo Cars in 2015                                                                                            –   Expects to launch three new cars by 2026
                                                                                                                               –   Leading ambition of a climate-neutral production car by 2030

Source: Company information.
Polestar                                                                         6

                                         —
                                         Our growing, diversified premium product portfolio

        Polestar 1                          Polestar 2                                    Polestar 3
        Electric performance hybrid         Electric performance fastback                 Electric performance SUV

        Polestar 4                          Polestar 5                                    Polestar 6
        Electric performance SUV coupe      Electric performance 4-door GT                Electric performance roadster

Source: Company information.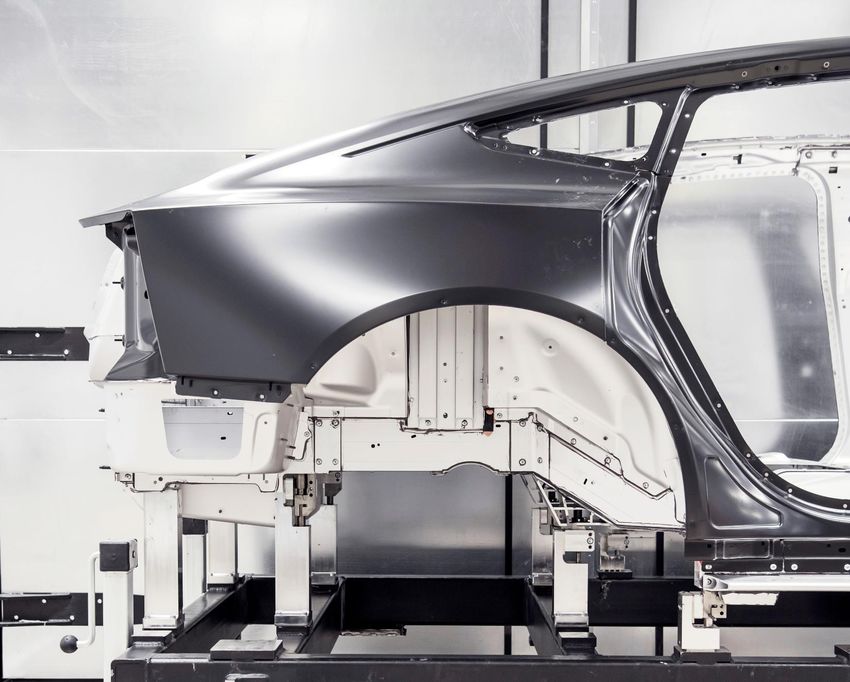
Polestar                7

                                   —
                                   Our asset-light model

 Flexible and scalable

Agility of a start-up

Stability of established players

Source: Company information.
Polestar                                                                                                          8

                                            —
                                            Our core pillars

01                                          02                                               03
Design                                      Innovation                                       Sustainability
–   Avant-garde, pure Scandinavian design   –   Bonded aluminium platform                    –   Leading ambition of climate-neutral production car by 2030
–   High tech minimalism                    –   High-performance electric motors             –   Circular batterystrategy, battery centers in place
–   Design perfection focus                 –   Advanced battery technology design           –   Blockchain-powered transparency through supply chain
–   Unique design attributes                –   R&D capability in the UK, Sweden and China   –   Ethical and inclusive work principles and values

Source: Company information.
Polestar                                                                   9

                                                        —
                                                        Our well-defined growth strategy

    Global premium BEV market1                           Expected new product launches         Global presence

     +18%                                                 2023 – Polestar 4
     CAGR
     2021-2026E                                           2024 – Polestar 5
                                                          2026 – Polestar 6

                                                                                               27
01                                                      02                                    03
Overall market opportunity                              Rapidly expanding product portfolio   Growth in existing and new markets

1. Global market for BEV premium luxury vehicles.
Source: Leading management consultancy, October 2022.
Polestar 10
—
Our visionary , diverse and experienced management team
Mona Abbasi Mikael Björklund Åsa Borg Jörg Brandscheid Monika Franke Thomas Ingenlath Fredrika Klaren
Customer Experience Digital Brand & Marketing CTO, R&D HR CEO Sustainability
Joined in 2019, from Husqvarna Joined in 2020 from Filippa K where Joined in 2020 from Volvo Cars Joined in 2021 from Hella APAC Joined in 2019 from Volvo Cars Joined in 2017 from Volvo Cars where Joined in 2020 from KappAhl where
Group where she was Senior Vice he was Chief Operating Officer. Has where she was Chief Operating where he was Executive Vice where she held roles of Senior HR he was SVP of Design. Brings over she was Head of Sustainability.
President of Brand. Has over 20 over 13 years of business Officer of Care by Volvo. Has over President Electronics. Has 30 years Director, Global R&D and 20 years of design, innovation and Has over 10 years of dedicated
years of experience in leading development and digital marketing 20 years of Brand, Marketing and of automotive experience in several Purchasing & Quality. Has 20 years leadership experience in the sustainability experience across
consumer and IT brands. experience. automotive industry experience. R&D roles. of experience. automotive industry. fashion and retail.
Johan Malmqvist Maximilian Missoni Nils Mösko Dennis Nobelius Tanya Ridd Anna Rudensjö Mike Whittington
CFO Design Strat&Bus. Development COO Communications & PR Legal Global Sales
Joined in 2021 from Dole Food Joined in 2018 from Volvo Cars Joined in 2018 as Deputy CFO from Joined in 2020 from Zenuity (now Joined in 2022 from Spotify where Joined in 2018 from SKF Group Joined in 2018, previously worked
Company where he was CFO. where he was Vice President Volvo Cars. Held finance and Zenseact) where he was CEO. she was Senior Director of where she was Legal Director and with new EV introductions at Jaguar
Has over 20 years of financial Exterior Design and Chief Designer treasury roles for Volvo Cars and Has 20 years of R&D, operation Communications. Has over 20 Group Legal Counsel. Has 20 years Land Rover, PSA, Mercedes-Benz
experience across multiple sectors. Exterior. Has 20 years of experience Ford Motor. Has 15 years of and leadership experience in the years of communication of experience. and Toyota. Has over 20 years of
within the automotive industry. automotive industry experience. automotive industry. management experience. experience.
Source: Company information. In alphabetical order.Unaudited financial highlights for the year ended December 31, 2022
Financial and operational highlights                                                                                       12

                                                                                                                                  —
                                                                                                                                  Key financial highlights for the year ended Dec 31, 2022 (unaudited)

      Revenue                                                                                                                      Gross profit                                                       Cash and cash equivalents
      ($ mn)                                                                                                                       ($ mn)                                                             ($ mn)

                                                        84%                         2,462
                                                                                                                                                                          119                                                              974
                                                                                                                                                                                                               757

                          1,337

                                                                                                                                              1
                          FY 2021                                                    FY 2022                                                  FY 2021                      FY 2022                             FY2021                      FY 2022

Delivered $2.5bn in revenues                                                                                                      Gross profit of $119mn                                            Cash balance of approximately $1bn
Driven by higher Polestar 2 sales with continued                                                                                  As the result of higher Polestar 2 sales and lower fixed          Benefited from the listing proceeds and strengthened
commercial expansion across markets.                                                                                              manufacturing costs. This growth was partially offset by FX       liquidity provided by short term financing facilities.
                                                                                                                                  which led to higher cost of sales, and product and market mix .

Note: All U.S. dollar figures on this slide rounded. Percentages have been calculated using unrounded amounts. See slide 37 for
unaudited condensed consolidated statement of loss for figures in thousands of U.S. dollars.
Financial and operational highlights 13
—
Key financial highlights for the year ended Dec 31, 2022 (unaudited)
Revenue up 84%
Driven by higher Polestar 2 vehicle sales
with continued market expansion
US$ million FY 2022 FY 2021 % Change
Gross profit up $119mn
With higher sales of Polestar 2 and lower Revenue 2,462 1,337 84
fixed manufacturing costs, partially offset
by FX, and product and market mix Cost of sales (2,343) (1,336) 75
SG&A up 21% Gross profit 119 1 n/m
Primarily reflects international business
expansion, partially offset by active cost Gross margin (%) 4.9 0.1 n/m
management
SG&A expense (865) (715) 21
R&D down 27%
R&D expenses (171) (233) (27)
With absence of Polestar 1 amortisation,
partially offset by continued investment in Other operatingincome (expense), net (48)
2 (105)
future vehicles and technologies
Listing expense1 (372) - 100
Operating loss up 29%
Impacted by a Q2 2022 one-time share- Operatingloss (1,286) (995) 29
based listing charge of $372mn.
Adjusted operating loss down 8% Adjusted operating loss2 (914) (995) (8)
1. The listing expense in Q2 2022 represents a non-recurring, non-cash, share-based listing charge, incurred in connection with the
business combination with Gores Guggenheim, Inc. on June 23, 2022.
2. Non-GAAP measure. See slide 40 for details and a reconciliation of adjusted metrics to the nearest GAAP measure.
Note: All U.S. dollar figures on this slide rounded. Percentages have been calculated using unrounded amounts. See slide 37 for
unaudited condensed consolidated statement of loss for figures in thousands of U.S. dollars.Financial and operational highlights 14
—
Key financial highlights for the three months ended Dec 31, 2022 (unaudited)
Variances for Q4 2022 versus Q4 2021
largely followed the trends outlined for US$ million Q4 2022 Q4 2021 % Change
2022 versus 2021, with the following
notable exceptions: Revenue 985 590 67
Cost of sales (923) (590) 57
SG&A broadly flat
Due to active cost management, Gross profit (loss) 62 (0) n/m
especially in the second half of the year
Gross margin (%) 6.3 -0.0 n/m
Operating loss down 39%
SG&A expense (239) (237) 1
Benefiting from higher gross profit and
active cost management actions
R&D expenses (48) (76) (37)
Other operating income (expense), net 20 (25) (181)
Operatingloss (205) (337) (39)
Note: All U.S. dollar figures on this slide rounded. Percentages have been calculated using unrounded amounts. See slide 37 for
unaudited condensed consolidated statement of loss for figures in thousands of U.S. dollars.Financial and operational highlights 15
—
Cash flow for the year ended Dec 31, 2022 (unaudited)
Cash flow
($ mn)
Operating
Cash outflow of $1,088mn, mainly driven
by operating loss, working capital
increase in inventories and trade
receivables, and interest expenses due to
increased financial debt during 2022
757
724
974
(120)
Investing 1,418
Cash outflow of $716mn, predominantly
driven by intellectual property
investments for Polestar 2, Polestar 3 and
Polestar 4 (1,088)
Financing (716)
Cash inflow mainly comprised of equity
proceeds of $1,418mn and net increase in
short-term borrowings of $724mn
2021 Operating Investing Equity Net short-term FX and 2022
proceeds borrowings other1
1. Including effect of foreign exchange rate changes on cash and cash equivalents of -$66mn, transaction costs of -$39mn and
principal repayments of lease liabilities of -$15mn.
Note: All U.S. dollar figures on this slide rounded. See slide 39 for unaudited condensed consolidated statement of cash flows for
figures in thousands of U.S. dollars.Financial and operational highlights 16
—
2023 outlook
Global volumes Gross profit margin Liquidity
80,000 ~2022 Strengthened
Expect an increase of about 60% in global Expect gross margin to be broadly in line While liquidity has strengthened, including
volumes predominantly driven by with 2022, with volume and product mix nearly $1.0bn cash balance , we continue
Polestar 2 sales. supporting progression later in the year. to explore potential equity or debt offering to
fund operations and business growth.
Source: Company estimates.Delivering on our strategy
Delivering our strategy     18

                                            —
                                            Key investment highlights

01
Well-defined growth strategy

02
Asset-light model

03
Digital-first direct-to-consumer approach

04
Core pillars:
Design, Innovation, Sustainability
01
Well-defined growth strategy 19
—
Operating within the fastest-growing car segment
Automotive market in million cars1 Premium segment BEV penetration percentage Premium BEV market size in million cars
+18%
83 23 CAGR
2.9
18
68
5
6 13
12
1.3
58
52
2021A 2026E 2021A 2026E 2021A 2026E
ICE PHEV/HEV2 BEV
We operate in a large and competitive There is a significant BEV market Global premium BEV vehicles market
automotive market, with BEV market opportunity, with premium segment is one of the fastest growing
growth expected to outpace the BEV penetration expected to grow to segments with +18% CAGR.
overall market growth. 23% in 2026.
1. Excluding FCEV cars due to low volumes until 2026.
2. Including PHEV and HEV vehicles.
Source: Leading management consultancy, October 2022.01 Well-defined growth strategy 20
—
Rapidly expanding premium product portfolio
Polestar 1 Polestar 2 Polestar 3 Polestar 4 Polestar 5 Polestar 6
Type Hybrid Grand Tourer Fastback Luxury Aero SUV Premium Sport SUV Luxury Sport GT 4-Door Luxury 2+2 roadster
Segment Sports Premium C/D premium SUV E premium SUV D premium F coupé premium S roadster premium
ASP1 ~$155k ~$50-70k ~$80-120k ~$60-80k >$100k >$200k
Range ~120km range ~540km up to 610km2 600km +2 600km +2 600km +2
Launch 2017 2019 2022 2023E 2024E 2026E
1. Prices vary by region. Estimated indicative US market pricing range as at November 2022, subject to change.
2. WLTP (Worldwide Harmonised Light Vehicle Test Procedure) target range.
Source: Company information, management estimates.01 Well-defined growth strategy 21
—
Extensive global market presence
Global presence today
Active markets
Australia, Austria, Belgium, Canada,
China, Denmark , Finland, Germany,
Hong Kong, Iceland, Ireland, South
Korea, Kuwait, Israel, Italy,
Luxembourg, Netherlands, New
Zealand, Norway, Portugal,
Singapore, Spain, Sweden,
Switzerland, United Arab Emirates,
United Kingdom and United States of
America.
Source: Company information.
2702 Asset-light model 22
—
Combining the best of both worlds
Flexible and scalable set-up
– Agility of a start-up
– Innovation and high-performance technologies
– Avant-garde design
– Leading sustainability goals
– Full vehicle attributes
– Digital first DTC business
Stability of established players
– Over 100 years’ of combined experience
– Platform development
– Engineering capability
– Supply chain and partnerships
– Manufacturing capacity
– Safety credentials
– Service network access
Source: Company information.02 Asset-light model 23
—
Access to state-of-the-art factories
Taizhou, China Chengdu, China Charleston, US Hangzhou Bay, China Chongqing, China1
Opened 2016 2013 2015 2021 2024E
Operated by Volvo Cars Volvo Cars Volvo Cars Geely Polestar
Manufacturing Polestar 2 Polestar 3 Polestar 3 Polestar 4 Polestar 5
1. Operated by Polestar, owned by Geely.
Source: Company information.03 Digital-first direct-to-consumer approach 24
—
Our customer approach
Digital-first direct-to-consumer approach
Customers can browse our products,
configure their vehicle and place their
order online
Local support centres
We continue to establish in-house care
centres, creating a premium brand
experience
Action through data driven insight
Monitor customer experiences across
journeys to drive relevant and impactful
improvements
Skilled specialists
Passionate, knowledgeable and service-
minded Polestars with local knowledge
and cultural know-how to serve our
customers’ needs
Source: Company information.03 Digital-first direct-to-consumer approach 25
—
Connected retail and ownership experience
Explore and schedule
Explore Polestar vehicles online and
schedule a test drive
Configure and finance
Configure and order online via web and
mobile channels
Control and ownership
Control vehicle functions and engage
with support or book service
Source: Company information.03 Digital-first direct-to-consumer approach 26
—
Expanding sales and service network
Locations
Permanent or pop up/temporary
Polestar showrooms located in urban
and peri-urban areas with retail and test
drive opportunities.
Service points
Leveraging established Volvo Cars
service network for full service support.
Locations1 Service points2
2021 2022 2021 2022
103 158 811 1,116
1. Represents Polestar Spaces, Polestar Destinations and Polestar Test Drive Centers (Unaudited).
2. Represents Volvo Cars service centres to provide access to customer service points worldwide in support of Polestar’s international expansion (Unaudited).
Source: Company information.04 Core pillars 27
—
Design – Avant-garde, pure Scandinavian design
Unique design attributes
– SmartZone sensor panel
– Integrated aerodynamic enhancers
– Rear view camera feed replaces rear window
– Extended panoramic glass roof
– Avant-garde interior with innovative materials
– High contrast, iconic design
– Integrated long-range LiDAR
Sustainable materials integration
– Sustainability declarations to show our progress
– Vegan standard interior
– MicroTech – bio-attributed vinyl produced without fossil fuels
– Leather & wool from farms that are animal welfare certified,
and leather tanning process is chrome free
– Bcomp – natural fibre composites with flax fibres for seats
and interior components
Source: Company information.04 Core pillars 28
—
Innovation – performance orientated technology development
Bonded aluminium platform High-performance electric motors Advanced battery technology design
– Bonded aluminium platform developed in-house – P10 rear motor with 450 kW (~603 hp) – Developed 800V battery pack
– Set to provide class-leading dynamics, rigidity and safety – One of the most powerful electric motors in the world – Switchable between 800V and 400V
features – 1-speed energy efficient transmission facilitating – 103 kWh possible to charge to 80% in ~20 minutes
– Technology usually applied to low-volume sports cars now special requirements for multiple platforms – Bi-directional/vehicle-to-grid charging compatible
brought into mainstream production – Multiple installation options for easy integration
with multiple platforms
Source: Company information.04 Core pillars 29
—
Innovation – At the digital forefront
Add a new image
Infotainment system Over-the-air (OTA) updates Smart partnerships and collaborations
– Infotainment system built on AndroidTM Automotive OS – Vehicles updated with latest software – Autonomous driving partners:
with Google built-in – Applicable to all cars 1 Luminar – Advanced Lidar System
– End-to-end integration of Android features – 17 updates successfully executed for Polestar 2 model year Nvidia – centralised computing
– Native applications without requiring smartphone 2023, targeting range, efficiency, connectivity and driving Zenseact – AI powered software
connection experience improvements – MobilityXlab – global start-up community pipeline
– A new in-car Range Assistant app that is geared to assist
drivers to improve efficiency and range confidence
1. Excluding Polestar 1.
Source: Company information.Core pillars
04 — 30
Innovation – R&D capability
R&D Coventry, United Kingdom
400+ employees
– Lightweight vehicle structures / bonded aluminium body
– Program lead for Polestar inhouse developed programs
– Overall vehicle development and release
– Sports car production technology
– In-car software development, testing and integration
– Advanced engineering and research, Polestar 0
R&D Gothenburg, Sweden
250+ employees
– Electric powertrain and battery system development
– Setting of vehicle attributes and final sign off
– In-car software development
– Polestar Engineered performance components
– Advanced engineering and research, Polestar 0 Project
R&D Shanghai, China
25+ employees
– Focusedon bespokeChinesemarket features development
R&D Volvo Cars and Geely
Access to engineers and designers
Source: Company information.04 Core pillars 31
—
Sustainability – our strategic focus areas
Image Image
representing representing
the subject the subject
Climate neutrality Transparency Circularity Inclusion
– Climate-neutral platform – Material traceability – Circular battery design – Human rights in supply chain
– Climate-neutral materials – Supply chain transparency – Remanufacturing of batteries – Ethical business practices
– Climate-neutral manufacturing – Product sustainability declaration – Collaborations for second life – Inclusive workplace
– Renewable energy in the supply chain – Sustainability reporting – Collaborations for recycling – Inclusive design
– Inclusive customer experience04 Core pillars 32
—
Sustainability – Climate neutrality
2021 absolute GHG-emissions (scope 1-3) Trend in GHG-emissions (scope 1-3) relative to sold cars Carbon footprint (cradle to gate) for Polestar 2
kton % tons
+701 -6 -1.7
Total greenhouse gas emissions from our We reduced our greenhouse gases per We reduced the carbon footprint of Polestar
value chain increased by 701 ktons in 2021, sold car by 6% in 2021 compared 2 throughout work with Sustainable
due to business growth. to 2020. Upgrades by 1.7 tons during 2022.
We are laser focused on decoupling this
relationship and confident that our efforts
will work.
Source: Company information.04 Core pillars 33
—
Sustainability - Transparency
Carbon Footprint for Polestar vs. a compact SUV ICE model Material production
Li-on battery modules
Tons of CO2-equivalents Manufacturing
Use phase
Life cycle assessments (LCAs) End-of-life
Pioneering transparency by disclosing
LCAs with full methodology for all models
Consumer transparency
Industry unique product sustainability
declaration allows consumers to compare
60 58
sustainability credentials
50 50
Supply chain traceability
40
42
Enabling traceability through blockchain
and certifications on risk materials
throughout our batteries and cars 30
27
Sustainability reporting 20
Annual sustainability reporting since 2020
in adherence with Global Reporting 10
Initiative standards
0
Tonnes Volvo XC40 ICE Polestar 2 Polestar 2 Polestar 2
CO2e Global European Wind power
electricity mix electricity mix
Source: Life cycle assessment - Carbon footprint of Polestar 2 which is available at https://www.polestar.com/hk/sustainability/transparency/04 Core pillars 34
—
Sustainability - Circularity
Material recycling rate of different functional areas of Polestar 2
Kg/unit
Creating a circularity roadmap
In 2022, together with Circle Economy and
STENA Recycling, we set out to estimate
the impact Polestar 2 has on important
circularity issues - raw material
consumption, biodiversity and
recyclability.
The findings on the recyclability of
different functional areas, creates a
baseline from where we are now building
our strategy and KPIs to become a circular
company.
Source: Company information.04 Core pillars 35
—
Sustainability - Inclusion
Women in the workforce in 2021 /2020 Suppliers - Code of Conduct for Business Partners
% %
27 / 23 100
We are focused on building a workforce that For Polestar 2 and 3 we have secured full Collaborating through multi-stakeholder
represents our customers and our world and commitment from all suppliers on issues like initiatives with responsible sourcing practices,
aim to have a 40% female workforce by 2025. equality, working conditions, forced labor, sustainability assessments, and third-party
wages etc. audits.
Source: Company information.Appendix
Financial statements                                                                                 37

                                                              —
                                                              Unaudited condensed consolidated statement of loss

in thousands of U.S. dollars except per share data and unless otherwise stated       For the three months ended December 31       For the year ended December 31
                                                                                      2022                  2021              2022                   2021
Revenue                                                                               985,151               589,507           2,461,897              1,337,181
Cost of sales                                                                         (923,183)             (589,707)         (2,342,454)            (1,336,321)
Gross profit (loss)                                                                   61,968                (200)             119,443                860
Selling, general and administrative expenses                                          (239,174)             (236,580)         (864,598)              (714,724)
Research and development expenses                                                     (47,634)              (75,522)          (170,987)              (232,922)
Other operating income (expense), net                                                 20,143                (24,993)          2,182                  (48,053)
Listing expense                                                                       —                     —                 (372,318)              —
Operating loss                                                                        (204,697)             (337,295)         (1,286,278)            (994,839)
Finance income                                                                        7,066                 8,169             8,551                  32,970
Finance expenses                                                                      3,531                 (16,738)          (108,435)              (45,249)
Fair value change - Earn-out rights                                                   (63,600)              —                 902,068                —
Fair value change - Class C Shares                                                    (500)                 —                 35,090                 —
Loss before income taxes                                                              (258,200)             (345,864)         (449,005)              (1,007,118)
Income tax expense                                                                    (4,240)               9,078             (16,783)               (336)
Net loss                                                                              (262,440)             (336,786)         (465,789)              (1,007,454)
Financial statements 38
—
Unaudited condensed consolidated statement of financial position
in thousands of U.S. dollars December 31, 2022 December 31, 2021 in thousands of U.S. dollars December 31, 2022 December 31, 2021
Assets Equity
Non-current assets Share capital (21,156) (1,865,909)
Intangible assets and goodwill 1,391,828 1,368,356 Other contributed capital (3,582,589) (35,231)
Property, plant and equipment 262,593 208,193 Accumulated deficit & Foreign currency
translation reserve 3,737,089 1,778,644
Vehicles held under operating lease 92,198 120,626 Total equity 133,344 (122,496)
Other non-current assets 15,395 5,532
Total non-current assets 1,762,014 1,702,707 Liabilities
Current assets Non-current liabilities
Cash and cash equivalents 973,877 756,677 Other non-current provisions and liabilities (139,428) (79,906)
Marketable securities — 1,258 Earn-out liability (598,570) —
Trade receivables external and trade Other non-current interest-bearing liabilities (85,556) (66,575)
receivables and accrued income – related Total non-current liabilities (823,554) (146,481)
parties 370,164 177,544
Inventories 657,882 545,743 Current liabilities
Other current assets 178,516 125,764 Trade payables external and trade payables
and accrued expenses - related parties (1,184,142) (1,857,730)
Total current assets 2,180,439 1,606,986 Advance payments from customers (40,868) (36,415)
Total assets 3,942,453 3,309,693 Liabilities to credit institutions (1,328,752) (642,338)
Interest-bearing current liabilities (38,235) (24,072)
Class C Shares liability (28,000) —
Other current provisions and liabilities (632,246) (480,161)
Total current liabilities (3,252,243) (3,040,716)
Total liabilities (4,075,797) (3,187,197)
Total equity and liabilities (3,942,453) (3,309,693)Financial statements 39
—
Unaudited condensed consolidated statement of cash flows
For the twelve months ended For the twelve months ended
in thousands of U.S. dollars December 31, in thousands of U.S. dollars December 31,
2022 2021 2022 2021
Cash flows from operating activities Cash flows from financing activities
Net loss (465,789) (1,007,454) Change in restricted cash — 48,830
Adjustments to reconcile Net loss to net cash flows Proceeds from short-term borrowings 2,146,396 698,882
Depreciation and amortization 185,057 239,164 Principal repayments of short-term borrowings (1,422,862) (411,950)
Finance income and expense 99,884 12,280 Principal repayments of lease liabilities (14,905) (8,578)
Listing expense 372,318 — Proceeds from the issuance of share capital and other
contributed capital 1,417,973 582,388
Income tax expense 16,783 336 Transaction costs (38,903) —
Other non-cash expense and income (839,595) 106,658 Cash provided by financing activities 2,087,699 909,572
Change in operating assets and liabilities (378,526) 357,505 Effect of foreign exchange rate changes on cash and cash
Interest net paid & tax paid (78,481) (20,645) equivalents (66,177) (27,491)
Cash used for operating activities (1,088,349) (312,156) Net increase in cash and cash equivalents 217,200 440,253
Cash and cash equivalents at beginning of period 756,677 316,424
Cash flows from investing activities Cash and cash equivalents at end of period 973,877 756,677
Additions to property, plant and equipment (32,269) (24,701)
Additions to intangible assets (681,204) (104,971)
Other (2,500) —
Cash used for investing activities (715,973) (129,672)Financial statements 40
—
Unaudited reconciliation of GAAP and Non-GAAP results
Non-GAAP Financial Information
Polestar uses both generally accepted accounting principles ("GAAP," i.e., IFRS) and non-GAAP (i.e., non-IFRS) financial measures to evaluate operating performance, for internal comparisons to historical
performance, and for financial decision-making purposes. The Polestar believes non-GAAP financial measures are helpful to investors as they provide useful perspective on underlying business trends and
assist in period on period comparisons. These non-GAAP measures are presented for supplemental information purposes only and should not be considered a substitute for financial information presented in
accordance with GAAP. The measures are not presented under a comprehensive set of accounting rules and, therefore, should only be read in conjunction with financial information reported under GAAP
when understanding Polestar's operating performance. The measures may not be the same as similarly titled measures used by other companies due to possible differences in calculation methods and items
or events being adjusted. A reconciliation between non-GAAP financial measures and the most comparable GAAP performance measures is provided below. For a more detailed explanation of each non-
GAAP measure used, please also refer to our press release reporting our financial and operational results for the fourth quarter of 2022 and the year ended December 31, 2022.
For the twelve months ended For the twelve months ended
in millions of U.S. dollars December 31, in millions of U.S. dollars December 31,
2022 2021 2022 2021
Adjusted operating loss Adjusted net loss
Operating loss (1,286.3) (994.8) Net loss (465.8) (1,007.5)
Listing expense 372.3 — Listing expense 372.3 —
Adjusted operating loss (non-GAAP) (914.0) (994.8) Fair value change - Earn-out rights (902.1) —
Fair value change - Class C Shares (35.1) —
Adjusted net loss (non-GAAP) (1,030.7) (1,007.5)
For the twelve months ended For the twelve months ended
in millions of U.S. dollars December 31, in millions of U.S. dollars December 31,
2022 2021 2022 2021
Adjusted EBITDA Free cash flow
Net loss (465.8) (1,007.5) Net cash used for operating activities (1,088.3) (312.2)
Listing expense 372.3 — Investing cash flows used for tangible assets (32.3) (24.7)
Fair value change - Earn-out rights (902.1) — Investing cash flows used for intangible assets (681.2) (105.0)
Fair value change - Class C Shares (35.1) — Free cash flow (non-GAAP) (1,801.8) (441.8)
Interest income (7.7) (1.4)
Interest expenses 77.5 44.9
Income tax expense 16.8 0.3
Depreciation and amortization 185.1 239.2
Adjusted EBITDA (non-GAAP) (759.0) (724.5)Investor update for preliminary unaudited results for the year ended December 31, 2022 — Contact information For questions, please contact: Bojana Flint Head of Investor Relations ir@polestar.com Polestar Assar Gabrielssons Väg 9 SE-418 78 Göteborg Sweden polestar.com All ideas contained within this document are owned by Polestar. © Polestar 2022
You can also read