Kenedix Retail REIT Corporation Security Code: 3453
←
→
Page content transcription
If your browser does not render page correctly, please read the page content below

Kenedix Retail REIT Corporation             Security Code: 3453
Financial Results
for the 14th Fiscal Period ended March 31, 2022
May 18, 2022
Contents

 Section 1    Executive summary                         P.3

 Section 2    Impact of COVID-19                        P.12

 Section 3    KRR highlights and updates                P.16

 Section 4    Growth strategies focusing on stability   P.23

 Appendix 1   Key characteristics of KRR                P.34

 Appendix 2   Portfolio and unitholder information      P.44

Security Code

                         3453
01   Executive summary
Executive summary

Promoting growth strategies in an unstable environment
Achievements since the 14th FP ended March 2022

 Active portfolio management amid the pandemic                                 Diverse financing leveraging credit improvement

 • Continued strong performance of KRR’s core tenants that deal with           • Credit rating (JCR) upgraded to AA- (Stable), due to Kenedix Group
   daily necessities, even amid the prolonged COVID-19 pandemic.                 affiliated with Sumitomo Mitsui Finance and Leasing Group,
   Achieved JPY 7,090 DPU in the 14th FP, JPY 80 higher than forecast            accelerated diversification and stable management amid the pandemic
 • Conducted asset reshuffling, acquiring 3 assets while selling 3 in the
   14th FP. Acquired 3 additional assets in the 15th FP                        • Issued the first green bond after upgraded to AA-

 • Used the sponsor support and proprietary network for acquisition.           • Borrowed the first green loans
   Moreover, made distinctive efforts to enhance unitholder value, such
   as acquisition with intention of conversion and property expansion
   leveraging underutilized space                                              • Improved borrowing conditions along with the enhanced credibility

 Aim for enhanced stability and sustainable growth even in the unstable environment

 • Seek growth and diversification of portfolio through public offering at appropriate timing

 • Enhance stability and profitability of portfolio by reshuffling tenants that are taking time to recover sales amid the pandemic and reshuffling assets

 • Aim to reduce funding costs by diversifying financing methods and lenders, leveraging high credit rating of AA-

 • Further promote ESG initiatives through GHG emission reduction targets and disclosures in line with TCFD recommendation

                                                                                                                                                            4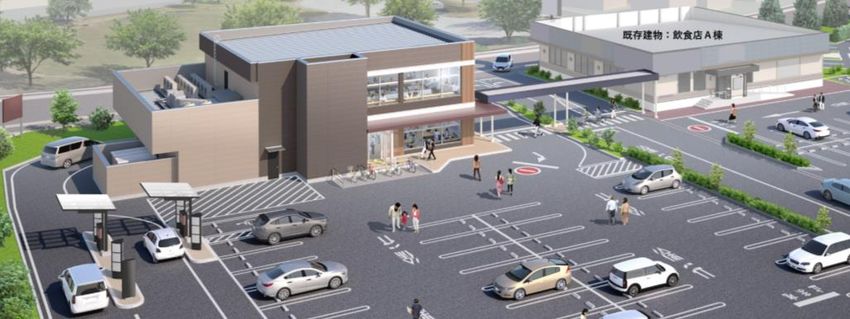
Executive summary

Unit price performance
KRR’s unit price outperformed the TSE REIT Index after the 11th FP earnings announcement amid the pandemic
Unit price and market capitalization                                                                KRR's unit price                            NAV per unit               TSE REIT Index             Market capitalization
                                                                                                    (left axis)                                 (left axis) (Note 1)       (left axis) (Note 2)       (right axis)
     (JPY)                                                                                                                                                                                                                    (JPY mm)
  350,000                     May 18, 2020                                        Nov. 17, 2020                Apr. 7, 2021                            May 18, 2021              Nov. 16, 2021           Mar. 31, 2022          350,000
                              10th FP earnings                                    11th FP earnings             5th PO launch date                      12th FP earnings          13th FP earnings        End of 14th FP
                              announcement                                        announcement                                                         announcement              announcement

  300,000                                                                                                                                                                                                                       300,000

  250,000                                                                                                                                                                                                                       250,000

  200,000                                                                                                                                                                                                                       200,000

  150,000                                                                                                                                                                                                                       150,000

  100,000                                                                                                                                                                                                                       100,000

   50,000                                                                                                                                                                                                                       50,000

         0                                                                                                                                                                                                                      0
       Feb. 20, 2020                      Jun. 20, 2020                       Oct. 20, 2020                       Feb. 20, 2021                       Jun. 20, 2021         Oct. 20, 2021           Feb. 20, 2022         May 13, 2022
Note 1: Please refer to page 8 for details of NAV per unit.
Note 2: Calculated using the TSE REIT Index as of Feb. 20, 2020 when the 2020 highest price was recorded for the TSE REIT Index as the closing price for KRR unit price.
                                                                                                                                                                                                                                          5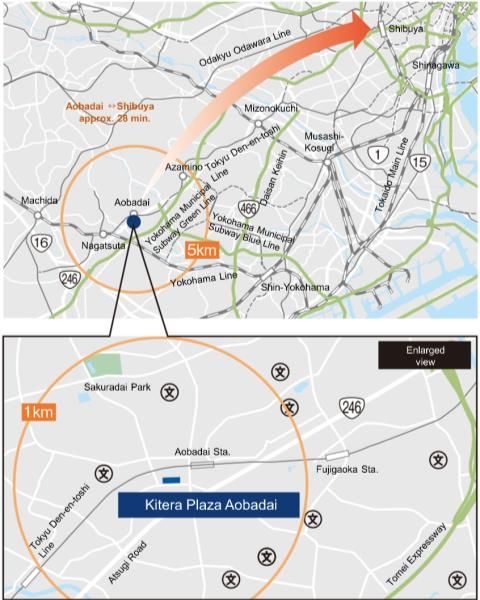
Executive summary
Flexible portfolio management adapting to environmental changes
Pursuing a portfolio with higher quality and profitability by asset reshuffling, adapting to environmental changes
Reshuffling since the 12th FP (based on acquisition / disposition price)
Acquisitions Dispositions
3 properties, JPY 2.3bn 1 property, JPY 2.6bn
Asset reshuffling considering resilience against e-commerce and COVID-19
*The asset was disposed of in
the 12th, 13th and 14th FPs
12th FP
Mar. 2021
Chiba-Kita Sapporo Shiroishi Monenosato Mall Daikanyama Address Dixsept
Distribution Center Distribution Center (2 New Buildings) (40% quasi co-ownership interest)
4 properties, JPY 22.3bn 3 properties, JPY 4.5bn
13th FP
Sep. 2021
Apita Terrace Kitera Town Chofu Unicus Urawamisono Merado Daikai Hankyu Oasis Hirakatadeguchi Unicus Ina Daikanyama Address Dixsept
Yokohama Tsunashima (Land) (20% quasi-co-ownership interest) (30% quasi co-ownership interest)
(Additional interest)
3 properties, JPY 9.6bn 3 properties, JPY 8.3bn
14th FP
Mar. 2022
K’s Denki Shonan-Fujisawa Prime Square Jiyugaoka Daikanyama Address Dixsept
Kitera Town Tenri Kitera Plaza Aobadai (Land) (30% quasi co-ownership interest)
Fukuoka Nagahama Distribution Center ✓ Converting a property vacated due to the
pandemic into a shopping center for daily Summary of the properties disposed of in the 14th FP ended Mar. 2022
needs, resilient to e-commerce and COVID-19
K’s Denki Shonan-Fujisawa (Land)
3 properties, JPY 6.3bn
✓Property with potential downside risks
Prime Square Jiyugaoka
Highlight ✓Property with a health club, the sector relatively affected by the pandemic;
expected to require more maintenance and capex constantly due to its age
Daikanyama Address Dixsept
15th FP
✓Property with many apparel tenants largely affected by the pandemic,
Sep. 2021 compared to other properties in the portfolio
Higashimatsuyama Sun Street Hamakita Prima Meat Packers
Shopping Center (Additional interest) Kinki Center Total Total book value Avg. NOI yield
disposition JPY 8.3bn at the end of JPY 7.8bn based on 4.1%
price Sep. 2021 disposition price
6
Executive summary
Selective investments adapting to trend changes
Acquisitions adapting to trend changes such as demographics in surrounding areas and tenant mix focusing on groceries
Highlights of the new acquisition List of the new acquisition
Retail trade areas Acquisition Appraisal
1 with demographic advantages
Dense population Growing population
Appraisal Acquisition
The new acquisition price value Highlights
NOI yield route
• Areas with abundant retail trade areas owing to population concentration (JPY mm) (JPY mm)
• Locations with potential for population growth where large-scale housing development is planned
in the neighborhood Shopping centers for daily needs
2 Located in four major metropolitan areas Metropolitan areas Ordinance-designated
Kitera Town Fukuoka Nagahama Dense
and ordinance-designated cities Growing
• Locations in 4 major metropolitan areas and ordinance-designated cities with relatively stable Acquired 6,000 6,100 4.7% Sponsor
in 14th FP Metropolitan
demographics
Grocery
3 Tenant mix enabling stable management Grocery Logistics Kitera Plaza Aobadai Dense
• Retail facilities with grocery supermarket tenants are resilient to the impact of COVID-19 and Growing
Acquired 2,553 3,610 4.7% Proprietary
e-commerce in 14th FP (Note 1) (Note 2) Metropolitan
• Retail distribution centers that leverage e-commerce demand Grocery
Strong support from the Kenedix Group Sun Street Hamakita
4 and Alliance Companies
Sponsor Alliance
(Additional interest) Growing
• Utilizing the pipelines and bridge function provided by Kenedix Group (Sponsor) and Alliance Acquired 1,200 1,210 5.7% Proprietary Ordinance-designated
Companies in 15th FP Grocery
Change in the portfolio through asset reshuffling
Higashimatsuyama Shopping
Center Growing
End of 13th FP Properties The new End of
4,080 4,650 6.4% Alliance Metropolitan
(Sep. 2021) disposed of acquisition Apr. 2022 Acquired
in 15th FP Grocery
Number of
66 3 6 68
properties Retail distribution centers
Total acquisition Tenri Distribution Center
JPY 245.2bn JPY 7.6bn JPY 15.9bn JPY 253.6bn
price Metropolitan
Acquired 1,070 1,090 5.5% Proprietary
in 14th FP Logistics
Total appraisal value JPY 263.9bn JPY 8.1bn JPY 17.7bn JPY 273.7bn
Prima Meat Packers Kinki Center
Average appraisal 4.1%
5.2% (based on 5.2% 5.3% Metropolitan
NOI yield disposition price) Acquired 1,047 1,080 5.2% Proprietary
in 15th FP Logistics
4 major
81.8% 100.0% 92.5% 82.0%
metropolitan areas
Note 1: The conversion cost will be added to the acquisition price after the completion of the conversion. Assumed cost of the
Grocery anchored conversion is JPY 880mm, which may increase or decrease.
Note 2: The appraisal NOI is based on the NOI after the completion of the conversion, which is on the appraisal report as of Mar. 31,
shopping centers 86.0% 21.3% 100.0% 88.9% 2022. The appraisal NOI yield is calculated by dividing the appraisal NOI by the sum of the acquisition price and the assumed
(retail only)
costs of the conversion. The same shall apply to the calculation of the average appraisal NOI yield of the portfolio.
7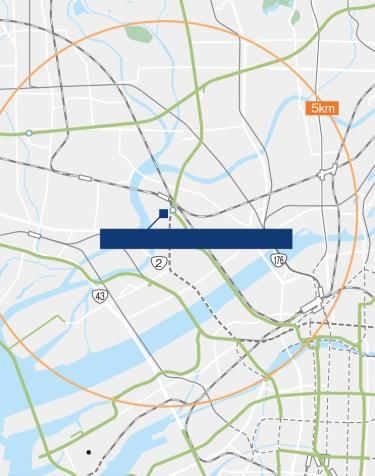
Executive summary

DPU, NAV per unit and unrealized gain
DPU (Note 1)
     (JPY)
     7,500                                                                                                                                                                                           7,328
                                                                                                                                                                               7,095                                       7,090
     7,000
                                                                                                                                                                                                                           7,010
                                                                                                                                                          6,546                                                                                 6,595
                                                                                        6,477                 6,486                 6,535                                                                                                                             6,500
     6,500
                                             6,255                 6,299                                                                                                                                                                        6,550
                                                                                                                                                                                   Incl. gain on sale of Daikanyama
                       6,115

     6,000

     5,500
         0
                    5th period            6th period            7th period           8th period            9th period           10th period          11th period           12th period           13th period           14th period          15th period           16th period
                   (Sep. 2017)           (Mar. 2018)           (Sep. 2018)          (Mar. 2019)           (Sep. 2019)           (Mar. 2020)          (Sep. 2020)           (Mar. 2021)           (Sep. 2021)           (Mar. 2022)          (Sep. 2022)           (Mar. 2023)
                                                                                                                                                                                                                                              Forecast             Forecast
NAV per unit (Note 2)
    (JPY)
  270,000

                                                                                                                                                                                                                                                                      259,730
  260,000                                                                                                                                                                                                                                          258,148
                                                                                                                                                                                            254,616                              254,861
                                                                                                                                    251,614           251,438            251,701                              252,462
  250,000                                                                                                        247,548
                                                                                              244,777
                                                                            243,257
                                                         238,931
  240,000
                                      231,555
                    230,058
  230,000

  220,000

        0
  210,000
                  1st period         2nd period         3rd period        4th period         5th period         6th period        7th period         8th period        9th period        10th period        11th period       12th period        13th period        14th period
                 (Sep. 2015)        (Mar. 2016)        (Sep. 2016)       (Mar. 2017)        (Sep. 2017)        (Mar. 2018)       (Sep. 2018)        (Mar. 2019)       (Sep. 2019)        (Mar. 2020)        (Sep. 2020)       (Mar. 2021)        (Sep. 2021)        (Mar. 2022)
Unrealized       JPY 2,130          JPY 4,657         JPY 6,720          JPY 8,493         JPY 10,861         JPY 12,270        JPY 14,213         JPY 14,438         JPY 14,695         JPY 15,572        JPY 14,565         JPY 15,753         JPY 17,501        JPY 17,982
  gain             mm                 mm                mm                 mm                 mm                 mm                mm                 mm                 mm                 mm                mm                 mm                 mm                mm
Note 1: The boxes in orange lines indicate the forecasts as of Nov. 16, 2021.
Note 2: NAV per unit at the end of each FP = (net assets + unrealized appraisal gains/losses on the entire portfolio at the end of each FP – total distributions) / (total number of investment units issued at the end of each FP).
        Please note that from this disclosure, we have changed the calculation of NAV per unit to deduct total distributions which were included in our previous disclosures. Moreover, the assumed costs of the Kitera Plaza Aobadai conversion is deducted from the calculation of
        unrealized appraisal gains/losses on the entire portfolio.                                                                                                                                                                                                                     8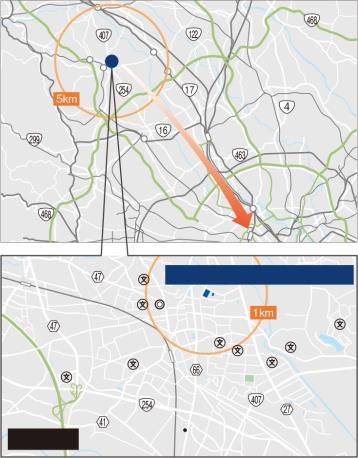
Executive summary
DPU impact and forecast assumptions
DPU Positive factors Negative factors
(JPY)
7,500 Absence of gain on sale
(net increase in income-DPU-
linked AM fee and investment
unit performance fee)
in 13th FP
Absence of gain on sale
(net increase in income-
140 DPU-linked AM fee)
in 14th FP
Increase in
income-
7,000 DPU-linked
AM fee
Increase in
NOI
937 749 (acquisition
in 14th and
609 15th FP)
Decrease
101 Absence of
in repair termination
Increase in fee (P-1)
Increase in expenses
depreciation
Decrease in NOI 64 366 159
Others Others
NOI from the (acquisition 137 137 32
6,500 in 14th FP)
169 Increase 50 74
sale of in utility
Gain on sale
Expensing 50
Daikanyama, 39 cost 87 8 Termination
property Increase Others Increase in
7,328 etc. (Daikanyama,
Increase in taxes fee NOI (full
etc.) in utility
depreciation Decrease in (P-1) contribution of
230 NOI from
cost
acquisition in
7,090 7,090 the sale of 15th FP and
240 Shonan- completion of
Fujisawa, Aobadai
84 Jiyugaoka conversion)
Increase in
NOI (full 6,659
contribution 6,595
6,000 of acquisition 6,531 6,500 6,500 6,500
in 13th FP) 6,481 6,481 6,481 6,450 6,450 6,458 6,458 6,458
6,391 6,426 6,426 6,394 6,394
6,235
6,151 6,151
0
5,500
Sep. 2021 Mar. 2022 Sep. 2022 Mar. 2023
13th FP 14th FP 15th FP 16th FP
Actual Actual Forecast Forecast
9
Executive summary

Summary of statements of income and retained earnings: 14th FP
                                                                                                                                                                                                        (JPY mm)
                                                      Sep. 2021                       Mar. 2022                        Changes
                                                        13th FP              14th FP             14th FP                                                    Remarks on changes from forecasts
                                                                                                                 C-A             C-B
                                                       actual (A)       forecast (B) (Note 1)   actual (C)
                                                                                                                                            Disposition -76, existing properties +9 (re forecast vs actual variance of
  Rent revenue – real estate                                 7,829                 7,943              7,882        +53             -61
                                                                                                                                            COVID impact: forecast -20, actual -11), acquisition +5
                                                                                                                                            Termination fee +27, utility charge reimbursement +16,
  Other lease business revenue                               1,072                 1,014              1,074            +1          +59
                                                                                                                                            revenue from events +7, insurance income +7

  Gain/loss on sale of real estate                            674                     350               436        -237            +86      Shonan-Fujisawa & Jiyugaoka +86

Operating revenues(Note 2)                                   9,576                 9,308              9,393        -182            +84

  Property related expenses                                                                                                                 Utility charge +40, repair costs -23, BM/PM fee -10,
  (excl. depreciation)                                       2,495                 2,395              2,399         -96                +4
                                                                                                                                            sales promotion costs -3

  NOI                                                        6,405                 6,563              6,557       +151                 -5

  Depreciation                                               1,166                 1,197              1,189        +23                 -7

  NOI after depreciation                                     5,239                 5,365              5,367       +128                 +2

  Other operating expenses                                   1,032                 1,013              1,047        +15             +34      AM fee +22, non-deductible consumption tax +17

Operating income                                             4,881                 4,702              4,756        -124            +54

   Non-operating income                                             0                    0                   1         +0              +1

   Non-operating expenses                                     619                     624               626            +7              +1

Ordinary income                                              4,262                 4,077              4,131        -130            +54

Net income                                                   4,261                 4,076              4,127        -133            +51

DPU (JPY)                                                    7,328                 7,010              7,090        -238            +80

Note 1: The 14th FP forecast above is as of Nov. 16, 2021.
Note 2: The figures include loss on sale of real estate.                                                                                                                                                         10
Executive summary
Financial forecasts: 15th and 16th FPs
(JPY mm)
Mar. 2022 Sep. 2022 Sep. 2022 Mar. 2023
Key financial information Changes Changes
14th FP (actual) 15th FP (forecast) 15th FP (forecast) 16th FP (forecast)
Operating revenues 9,393 9,250 -142 9,250 9,135 -115
Gain on sale of real estate 436 - -436 - - -
Operating expenses 4,636 4,791 +154 4,791 4,743 -48
Operating income 4,756 4,459 -297 4,459 4,392 -66
Non-operating expenses 626 623 -2 623 611 -11
Interest expenses & financing-related
expenses 610 608 -2 608 604 -4
Amortization of investment unit
issuance costs 15 15 - 15 7 -7
Ordinary income 4,131 3,835 -296 3,835 3,780 -54
Net income 4,127 3,834 -293 3,834 3,779 -54
DPU 7,090 6,595 -495 6,595 6,500 -95
Mar. 2022 Sep. 2022 Sep. 2022 Mar. 2023
Related key indicator Changes Changes
14th FP (actual) 15th FP (forecast) 15th FP (forecast) 16th FP (forecast)
NOI 6,557 6,627 +69 6,627 6,575 -51
NOI yield 5.3% 5.2% - 5.2% 5.2% -
Depreciation 1,189 1,248 +59 1,248 1,278 +29
NOI after depreciation 5,367 5,378 +10 5,378 5,296 -81
NOI yield after depreciation 4.4% 4.2% - 4.2% 4.2% -
FFO 4,900 5,102 +201 5,102 5,069 -33
CAPEX 680 592 -88 592 893 +300
LTV 44.7% 45.0% - 45.0% 45.0% -
11Security Code
3453
02 Impact of COVID-19Impact of COVID-19
Response to rent reduction requests amid the pandemic and sales-linked rent
◼ The number of new requests for rent reduction and rent deferral remained limited even during the declarations of emergency and
the quasi-state of emergency. All deferred rents has been collected
◼ The level of move-outs in 14th FP was pre-pandemic level
◼ Occupancy rate stayed stable amid the COVID-19 pandemic
Rent type Percentage of tenant category
10th FP 11th FP 12th FP 13th FP 14th FP of sales-linked rent
(Oct. 2021 – Mar. 2022) (Note 3)
Mar. 2020 Sep. 2020 Mar. 2021 Sep. 2021 Mar. 2022 (based on rent)
Service businesses
Rent reduction 8.9%
/deferral 19 177 22 8 2
requests Groceries 1.6%
Fixed rent with Dollar shops 4.3%
Responded sales-linked rent Drug stores
rent reduction - 95 1 5 5 9.1% 6.1%
requests (Note 1) (Note 1)
Total sales- Apparel
Amount of Sundry goods
linked rent 12.1% 50.6%
rent reductions - 41.0 1.6 11.1 10.9 2.2%
(JPY mm) Other
retailers
Responded Sales-linked rent 16.4%
1.5%
rent deferral - 2 - - -
requests Fixed rent
89.3% Non-service
Amount of 91.1%
rent deferral - 17.6 - - - Non-service-oriented tenants cover
(JPY mm) over 90% of sales-linked rent
Rent Sales-linked rent
1 31 1 - -
delinquency
10th FP 11th FP 12th FP 13th FP 14th FP
Mar. 2020 Sep. 2020 Mar. 2021 Sep. 2021 Mar. 2022
Move-outs 7 8 18 7 6
Total amount
Occupancy rate of sales-linked 152 116 139 124 133
99.4% 99.7% 99.8% 99.6% 99.2%
(end of FP) rent (JPY mm)
(Note 2)
Note 1: The figures include requests KRR has responded since the previous FPs.
Note 2: As Kitera Plaza Aobadai is under conversion, its occupancy rate is 0% as of Mar. 31, 2022. However, if we exclude this property, the occupancy rate is 99.5%.
Note 3: The figures of “Rent type” is for the 14th FP.
13Impact of COVID-19
Changes in tenant sales (Jan. 2020 – Mar. 2022)
Changes in tenant sales by business category (Monthly comparison vs. 2019)
Portfolio monthly tenant sales remained stable at 103% during the 14th FP (from Oct. 2021 to Mar. 2022) compared to the same period of 2019 even amid the
quasi-state of emergency
14th FP ended Mar. 2022
140%
SoED* *State of emergency SoED SoED SoED Quasi-state
declaration of emergency
(1st) (2nd) (3rd) (4th)
130%
120%
110%
100%
90%
80%
70%
Impact from the last-minute demand
before the 2019 consumption tax hike
60%
Impact from the last-minute demand
Portfolio Supermarket
before the 2019 consumption tax hike
50% Home & garden Drug stores
Consumer electoronics Restaurants
40%
Jan. Feb Mar Apr May Jun Jul Aug Sep Oct Nov Dec Jan. Feb Mar Apr May Jun Jul Aug Sep Oct Nov Dec Jan. Feb Mar
2020 2021 2022
Note: “Changes in tenant sales” is based on the sales figures available to KRR. Sales figures of portfolio do not take into account the effect of difference in days of the weekends in each period while sales figures by business category (excluding supermarket and home &
garden) take into account the effect of the day of the week. Health clubs and some large amusement facilities are not included in aggregate calculation.
14Impact of COVID-19
Consumption shifting to residential areas amid the COVID-19 pandemic
Changes in sales by business category (Monthly comparison vs. 2019) (Note) Change in the number of people staying in residential areas
(Weekly comparison vs. 2019)
While department store sales stay stagnant, sales of shopping centers for daily
needs remain stable amid the pandemic People staying within residential areas has continued amid the pandemic
Supermarket Home & garden Number of COVID-19 cases In municipalities Tokyo Kanagawa Chiba Saitama
(Japan, right axis) Inter-prefectural Tokyo Kanagawa Chiba Saitama
Drug stores Home appliance retailers
40% (k, people)
2,250 40%
Department stores Impact from the last-minute
demand before the 2019
20%
consumption tax hike 2,100
0%
1,950
20%
-20%
1,800
-40%
1,650
-60%
0% 1,500
-80%
1,350 Jan. Mar. May Jul. Sep. Nov. Jan. Mar. May Jul. Sep. Nov. Jan. Mar.
2020 2021 2022
1,200 Source: V-RESAS (provided by the Office for Promotion of Regional Revitalization, Cabinet office, and Secretariat of Headquarters for
Town, People, and Business Development, Cabinet Secretariat)
-20%
1,050 Percentage of teleworking implementation by companies in Tokyo
The teleworking implementation rate rose amid the pandemic
900 State of emergency declaration/ quasi-state of emergency
70%
-40% 750
60%
600
50%
450
-60%
40%
300
150 30%
-80% 0 20%
Jan. Mar. May Jul. Sep. Nov. Jan. Mar. May Jul. Sep. Nov. Jan. Mar. Mar. May Jul. Sep. Nov. Jan. Mar. May Jul. Sep. Nov. Jan. Mar.
2020 2021 2022 2020 2021 2022
Source: Ministry of Economy, Trade and Industry “the Current Survey of Commerce” Source: Tokyo Metropolitan Government
Note: Figures after 2021 are calculated by dividing the actual sales figures by the 2019 sales figures which is adjusted by
coefficients for continuity in the Ministry of Economy, Trade and Industry's "Current Survey of Commerce" (preliminary report
for March 2022). 15Security Code
3453
03 KRR highlights and updatesKRR highlights and updates
Portfolio summary
Characteristics of KRR portfolio(Note 1)
Total Appraisal NOI yield after 4 major Shopping centers Grocery anchored
appraisal value NOI yield(Note 2) depreciation(Note 2) Occupancy rate(Note 3) metropolitan areas for daily needs shopping centers(Note 4)
JPY 273.7 bn 5.3% 4.3% 99.2% 82.0% 93.8% 88.9%
Trend in AUM (based on acquisition price)
1st follow-on 2nd follow-on 3rd follow-on 4th follow-on 5th follow-on
offering offering offering offering offering Diversification of
(Oct. 2015) (Apr. 2016) (Apr. 2017) (Oct. 2019) (Apr. 2021) portfolio
(JPYbn)
13 properties 8 properties 10 properties 12 properties 4 properties (at the end of Apr. 2022)
300 JPY 37.9bn JPY 28.6bn JPY 38.1bn JPY 33.9bn JPY 22.3bn
(acquisition price) (acquisition price) (acquisition price) (acquisition price) (acquisition price) Top 5 properties
(based on acquisition price)
253.6
250 245.2 247.2
Hamakita 4.7%
225.8 226.4 226.7 Tsunashima 4.6%
212.8 213.2 HAT Kobe 4.3%
204.9 206.1 200.9 Kitera Chofu
200 4.1%
Top 5 Mito 4.0%
properties
158.7 164.3
150
21.7%
131.6
Others 78.3%
100 91.8
80.8
Top 10 tenants
50 (based on rent)
A. 6.8%
B. 4.8%
C. 3.9%
0
At Listing 1st period 2nd period 3rd period 4th period 5th period 6th period 7th period 8th period 9th period 10th period 11th period 12th period 13th period 14th period Apr. 2022 D. 3.6%
(Feb. 2015) (Sep. 2015) (Mar. 2016) (Sep. 2016) (Mar. 2017) (Sep. 2017) (Mar. 2018) (Sep. 2018) (Mar. 2019) (Sep. 2019) (Mar. 2020) (Sep. 2020) (Mar. 2021) (Sep. 2021) (Mar. 2022) Top 10 E. 3.5%
tenants F. 3.1%
Number of G. 3.1%
properties 18 19 33 40 42 51 52 53 53 55 62 62 64 66 66 68 37.4% H. 3.0%
I. 2.9%
Tenants 286(Note 5) 321 389 405 409 542 522 520 511 480 496 496 502 528 519 522 J. 2.8%
Others 62.6%
Note 1: Figures are as of Mar. 31, 2022 for the properties held as of Mar. 31, 2022. As for Higashimatsuyama Shopping Center and Prima Meat Packers Kinki Center, appraisal value and NOI yield are as of Mar. 1, 2021. Furthermore, for Sun Street Hamakita,
the values of 90% and 10% quasi-co-ownership interests are as of Mar. 31, 2022 and Mar. 1, 2022, respectively.
Note 2: “Appraisal NOI Yield” is calculated by dividing appraisal NOI from the latest appraisal reports by acquisition price. Please refer to page 5 for details of the appraisal NOI of Kitera Plaza Aobadai. NOI yield after depreciation is calculated by deducting the
depreciation from the aforementioned appraisal NOI and dividing the figure by acquisition price.
Note 3: As Kitera Plaza Aobadai is under conversion, its occupancy rate is 0% as of Mar. 31, 2022. However, if we exclude this property, the occupancy rate is 99.5%.
Note 4: ”Grocery anchored shopping centers” ratio is calculated by dividing total acquisition price of grocery anchored shopping centers by total acquisition price of retail properties.
Note 5: “Number of tenants” at listing is figure as of Sep. 30, 2014.
17KRR highlights and updates
Leasing overview (1)
Multi-tenant properties (by acquisition prices) Lease expiry profile (by annual fixed rent)
Others
5.8% 20 years or more
12.0% less than 2 years
Rent revision
13.5%
unavailable
22.3%
Single tenant 15 to less than
properties: 43.5% 20 years
Most leases are long- 10.8%
term, and some have
potential for increase Multi-tenant 2 to less than
in rent and hedge properties WALE 5 years
against inflation 10 to less than
56.5% Multi-tenant 15 years
7.6%
9.3 yrs 19.6%
properties
Interest/CPI 56.5%
linked
6.4% 5 to less than
10 years
Master lease 36.6%
8.9%
Lease contract type (by annual fixed rent) Percentage of tenant categories (based on rents)
Tenants less affected by e-commerce
Regular building N. 4.4%
M. 4.5%
lease A. Groceries & Costco 28.7%
11.7% L. 6.6%
A. 28.7% B. Master lease 12.5%
K. 0.3%
J. 1.6% C. Home & garden 10.4%
Commercial fixed- I. 2.9% D. Service businesses 7.1%
term land lease
13.2% H. 3.7% E. Logistics facilities 6.7%
A to K Tenants F. Amusement 6.0%
Lease contract type that
G. 4.6% 84.4% G. Health clubs 4.6%
makes it difficult for tenants H. Restaurants 3.7%
to move out, providing F. 6.0% I. Drug stores 2.9%
stability
Fixed-term building B. 12.5% J. Dollar shops 1.6%
lease
75.1% E. 6.7% K. Office 0.3%
L. Other retailers 6.6%
D. 7.1% C. 10.4%
M. Apparel 4.5%
Note 1: The figures are as of Mar. 31, 2022 for the assets owned by KRR as of the date of this material. However, figures for Prima Meat Packers Kinki Center are as of the acquisition date.
Note 2: Based on the contractual rent determined in the lease contract, including regular building leases. N. Consumer electronics 4.4%
Note 3: “Master lease” indicates tenants with sub-lease type master lease agreement (excluding tenants over half of whose shop area KRR considers occupied by areas under direct management).
“Interest/CPI-linked” indicates tenants whose rent contract renews accordingly to the interest rate or CPI. 18KRR highlights and updates
Leasing overview (2)
Rent revisions (based on number of revisions) (Note 1) Lease expiry (by annual fixed rent)
# of tenants and % of lease expiry in each period (Note 2)
Upward revision No revision Downward revision
29.0% 22.6% 28.2%
39.5% 33.3%
44.0%
35.5% 45.2%
56.4% 47.6% 3.0%
48.8% 2.7%
48.0% 2.0% 2.1%
1.9% 1.9%
35.5% 32.3%
11.6% 15.4% 19.0%
8.0%
Sep. 2019 Mar. 2020 Sep. 2020 Mar. 2021 Sep. 2021 Mar. 2022 Sep. 2022 Mar. 2023 Sep. 2023 Mar. 2024 Sep. 2024 Mar. 2025
9th Period 10th Period 11th Period 12th Period 13th Period 14th Period 15th Period 16th Period 17th Period 18th Period 19th Period 20th Period
Annual change (Note 2)
25 41 37 45 54 17
-10mm yen +57mm yen -46mm yen +24mm yen +7mm yen -2mm yen tenants tenants tenants tenants tenants tenants
Tenant move-in and move-out (Note 3) Contract renewals at lease expiry in each period
Move-in Renewal Exit
3.4%
3.2% Move-out Exit due to replacing the master lessee by the end tenant at Sunadabashi
13.6% 9.8% 13.2% 10.5%
25.5%
50.8%
1.0% 3.5%
0.9% 0.8% 86.4% 90.2% 86.8% 89.5%
0.6% 74.5%
0.4% 0.4% 0.4%
0.2% 0.2% 0.2% 45.7%
Sep. 2019 Mar. 2020 Sep. 2020 Mar. 2021 Sep. 2021 Mar. 2022
9th Period 10th Period 11th Period 12th Period 13th Period 14th Period Sep. 2019 Mar. 2020 Sep. 2020 Mar. 2021 Sep. 2021 Mar. 2022
9th Period 10th Period 11th Period 12th Period 13th Period 14th Period
Direct lease at
Sunadabashi
Note 1: Based on the rent including common area charges before revision of the tenants subject to rent revision. Temporal rent reductions/deferrals due to the COVID-19 pandemic are excluded.
Note 2: Based on the contractual rent determined in the lease contract, including regular building leases, for properties owned as of the date of this material. However, disposed assets are excluded.
Note 3: Based on the rent revenue of the last month of each fiscal period.
19KRR highlights and updates
Internal growth initiatives
Example of expansion leveraging underutilized space –
Unicus Ina Restaurant Building B(Note)
• The second property expansion at this property, following the completion of Restaurant Building A
Restaurant Restaurant Building A (leased to a sushi restaurant) in 2017
Building B • McDonald, which has maintained steady growth even amid the COVID-19 pandemic, is planning
to open a new store at the Restaurant Building B. The store will offer Table Delivery, Mobile
Ordering and a service that enables customers to receive orders placed through Mobile Ordering
in parking lots without leaving cars
• As these services are designed to provide customers safe dining environment amid the pandemic
and capture demands online, the store is expected to have synergistic effect among other tenants
by attracting more families with young children
Construction cost Profitability enhancement Investment return
Total expected construction cost Assumed increase in NOI Assumed NOI yield
approx. JPY 169 mm JPY +16 mm 9.6%
Flexible leasing strategy including attracting tenants in other sectors – Leasing progress amid the COVID-19 pandemic –
Passaggio Nishiarai Kitera Town Fukuoka Nagahama
• Restaurant moved out at the end of Jan. 2022 • The property was completed in Nov. 2020 amid the
COVID-19 pandemic, and the vacancy rate was 17%
• Executed lease agreement for the vacated space with at the time of acquisition in Oct. 2021
a satellite office and an exercise class operator
• Executed lease agreement for 4% since the
• Achieved 33% increase in rent by the tenant reshuffle. acquisition
Expecting revitalization of the facilities by attracting
tenants in other sectors • Currently negotiating for 12% of the space (13%
vacancy in total)
Lease executed
3rd floor layout after the acquisition
Before previous tenant’s vacation After new tenants’ move-in
Vacant Existing
tenant
Satellite Under
Restaurant Exercise class negotiation
office
Existing
tenants
Note: The exterior image is based on the planned extension as of the date of this material and may differ from the actual completed building. The figures are estimates. The total expected construction cost and assumed increase in NOI represent
the amount corresponding to 80% of the quasi-co-ownership interest of the trust beneficiary right in the property accordingly.
20KRR highlights and updates
Financial highlights
Financial highlights Average remaining years to maturity, borrowing terms and interest rate
Avg. borrowing terms Avg. remaining years to maturity Avg. interest rate
13th FP 14th FP Apr. 2022 (left axis) (left axis) (incl. up-front fee, right axis)
(years)
Long-term 12 1.03% 1.2%
100.0% 99.4% 98.6% 0.99% 0.99% 1.00% 0.98% 0.96%
debt ratio 10 1.0%
7.4 7.7 7.7 7.9
Fixed interest 8 7.3 7.3 0.8%
debt ratio 97.7% 98.6% 97.8%
6 4.6 4.5 4.4 4.5 0.6%
4.0 4.4
LTV(Note) 44.1% 44.7% 44.9% 4 0.4%
2 0.2%
Number of lenders 14 18 18
0 0.0%
Sep-19 Mar-20 Sep-20 Mar-21 Sep-21 Mar-22
Credit rating Improvement in new borrowing terms
(compared with 11th and 12th FP, incl. refinances and investment corporation bonds)
Credit rating (JCR) • Kenedix Group affiliated with Sumitomo 11th and 12th FP 13th FP 14th and 15th FP
AA- (stable)
Mitsui Finance and Leasing Group
• Diversification driven by AUM growth Average borrowing
(from Dec. 2021) 5.6 years 6.1 years 6.4 years
• Stable management amid the pandemic period
Average interest
0.75% 0.69% 0.73%
rate
Green finance Tighter spreads amid rising interest rate
Procured JPY 9.0bn in total Eligible green assets
7th Series Investment Eligible properties in KRR’s portfolio: 19 properties with total acquisition price
Debt Financing Series 46
Corporation Bonds of JPY133.9 bn (as of Apr. 30, 2022)
(Green Loans)
(Green Bonds)
DBJ Green Building Certification for CASBEE
BELS Assessment
Certification for Real Estate
“★★★” or higher
Funds JPY 2.0bn JPY 4.6bn JPY 0.8bn JPY 1.6bn “3 stars” or higher “B+ ranking” or higher
Procurement date Jan. 28, 2022 Feb. 10, 2022
Term 10 years 7 years 9 years
Interest rate 0.46% 0.7220% 0.6400% 0.8786%
Use Refinancing borrowings to acquire an eligible green asset
Note: LTV = (loan balance + investment corporation bond balance) / total assets
21KRR highlights and updates
Borrowings and bonds (as of Apr. 30, 2022)
Maturities of interest-bearing debts
(JPY mm) Long-term borrowings Short-term borrowings Investment corporation bonds
15,000
13,200
12,000 10,700 2,000 10,890
10,590 10,260 10,250
9,500 1,000
8,750
9,000 1,000 2,000
750 7,000 6,820
5,850 5,550
6,000
4,050
3,100
1,000 2,490 2,000 2,000
3,000 1,000
500 800
2,050 8,000 8,500 9,700 11,200 8,250
0
(FP)
Sep-22 Mar-23 Sep-23 Mar-24 Sep-24 Mar-25 Sep-25 Mar-26 Sep-26 Mar-27 Sep-27 Mar-28 Sep-28 Mar-29 Sep-29 Mar-30 Sep-30 Mar-31 Sep-31 Mar-32
Avg.
0.58% 1.05% 0.82% 1.31% 0.78% 0.87% 1.21% 0.77% 0.97% 0.89% 1.09% 0.94% 0.87% 0.89% 0.72% 1.00% ー 1.06% 1.04% 0.46%
interest rate
Breakdown of debt outstanding by lender and investment corporation bonds Commitment credit lines (total of JPY 3,000 mm)
(JPY mm)
■ Sumitomo Mitsui Banking Corp. 39,570 Counterparty Maximum amount End of
contract term
■ MUFG Bank, Ltd. 18,560
Sumitomo Mitsui
■ Mizuho Bank, Ltd. 12,170 Banking Corp.
JPY 1,000 mm Mar. 31, 2023
■ Development Bank of Japan Inc. 11,290
Mizuho Bank, Ltd. JPY 1,000 mm Mar. 31, 2023
7.2%
6.5%
■ Sumitomo Mitsui Trust Bank, Ltd. 9,770
MUFG Bank, Ltd. JPY 1,000 mm Mar. 31, 2023
3.6%
■ Mizuho Trust & Banking Co., Ltd. 5,750
31.8%
■ Resona Bank, Ltd. 5,700
4.6%
Total interest-
■ Aozora Bank, Ltd. 4,440
Investment corporation bonds
4.6% The Bank of Fukuoka, Ltd. 1,500
bearing debt Amount of Interest Issuance
The Musashino Bank, Ltd. 1,450 Bond Term
JPY124.3bn issuance rate date
7.9% The Gunma Bank, Ltd. 900
2nd Series JPY 1,000 mm 0.60% Oct. 2016 10 years
Shinsei Bank, Ltd. 800
Nippon Life Insurance Co. 700 3rd Series JPY 1,000 mm 0.32% Aug. 2017 5 years
9.1% 14.9%
The Yamaguchi Bank, Ltd. 700 4th Series JPY 2,000 mm 0.70% Aug. 2017 10 years
9.8%
Sumitomo Life Insurance Co. 500
5th Series JPY 2,000 mm 0.70% Apr. 2018 10 years
The 77 Bank, Ltd. 500
500 -24bps 6th Series JPY 1,000 mm 0.40% Apr. 2020 5 years
The Nishi-Nippon City Bank, Ltd.
The Higo Bank, Ltd. 500 7th Series JPY 2,000 mm 0.46% Jan. 2022 10 years
(Green bonds)
■ Investment corporation bonds 9,000
22Security Code
3453
04 Growth strategies focusing on stabilityGrowth strategies focusing on stability
Growth strategies
・Steady operation of shopping centers for daily needs in residential areas that provide daily necessities, even amid the prolonged
COVID-19 pandemic
・Unit price recovered NAV per unit as the market recognized the stability of shopping centers for daily needs, leading to the growth
strategy including public offering
・However, due to the volatile market conditions, conduct asset reshuffling if necessary, and continue focused investments in shopping
centers for daily needs and selective investment in retail distribution centers that meet the demand from e-commerce
Strategies in with/ post-pandemic era
Increase in unit price AUM expansion Credit improvement
➢ Improve the portfolio stability and ➢ Expand AUM through public ➢ Reduce funding costs
profitability through asset offering at appropriate timing
reshuffling ➢ Financing leveraging high credit
➢ Acquire assets using the sponsor rating (AA-)
➢ Conduct tenant reshuffling and support and proprietary network
leasing activities amid the
prolonged COVID-19 pandemic ➢ Pursuing a portfolio adapting to
environmental changes Promotion of ESG initiatives
➢ Make distinctive efforts, such as
property conversion and ➢ Strengthen the initiatives to
expansion achieve decarbonization targets
➢ Further enhance disclosures on
➢ Reduce the impact of increasing ESG in line with TCFD
costs, such as energy recommendations
➢ Expand green finance
24Growth strategies focusing on stability
Stabilized DPU and AUM targets
Stabilized DPU
Stabilized DPU(Note 1) Stabilized DPU
(JPY)
7,500 Increase due to temporary factors, such as capitalized tax effect(Note 2)
7,095
7,328
7,090
JPY 7,000 (Note 4)
7,000 6,846
6,486 6,535 6,546 6,595 6,500
6,477
6,500 6,255 6,299
6,044 6,115
5,974 6,449
6,000 5,807
5,500
5,000
4,500
4,000
0
3,500
1st period 2nd period 3rd period 4th period 5th period 6th period 7th period 8th period 9th period 10th period 11th period 12th period 13th period 14th period 15th period 16th period Mid-term
(Sep. 2015) (Mar. 2016) (Sep. 2016) (Mar. 2017) (Sep. 2017) (Mar. 2018) (Sep. 2018) (Mar. 2019) (Sep. 2019) (Mar. 2020) (Sep. 2020) (Mar. 2021) (Sep. 2021) (Mar. 2022) Forecast Forecast target
(Note 3)
(Sep. 2022) (Mar. 2023)
AUM
(JPYbn) JPY 340bn (Note 4)
350 PO
PO
PO
300
PO 245.2 247.2 253.6
250
PO 213.2 225.8 226.4 226.7
204.9 206.1 212.8
200 200.9
158.7 164.3
150 131.6
100 91.8
50
0
1st period 2nd period 3rd period 4th period 5th period 6th period 7th period 8th period 9th period 10th period 11th period 12th period 13th period 14th period Apr. 2022 Mid-term
(Sep. 2015) (Mar. 2016) (Sep. 2016) (Mar. 2017) (Sep. 2017) (Mar. 2018) (Sep. 2018) (Mar. 2019) (Sep. 2019) (Mar. 2020) (Sep. 2020) (Mar. 2021) (Sep. 2021) (Mar. 2022) target
Note 1: Stabilized DPU refers to estimated distributions excluding one-time factors, such as profit/loss on sale of property, changes in asset management fee due to such profit/loss, and investment unit performance fee, based on the assumption that property taxes are expensed.
Note 2: Capitalized tax effect refers to the case that the property taxes are not expensed in the first year of acquisition for the reason that the property taxes are settled with the previous owner and such amount is capitalized instead of being expensed.
Note 3: The substantial asset management period for the 1st FP was 233 days, however, it is adjusted to half year.
Note 4: The above targets largely depend on external factors, such as the market environment.
25Growth strategies focusing on stability
Providing consumers with retail infrastructure that grows in importance amid the pandemic
◼ The COVID-19 pandemic is accelerating the environment changes where the functions of retail and logistics facilities are getting similar
◼ The importance of shopping centers for daily needs and retail distribution centers increases as a retail infrastructure
Medium- to long-term changes in the market environment Acceleration of environment changes amid the COVID-19 pandemic
with the rise of e-commerce Changes in consumer behavior due to the experience of COVID-19
Changes in retail facilities Challenges faced by the logistics sector
Changes in consumer behavior amid the COVID-19 pandemic
with the rise of e-commerce with the rise of e-commerce
• Partnerships between online and brick-and- • Frequent small deliveries More demand for e-commerce
Change in lifestyles with rising
mortar retailers Large increase in home deliveries
• Shorter lead time stay-at-home demand
• Delivery of products from retail facilities
• Managing the last mile issue More people working from home
• Pickup of products at retail facilities Increased bulk purchases with less
(click-and-collect, curbside pickup) • Expanding needs for distribution centers close Increased mid-day population in
frequent shopping outside residential areas
• Integration of retail and logistics facilities to consumption areas
Providing infrastructure for new lifestyle
Delivery
Neighborhood
Acquisition shopping centers
Retail distribution centers
Leasing a portion of the
land of retail facilities to
logistics operators
Micro-fulfillment center for an (Kurume-Nishi Shopping Center) Acquisitions
online store partnered with a
Acquisitions grocery supermarket
Integration of (Kitera Town Fukuoka Nagahama)
retail and logistics Purchase in daily life
facilities
(Yokohama Kamigo Kitera Plaza Higashimatsuyama
Distribution Center) Picking up products Aobadai Shopping Center
at retail facilities Expansiton
Tenri Prima Meat
Distribution Packers Kinki
Home delivery (P-1 Plaza Tenno)
Center Center
Home delivery
Sun Street Hamakita
Delivery of products (Additional interest)
Consumers from retail facilities Receiving orders placed
(P-1 Plaza Tenno) through online in Supermarkets
parking lots (planned)
(Unicus Ina)
Purchase in daily life
Delivery
26Growth strategies focusing on stability
Portfolio composition
Resilience against COVID-19 and e-commerce
◼ 76.7% of the portfolio is COVID-19 resilient and 84.4% is e-commerce resilient
◼ More than half of the portfolio is both COVID-19 and e-commerce resilient
E-commerce resilience
Relatively weak Relatively strong
Groceries & Costco: 28.7%
Other retailers: 6.6% Master lease: 12.5%
Relatively Consumer electronics: 4.4% Home & garden: 10.4%
13.7% Distribution centers: 6.7%
63.0% 76.7%
strong Apparel (casual): 2.6%
Drug stores: 2.9%
Dollar shops: 1.6%
Office: 0.3%
COVID-19
resilience
Service oriented: 7.1%
Relatively Apparel (other) 1.9% Amusement: 6.0% 21.4%
weak Health clubs: 4.6%
Restaurants: 3.7%
84.4%
27Growth strategies focusing on stability
New acquisition (1)
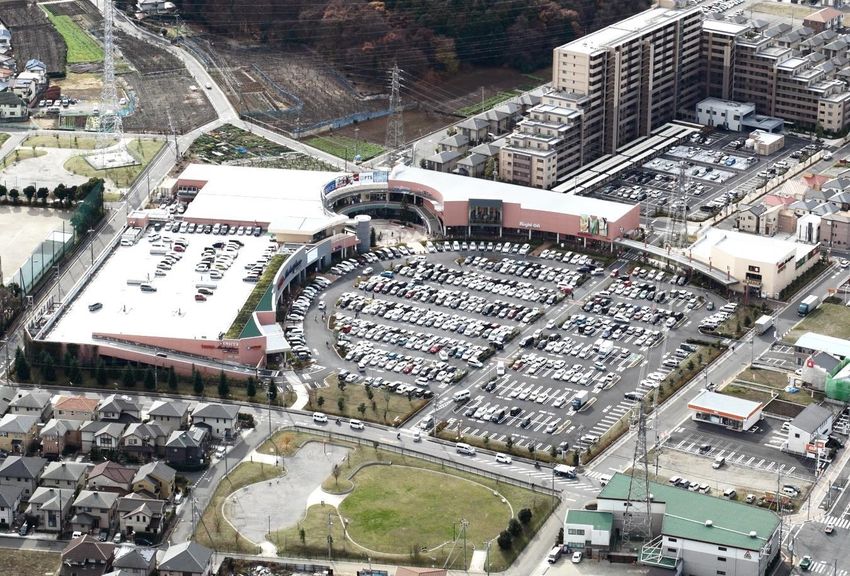
NSC Shopping Center
Neighborhood
Kitera Plaza Aobadai
An NSC aiming to revitalize as a shopping center for daily needs with a grocery store and Quiet and leafy environment and high transportation
Location
clinics, in an area with high population growth near Aobadai Station convenience with 30-minute direct access to Shibuya
Highly convenient location with 30-minute direct access from Aobadai Station to Shibuya Station
Trade area
Leafy area comfortable to live with many university campuses and parks around
【Before the conversion】
Population and number of households in Aoba-ku
(k, people) Population (left) (k, households)
350 Household (right) 150
136 138 139
133 135 140
132 133
130 131
129
130 Kodomonokuni
300
120
306 307 308 309 309 308 308 310 310 310
110
0 0
2013 2014 2015 2016 2017 2018 2019 2020 2021 2022
Highlights (year)
Source: Yokohama City Government (as of March 1 for each year)
◼ The property will be converted from a large health club
to an NSC. It is located near Tokyu Den-en-toshi Line’s
Tenants Lease to a highly competitive discount supermarket
Aobadai Station, where express trains stop, and within
After the large-scale conversion, lease to OK Corporation, which operates grocery stores mainly in
commuter district of the Tokyo metropolitan area Tenants
the Kanto region under the management policy of “High Quality / Everyday Low Price”
◼ The property is approximately 280m or a 4-minute walk
from Aobadai Station. The average number of
passengers using the station per day was over 110,000 Conversion Conversion project to reinforce the COVID-19 resilience
before the COVID-19 pandemic. There is a dense
commercial area in front of the station Key point of ✓ Covert into a shopping center for daily needs, which is resilient to
the project COVID-19 and e-commerce
Conversion
◼ KRR’s first large-scale conversion project Schedule for the project Before the conversion After the conversion
◼ KRR have executed fixed-term lease agreement and the Mar. 2022 Apr. 2022 Jan. 2023 Health club Supermarket,
Partial atrium pharmacy, etc.
occupancy rate based on the contracts is 53.7%. Acquired by Start of Scheduled +
◼ The property is expected to be operated as a convenient KRR conversion opening 3 to 4-layer structure Clinic (assumed)
retail facility featuring tenants that deal with daily
necessities and services including the grocery
supermarket, OK, which is expected to draw high (attic)
Jan. and Feb. Feb. 2022 Fall 2022 Pool Gym
customer traffic, and clinics
2022 Former tenant Scheduled Clinic (assumed)
Executed lease moved out completion of
agreements conversion Grocery store
Studio
Appraisal with new tenants
Acquisition Appraisal
JPY 2,553 mm Land area 1,792.26m2 JPY 3,610 mm NOI 4.7% Grocery store
price(Note1) value Reception Pharmacy, etc.
yield(Note2) Mar. 2023 Sep. 2023 Nov. 2023
Yokohama, Gross floor Appraisal OK Assumed Underground Underground
Location 5,537.46m2 JPY 162 mm Main tenant 71.2% 94.6% 100.0% parking parking
Kanagawa area NOI(Note2) Corporation occupancy rate
Note 1: The conversion cost will be added to the acquisition price after the completion of the conversion. Assumed cost of the conversion is JPY 880mm, which may increase or decrease.
Note 2: The appraisal NOI is based on the NOI after the completion of the conversion, which is on the appraisal report as of Mar. 31, 2022. The appraisal NOI yield is calculated by dividing the appraisal NOI by the sum of the acquisition price and the assumed costs of the
conversion. The same shall apply to the calculation of the average appraisal NOI yield of the portfolio. 28Growth strategies focusing on stability
New acquisition (2)
NSC Shopping Center L
Neighborhood
Higashimatsuyama Shopping Center Logistics Facility Tenri Distribution Center
An NSC housing a grocery store as the core tenant and specialty stores providing daily A distribution center expecting an increase in demand due to expansion of
necessities with easy access to wide areas including the city center logistics locations in the Greater Osaka area
Kumagaya
Acquisition price JPY 1,070 mm
Kizu IC
Shinrin-koen Konosu Location Tenri, Nara
Higashi-matsuyama Kitamoto
Land area 3,808.32m2
Heijo
Gross floor area 7,011.86m2 Yamato-Saidaiji Sta. Palace
Site
Kintetsu Todaiji
-Nara Sta. Temple
Omiya Nara
Kawagoe Appraisal value JPY 1,090 mm Bypass
Nara Sta.
Nara Park
Appraisal NOI JPY 59 mm Toshodaiji Temple
Yakushiji Temple
(tentative)
Appraisal NOI Nara IC
Higashi-matsuyama←→Ikebukuro
Akabane
5.5%
approx. 46 min. yield
Ikebukuro
Nippon Express
Shinrin-koen Main tenant Co., Ltd.
Kintetsu-Koriyama Sta.
Sta. Higashimatsuyama Shopping Center
(tentative)
Yamato-
Higashimatsuyama
City Office Highlights Tsutsui
Koriyama
IC Tenri-
Sta. Tenrii
Horyuji Higashi
Acquisition price JPY 4,080 mm Appraisal value JPY 4,650 mm Higashi-matsuyama Sta.
◼ The area is adjacent to Koriyama Interchange on Nishi-Meihan Temple
Koriyama-
Shimotsumichi JCT
IC
IC
Meihan National Route
Higashimatsuyama, Appraisal NOI JPY 260 mm Expressway and provides easy access to National Route 24 and Hirahata
Tenri Distribution Center
Location Prefectural Route 193. The area is expected to become more Yamato-
Sta.
Kintetsu Tenri Line
Saitama Appraisal NOI Mahoroba Tenri Sta.
6.4% Higashimatsuyama
convenient also for regional distribution and wide area distribution IC
Nikaidou
Land area 33,860.98m2 yield IC
Higashimatsuyama
Sta.
Gross floor area 24,894.94m2 Main tenant Seiyu Co., Ltd.
Enlarged
view Police Station ◼ Install solar panel on the roof to reduce environmental footprint
Highlights
Seiyu operates one of the largest grocery supermarkets in the area on the first floor of Seiyu building. The building
also features specialty stores including a dollar shop, fast food shops and service-oriented tenants on the first floor
L Logistics Facility Prima Meat Packers Kinki Center
and a large apparel store, health clubs, etc. on the second floor, providing convenience to the community A distribution center with advantages in easy access to CBD in the Greater Osaka
area and securing labor force
Located in the residential area in Higashimatsuyama City with steadily increasing Acquisition price JPY 1,047 mm
Location
population with excellent transportation access Location Osaka, Osaka
Land area 3,201.33m2 Toyonaka
◼ The property is located in the highly-populated Population and number of households in Higashimatsuyama City JCT
Gross floor area 6,971.47m2
residential area near Higashi-matsuyama Station. (k, people) Population (left) (k, households) Amagasaki IC
There are schools and factories surrounding the 91 Household (right)
41.2 41.8 45 Appraisal value JPY 1,080 mm
area, and the population and the number of 40.0 40.6 Shin-Osaka
38.0 38.7 39.3 Appraisal NOI JPY 60 mm Amagasaki Sta.
Sta.
households are increasing, mainly among families 90 37.4 40 Appraisal NOI
with young children and working generation 5.2% Hanshin Kashima Sta. Kashima IC
yield Amagasaki
◼ It has easy access to Route 407, the main road 89 35 Fukuda and
Sta.
Prima Meat Packers Kinki Center
connecting Saitama and Tochigi prefectures, and 89.5 89.7 90.0 90.0 90.2 90.2 90.3 90.4 Main tenant Partners Co., Ltd.
has the parking spaces for 998 vehicles 0 0
2015 2016 2017 2018 2019 2020 2021 2022 Osaka Sta.
(Year) Highlights
Osaka Umeda
Source: Higashimatsuyama City Government (as of Apr. 1 for each year) Sta.
◼ The property is located in Nishiyodogawa-ku, where logistics
Housing a leading grocery supermarket Seiyu and also featuring a drug store as well as facilities concentrate along Osaka Bay, and approximately 250m
Tenants from Kashima Interchange of Hanshin Expressway 11 Ikeda Route
specialty stores
◼ The area is one of the highly valued distribution since it has
◼ Seiyu building houses Seiyu as the core tenant, which operates more than 300 stores nationwide and has been focusing on potential as a delivery base for the two major consumption areas in
online supermarket by Rakuten Seiyu Netsuper, Inc., a group company. in the Kansai region and the property is in proximity to JR Tozai Universal Studios Japan Namba Sta.
◼ Sundrug building houses Sundrug, a major drugstore listed on the TSE Prime Market. The property’s tenant mix provides Line Kashima Station
high convenience to the community, and is resilient to the COVID-19 as well ◼ Prima Meat Packers, Ltd., a major food company, is the end tenant
29Growth strategies focusing on stability
Leveraging strong support from the Sponsor and Alliance Companies
◼ KRR achieves sustainable growth acquiring properties by utilizing the pipelines of its Sponsor and Alliance Companies
◼ KRR aims to further expand AUM by leveraging strong support from the Kenedix Group and Alliance Companies
Sponsor’s enhancement of support capability Strong support from the Kenedix Group and Alliance Companies
70% equity share through a
group company
Asset management
Strategic partnership Property management
backed by capital-business alliance
Kenedix Real Estate
Kenedix Retail REIT Corporation Fund Management, Inc. (“KFM”)
Synergy effects assumed by Kenedix
Support for growth toward AUM of 4 trillion yen (in 2025) as set forth in long-term vision
1 “Kenedix Vision 2025”
Pipeline support
2 Improvement of creditworthiness and fund-raising ability
Warehousing
3 Support for implementation of new business
4 Acceleration of overseas business development and expansion of overseas client investors Leasing Financing functions Leasing
for bridge funds
5 Strengthening of SDGs management
Property management Property management
External growth by utilizing Sponsor and Alliance Companies pipelines Environmental technology/ knowhow
Evaluation/
Breakdown of acquisitions Sample pipelines(Note) Advisory on operations
(Based on acquisition price) Personnel support
Others Sponsor
24.1% 49.1% Right to use trademarks
Alliance
Companies
Sponsor
26.8% YorkMart Higashimichinobe Alliance Companies Other Alliance Companies
/ support-line company
Acquisitions from
the Sponsor /
Alliance Companies
Acquisitions from
75.9% Underlying land of a retail Kenedix
Kenedix, Inc. Sumitomo Mitsui Finance JINUSHI P&D Consulting
facility in Hiroshima Investment and Leasing Co., Ltd. Co., Ltd. Co., Ltd.
SMFL Group Partners, Inc.
21.7% SMFL MIRAI Partners Co., Ltd.
Note: These are the properties which are owned by Alliance Companies and confirmed by both our Alliance Companies and KRR as the : KFM’s parent companies
properties that meet KRR’s investment criteria. As of the date of this material, KRR has not decided to acquire these properties and
there is no guarantee that it can acquire these properties in the future. 30Growth strategies focusing on stability
Promoting ESG initiative
KRR promotes ESG initiative for the purpose of enhancing unitholder value in medium- to long-term
Key ESG initiatives
Earned GRESB Rating Set GHG emission reduction targets
Green finance
in the 2021 GRESB Real Estate Disclosed analysis on climate change
in line with TCFD recommendation
E Earned
third consecutive
Green bonds
(outstanding JPY 2bn)
Environment GRESB Green loans
4 Star Rating (outstanding JPY 7bn)
Hosting Hosting SDGs
S Collaboration with
local communities
used clothing
collecting event
enlightening event
for children
Social
Unitholder value-linked Same boat Kenedix Group’s
G management fee
structure
investment
by Kenedix, Inc.
strong
commitment
Governance
Sustainability Office Sustainability Committee
Establishment of Sustainability Office and
✓ Dealing matters relating to sustainability and ESG in KFM
Sustainability Committee ✓ Chaired by the President of KFM, for the purpose of
✓ Published the first Sustainability Report of KFM, introducing
covering REITs managed by KFM ESG initiatives of its managing REITs
enhancing approaches to sustainability and ESG
31Growth strategies focusing on stability
ESG initiatives (Environment and Social)
Environment initiatives Social initiatives
The number of certified properties and certified floor area (as of Apr. 30, 2022) Contribution to local communities
Collaboration with local Hosting used clothing SDGs enlightening event for
The number of properties Certified floor area Ratio collecting event children
communities
✓Entering into agreements, ✓Hosting an event organized ✓Holding an event
20 538,870.72m2 63.3% (New target: 70%) allowing the property to be by BRING, a project aimed featuring essence of
used as a temporary at recycling used clothing SDGs
Certification for Building- shelter at emergency
DBJ Green Building Certification for
Housing Energy-efficiency
Certification CASBEE for Real Estate
Labeling System (BELS)
10 certified properties 10 certified properties 1 certified property
★★★ S rank ★★★★★ ★★★★★ Ashico Town Ashikaga Blumer Maitamon Sun Street Hamakita
MONA Shin-Urayasu Apita Terrace Yokohama Tsunashima Apita Terrace Yokohama Tsunashima
Passaggio Nishiarai Homecenter Kohnan Sunadabashi Bicycle sharing Supporting Japan for UNHCR
Unicus Ina Resora Obu Shopping Terrace ✓Providing a portion of the properties ✓ Providing common areas of our properties for their
Blumer HAT Kobe Kitera Town Chofu fund-raising campaign
in order to provide services to users
Kawamachi Yahagi Mall Unicus Yoshikawa ✓In 2021, the campaign locations were provided at the
Carino Esaka Kalsa Hiratsuka
of facilities and residents in the
Roseo Mito vicinity, and to reduce following properties
Blumer Maitamon
Ashico Town Ashikaga COMBOX Komyoike environmental impact
Sun Street Hamakita A rank ★★★★ Property name
★★ Musashi Ranzan Distribution Center
Passaggio Nishiarai
Yumemachi Narashinodai Mall Costco Wholesale Sapporo Warehouse
Blumer Maitamon
Blumer HAT Kobe
Solar panel installation LED lights installation Carino Esaka
Ina 54 of our 56 properties COMBOX Komyoike
Yahagi excl. land-only properties Passaggio Nishiarai
MONA Shin-Urayasu Resora Obu Shopping Terrace
Tsunashima installed LED entirely or
Monenosato (Newly installed) partially
Improving tenant satisfaction
Narashinodai (Newly installed)
Tenri (Newly acquired) Renovation work according to tenant satisfaction survey
Monenosato Mall MONA Shin-Urayasu ✓ Based on the outcome of the annual survey, appropriate replacement of equipment or renewal of
facilities being undertaken, securing continuance of current tenancy in a number of leases
Mid- to long-term GHG emission reduction targets
(compared to fiscal year 2015 (per unit))
In fiscal year 2030 By 2050
40% reduction Carbon neutrality
MONA Shin-Urayasu Blumer Maitamon
32Growth strategies focusing on stability
ESG initiatives (Governance)
The Kenedix Group’s strong commitment to J-REITs Unitholder value-linked management fee structure
Because of the importance of the J-REIT business to the Kenedix Group, Introduction of fee structure to provide incentives to enhance unitholder value
KRR’s sound growth is in line with Kenedix’s interests
Method for calculation
J-REIT
Private REIT / Private funds Subject of calculation Rates
/ Foreign REIT
46.5%
47.5% Total assets 0.27%
Ⅰ
Asset management fee (end of previous FP) (annual rate)
Properietary
investments 5.9% Ⅱ Net income × DPU 0.0013%
Investment in KRR by Kenedix, Inc. (as of Mar. 31, 2022) Investment unit performance KRR’s excess return ×
0.1%
Number of units owned Ownership fee Market capitalization
16,950 units 2.9%
Acquisition fee (Note 2) Acquisition price 1.0%
Decision-making process for related-party transactions (Note 1) Disposition fee Disposition price 0.5%
Preparation of Appraisal value of 1.0%
Relevant department Merger fee
proposal assets to be succeeded (maximum)
Disapproved
or remand
Revision to the investment unit performance fee structure
Confirmation of • The purpose of the revision determined in Dec. 2021 is to increase the linkage
Compliance Officer between unitholder returns and the asset management fee
proposal
• Revised the method of calculation to factor in a case where KRR’s investment
unit prices underperform the TSE REIT Index
Deliberation
Compliance Committee KRR’s excess return KRR’s market capitalization 0.1%
and resolution
KRR’s total return TSE REIT Total Return Index
Deliberation Asset Management Committee (Growth rate for the same period
(Growth rate considering dividends)
and resolution of Retail REIT Department considering dividends)
In case of negative excess return
Deliberation
and resolution
KRR Board of Directors • No investment unit performance fee
• Negative performance figures are caried over to the next period
Revised (only for one FP)
point If the next period’s excess return is positive, the excess return is
Note 1: Transactions within the scope of insignificance criteria are excluded from the decision-making process above. offset by the previous period’s negative performance figure
Note 2: Including acquisition of buildings through expansion or reconstruction.
33Security Code
3453
05 Key characteristics of KRRKey characteristics of KRR
Investments focusing on shopping centers for daily needs
“Daily / Neighborhood” type “Weekend / Destination” type
KRR’s focus: Neighborhood, community and The majority of portfolio properties of preceding
other shopping centers for daily needs listed retail-focused J-REITs
Small Trade area Large
High Frequency of customer visits Low
Property types Characteristics Trade Large-scale suburban retail properties
area
Neighborhood RSC (Regional shopping centers)
Shopping centers with a supermarket as
NSC shopping an anchor or core tenant
3-5km
centers
Stand-alone stores that primarily
GMS (General merchandise stores)
SM Supermarkets provide groceries
3km Stand-alone GMS is excluded from our investment criteria
Community Larger Shopping centers than NSC, Outlet malls
CSC shopping with a supermarket as an anchor or 5-10km
centers core tenant
Shopping centers in the immediate
Urban Station-Front vicinity of an urban public 3-10km Urban retail properties featuring
transportation station
Specialty stores such as drug stores, High-end brand shops
SS Specialty stores convenience stores, health clubs or 1-10km
electronic appliance stores
35You can also read