Long-Term Trash Load Reduction Plan and Assessment Strategy
←
→
Page content transcription
If your browser does not render page correctly, please read the page content below
Long-Term Trash Load Reduction Plan
            and Assessment Strategy

                                                     Submitted by:

                                                   City of Millbrae
                                            621 Magnolia Avenue
                                               Millbrae, CA 94030

          In compliance with Provisions C.10.c of Order R2-2009-0074

                                               December 20, 2013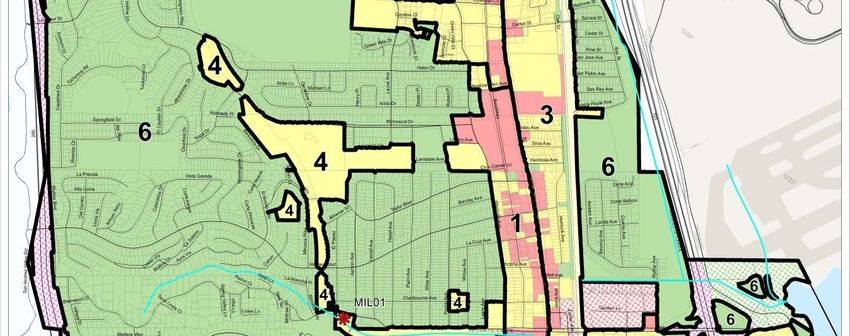
Page Intentionally Left Blank

             ii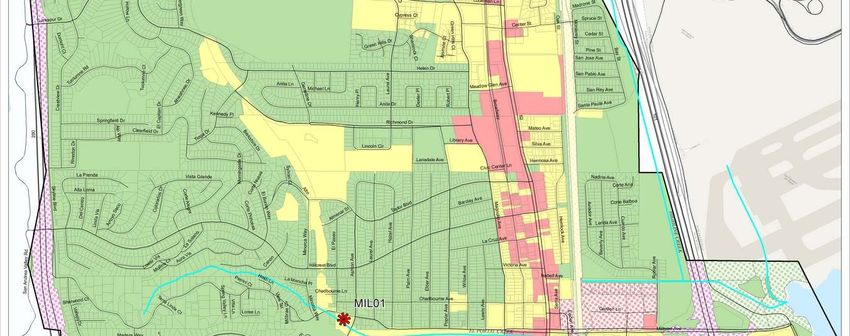
1/28/2014
City of Millbrae

          TABLE OF CONTENTS
          CERTIFICATION STATEMENT ............................................................................................................................................. III
          TABLE OF CONTENTS ...............................................................................................................................................................IV
          LIST OF TABLES .......................................................................................................................................................................... V
          LIST FIGURES ............................................................................................................................................................................... V
          ABBREVIATIONS ........................................................................................................................................................................VI
          PREFACE ....................................................................................................................................................................................... 1
          1.0           INTRODUCTION ......................................................................................................................................................... 2
              1.1 PURPOSE OF LONG-TERM TRASH REDUCTION PLAN....................................................................................................................2
              1.2 BACKGROUND .......................................................................................................................................................................................2
                 1.2.1 Long-Term Trash Load Reduction Plan Framework............................................................................... 2
                 1.2.2 BASMAA Generation Rates Project ....................................................................................................... 3
                 1.2.3 Short-Term Trash Load Reduction Plan ................................................................................................. 5
              1.3 ORGANIZATION OF LONG-TERM PLAN ............................................................................................................................................7
          2.0           SCOPE OF THE TRASH PROBLEM ........................................................................................................................ 8
              2.1 PERMITTEE CHARACTERISTICS .........................................................................................................................................................8
              2.2 TRASH SOURCES AND PATHWAYS ....................................................................................................................................................8
              2.3 TRASH GENERATING AREAS ........................................................................................................................................................... 10
                 2.3.1 Generation Categories and Designation of Areas ............................................................................... 10
                 2.3.2 Summary of Trash Generating Areas and Sources .............................................................................. 11
          3.0           TRASH MANAGEMENT AREAS AND CONTROL MEASURES.......................................................................15
              3.1 MANAGEMENT AREA DELINEATION AND PRIORITIZATION ...................................................................................................... 15
              3.2 CURRENT AND PLANNED TRASH CONTROL MEASURES ............................................................................................................ 20
                 3.2.1 Trash Management Area #1 ............................................................................................................... 20
                 3.2.2 Trash Management Area #2 ............................................................................................................... 26
                 3.2.3 Trash Management Area #3 ............................................................................................................... 28
                 3.2.4 Trash Management Area #4 ............................................................................................................. 289
                 3.2.5 Trash Management Area #5 ............................................................................................................... 31
                 3.2.6 Trash Management Area #6 ............................................................................................................... 33
                 3.2.7 Jurisdiction-wide Control Measures .................................................................................................... 34
                 3.2.8 Creek and Shoreline Hot Spot Cleanups .............................................................................................. 37
                 3.2.9 Summary of Trash Control Measures .................................................................................................. 38
              3.3 CONTROL MEASURE IMPLEMENTATION SCHEDULE ................................................................................................................... 40
          4.0           PROGRESS ASSESSMENT STRATEGY ................................................................................................................44
              4.1 SMCWPPP PILOT ASSESSMENT STRATEGY ............................................................................................................................... 44
                 4.1.1 Management Questions...................................................................................................................... 44
                 4.1.2 Indicators of Progress and Success...................................................................................................... 44
                 4.1.3 Pilot Assessment Methods .................................................................................................................. 45
              4.2 BASMAA “TRACKING CALIFORNIA’S TRASH” PROJECT ........................................................................................................... 48
                 4.2.1 Testing of Trash Monitoring Methods................................................................................................. 49
                 4.2.2 Full Capture Equivalent Studies........................................................................................................... 49
              4.3 LONG-TERM ASSESSMENT STRATEGY .......................................................................................................................................... 49
              4.4 IMPLEMENTATION SCHEDULE ........................................................................................................................................................ 49
          5.0           REFERENCES .............................................................................................................................................................51

                                                                                                             iv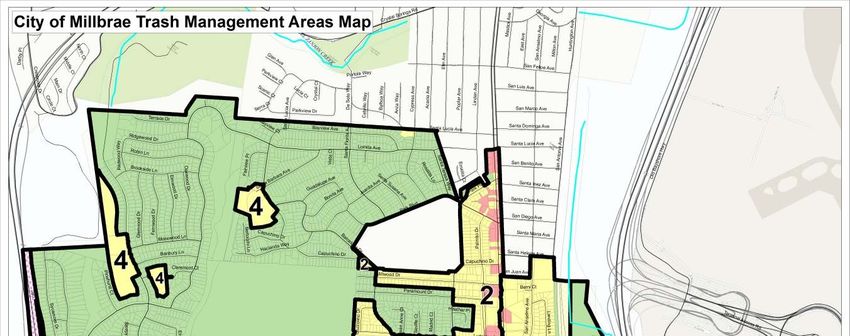
Long-Term Trash Load Reduction Plan

LIST OF TABLES
TABLE 1. SAN FRANCISCO BAY AREA TRASH GENERATION RATES BY LAND USE (GALLONS/ACRE/YEAR).
TABLE 2. PERCENTAGES OF THE CITY OF MILLBRAE'S JURISDICTIONAL AREA WITHIN LAND USE CLASSES IDENTIFIED BY ABAG
     (2005)
TABLE 3. TRASH GENERATION CATEGORIES AND ASSOCIATED GENERATION RATES (GALLONS/ACRE/YEAR).
TABLE 4. DEFINITIONS OF ON-LAND TRASH ASSESSMENT CONDITION CATEGORIES.
TABLE 5. PERCENTAGE OF JURISDICTIONAL AREA WITHIN THE CITY/COUNTY OF CITY OF MILLBRAE ASSIGNED TO EACH TRASH
     GENERATION CATEGORY.
TABLE 6. JURISDICTIONAL AREA AND PERCENTAGE OF EACH TRASH MANAGEMENT AREA (TMA) COMPRISED OF TRASH
     GENERATION CATEGORIES
TABLE 7. CITY OF MILLBRAE TRASH CONTROL MEASURE IMPLEMENTATION SCHEDULE.
TABLE 8. TRASH CONDITION CATEGORIES USED IN THE DRAFT ON-LAND VISUAL ASSESSMENT PROTOCOL.
TABLE 9. CITY OF MILLBRAE TRASH PROGRESS ASSESSMENT IMPLEMENTATION SCHEDULE.

LIST FIGURES
FIGURE 1.   EIGHT-STEP FRAMEWORK FOR DEVELOPING, IMPLEMENTING AND REFINING LONG-TERM TRASH REDUCTION PLANS.
FIGURE 2.   CONCEPTUAL MODEL OF TRASH GENERATION, INTERCEPTION AND LOAD.
FIGURE 3.   TRASH SOURCES CATEGORIES AND TRANSPORT PATHWAYS TO URBAN CREEKS.
FIGURE 4.   TRASH SOURCES CATEGORIES AND TRANSPORT PATHWAYS TO URBAN CREEKS.
FIGURE 5.   FINAL TRASH GENERATION MAP FOR THE CITY OF MILLBRAE
FIGURE 6.   TRASH MANAGEMENT AREA MAP FOR THE CITY OF MILLBRAE
FIGURE 7.   TRASH FULL CAPTURE DEVICE MAP FOR THE CITY OF MILLBRAE.

                                                      v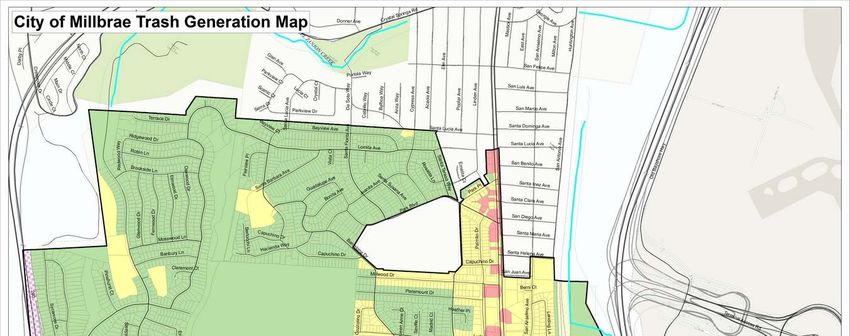
City of Millbrae

          ABBREVIATIONS

          BASMAA        Bay Area Stormwater Management Agencies Association
          BID           Business Improvement District
          CalRecycle    California Department of Resources Recycling and Recovery
          Caltrans      California Department of Transportation
          CASQA         California Stormwater Quality Association
          CDS           Continuous Deflection Separator
          CEQA          California Environmental Quality Act
          CY            Cubic Yards
          EIR           Environmental Impact Report
          EPA           Environmental Protection Agency
          FY            Fiscal Year
          GIS           Geographic Information System
          MRP           Municipal Regional Stormwater NPDES Permit
          MS4           Municipal Separate Storm Sewer System
          NGO           Non-Governmental Organization
          NPDES         National Pollutant Discharge Elimination System
          Q             Flow
          SFRWQCB       San Francisco Regional Water Quality Control Board
          SWRCB         State Water Resource Control Board
          TCD           Trash Capture Device
          TMA           Trash Management Area
          TMDL          Total Maximum Daily Load
          USEPA         United States Environmental Protection Agency
          USW-1         United Stormwater Full Capture Connector Pipe Screen Treatment Device
          USW-2         United Stormwater Partial Capture Clean Screen III Curb Inlet Screen
          Water Board   San Francisco Regional Water Quality Control Board
          WDR           Waste Discharge Requirements

                                                          vi
Long-Term Trash Load Reduction Plan

PREFACE
This Long-Term Trash Load Reduction Plan and Assessment Strategy (Long-Term Plan) is
submitted in compliance with provision C.10.c of the Municipal Regional Stormwater NPDES Permit
(MRP) for Phase I communities in the San Francisco Bay (Order R2-2009-0074). The Long-Term
Plan was developed using a regionally consistent outline and guidance developed by the Bay Area
Stormwater Management Agencies Association (BASMAA) and reviewed by San Francisco Bay
Regional Water Quality Control Board staff. The Long-Term Plan is consistent with the Long-Term
Trash Load Reduction Framework developed in collaboration with Water Board staff. Its content is
based on the City of Millbrae’s current understanding of trash problems within its jurisdiction and
the effectiveness of control measures designed to reduce trash impacts associated with Municipal
Separate Storm Sewer (MS4) discharges. This Long-Term Plan is intended to be iterative and may
be modified in the future based on information gained through the implementation of trash control
measures. The City of Millbrae therefore reserves the right to revise or amend this Long-Term Plan
at its discretion. If significant revisions or amendments are made by the City, a revised Long-Term
Plan will be submitted to the Water Board through the City’s annual reporting process.

                                                 1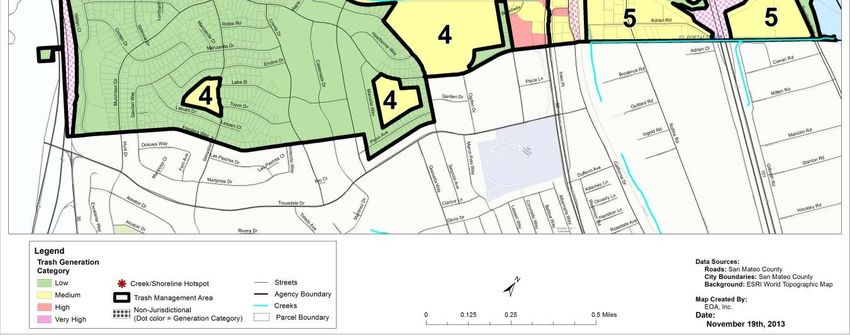
City of Millbrae

          1.0 INTRODUCTION
          1.1      Purpose of Long-Term Trash Reduction Plan
          The Municipal Regional Stormwater National Pollutant Discharge Elimination System (NPDES)
          Permit for Phase I communities in the San Francisco Bay (Order R2-2009-0074), also known as the
          Municipal Regional Permit (MRP), became effective on December 1, 2009. The MRP applies to 76
          large, medium and small municipalities (cities, towns and counties) and flood control agencies in
          the San Francisco Bay Region, collectively referred to as Permittees. Provision C.10.c of the MRP
          requires Permittees to submit a Long-Term Trash Load Reduction Plan (Long-Term Plan) by
          February 1, 2014. Long-Term Plans must describe control measures that are currently being
          implemented, including the level of implementation, and additional control measures that will be
          implemented and/or increased level of implementation designed to attain a 70% trash load
          reduction by July 1, 2017, and 100% (i.e., “No Adverse Impact”) by July 1, 2022.

          This Long-Term Plan is submitted by the City of Millbrae in compliance with MRP provision C.10.c.
          Consistent with provision C.10 requirements, the goal of the Long-Term Plan is to solve trash
          problems in receiving waters by reducing the impacts associated with trash in discharges from the
          City of Millbrae’s municipal separate storm sewer system (MS4) that are regulated by NPDES
          Permit requirements. The Long-Term Plan includes:
               1. Descriptions of the current level of implementation of trash control measures, and the type
                  and extent to which new or enhanced control measures will be implemented to achieve a
                  target of 100% (i.e. full) trash reduction from MS4s by July 1, 2022, with an interim
                  milestone of 70% reduction by July 1, 2017;
               2. A description of the Trash Assessment Strategy that will be used to assess progress
                  towards trash reduction targets achieved as a result of control measure
                  implementation; and,
               3. Time schedules for implementing control measures and the assessment strategy.

          The Long-Term Plan was developed using a regionally consistent outline and guidance developed
          by the Bay Area Stormwater Management Agencies Association (BASMAA) and reviewed by the San
          Francisco Bay Regional Water Quality Control Board (Water Board) staff. The Long-Term Plan is
          consistent with the Long-Term Trash Load Reduction Framework (see section 1.2.1) developed in
          collaboration with Water Board staff. Its content is based on the City of Millbrae’s current
          understanding of trash problems within its jurisdiction and the effectiveness of control measures
          designed to reduce trash impacts associated with Municipal Separate Storm Sewer (MS4)
          discharges. The Long-Term Plan builds upon trash control measures implemented by the City prior
          to the adoption of the MRP and during the implementation of the Short-Term Trash Load Reduction
          Plan submitted to the Water Board on February 1, 2012.

          1.2      Background
          1.2.1 Long-Term Trash Load Reduction Plan Framework
          A workgroup of MRP Permittee, Bay Area countywide stormwater program staff and Water Board
          staff met between October 2012 and March 2013 to better define the process for developing and

                                                            2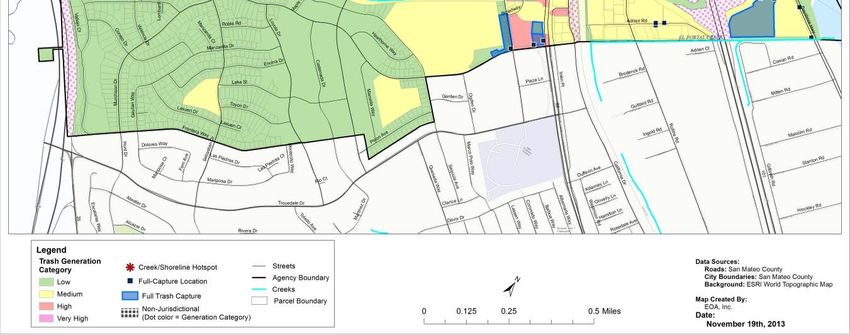
Long-Term Trash Load Reduction Plan

implementing Long-Term Plans, methods for assessing progress toward reduction goals, and
tracking and reporting requirements associated with provision C.10. Through these discussions, an
eight-step framework for developing and implementing Long-Term Plans was created by the
workgroup (Figure 1).

          1. Identify and map trash generating areas

                   2. Identify trash sources
                         (as needed)

           3. Delineate and prioritize management              8. Modify area designations &
                            areas                               reprioritize areas / problems

              4. Identify/select control measures          7. Assess progress via defined methods

            5. Define method(s) to assess progress            6. Implement control measures

Figure 1. Eight-step framework for developing, implementing and refining Long-Term Trash Reduction
Plans.

The workgroup agreed that as the first step in the framework, Permittees would identify very high,
high, moderate, and low trash generating areas in their jurisdictional areas. Trash generation rates
developed through the BASMAA Baseline Trash Generation Rates Project (as discussed below) were
used as a starting point for differentiating and delineating land areas with varying levels of trash
generation. Permittees would then use local knowledge and field and/or desktop assessments to
confirm or refine the level of trash generation for specific areas within their jurisdiction. Each
Permittee would then develop a map depicting trash generation categories within their jurisdiction.

As a next step, Permittees would then delineate and prioritize Trash Management Areas (TMAs)
where specific control measures exist or are planned for implementation. TMAs delineated by
Permittees are intended to serve as reporting units in the future. Reporting at the management area
level provides the level of detail necessary to demonstrate implementation and progress towards
trash reduction targets.

Once control measures are selected and implemented, Permittees will evaluate progress toward
trash reduction targets using outcome-based assessment methods. As the results of the progress
assessments are available, Permittees may choose to reprioritize trash management areas and
associated control measures designed to improve trash reduction within their jurisdictions.

1.2.2 BASMAA Generation Rates Project
Through approval of a BASMAA regional project in 2010, Permittees agreed to work collaboratively
to develop a regionally consistent method to establish trash generation rates within their

                                                       3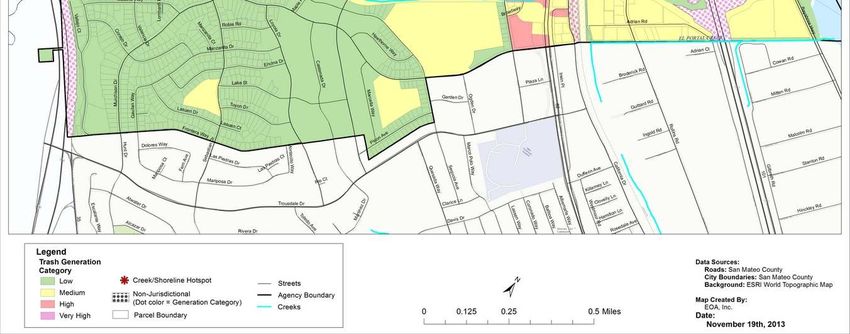
City of Millbrae

          jurisdictions. The project, also known as the BASMAA Trash Generation Rates Project (Generation
          Rates Project) assisted Permittees in establishing the rates of trash generation and identifying very
          high, high, moderate and low trash generating areas.

          The term “trash generation” refers to the rate at which trash is produced or generated onto the
          surface of the watershed and is potentially available for transport via MS4s to receiving waters.
          Generation rates do not explicitly take into account existing control measures that intercept trash
          prior to transport. Generation rates are expressed as trash volume/acre/year and were established
          via the Generation Rates Project.

          In contrast to trash generation, the term “trash loading” refers to the rate at which trash from MS4s
          enters receiving waters. Trash loading rates are also expressed as trash volume/acre/year and are
          equal to or less than trash generation rates because they account for the effects of control measures
          that intercept trash generated in an area before it is discharged to a receiving water. Trash loading
          rates are specific to particular areas because they are dependent upon the effectiveness of control
          measures implemented within an area. Figure 2 illustrates the difference between trash generation
          and loading.

                            Figure 2. Conceptual model of trash generation, interception and load.

          Trash generation rates were estimated based on factors that significantly affect trash generation
          (i.e., land use and income). The method used to the establish trash generation rates for each
          Permittee builds off “lessons learned” from previous trash loading studies conducted in urban areas
          (Allison and Chiew 1995; Allison et al. 1998; Armitage et al. 1998; Armitage and Rooseboom 2000;
          Lippner et al. 2001; Armitage 2003; Kim et al. 2004; County of Los Angeles 2002, 2004a, 2004b;
          Armitage 2007). The method is based on a conceptual model developed as an outgrowth of these
          studies (BASMAA 2011b).

          Trash generation rates were developed through the quantification and characterization of trash
          captured in Water Board-recognized full-capture treatment devices installed in the San Francisco
          Bay area. Trash generation rates estimated from this study are listed for each land use type in.
          Methods used to develop trash generation rates are more fully described in BASMAA (2011b,
          2011c, and 2012).

                                                              4
Long-Term Trash Load Reduction Plan
Table 1. San Francisco Bay Area trash generation rates by land use (gallons/acre/year).
Land Use Lowb Bestb Highb
Commercial & Services 0.7 6.2 17.3
Industrial 2.8 8.4 17.8
Residentiala 0.3 - 30.2 0.5 - 87.1 1.0 - 257.0
Retaila 0.7 - 109.7 1.8 - 150.0 4.6 - 389.1
K-12 Schools 3 6.2 11.5
Urban Parks 0.5 5.0 11.4
aFor residential and retail land uses, trash generation rates are provided as a range that takes into account the correlation between
rates and household median income.
b For residential and retail land uses: Low = 5% confidence interval; Best = best fit regression line between generation rates and
household median income; and, High = 95% confidence interval. For all other land use categories: High = 90th percentile; Best = mean
generation rate; and, Low = 10th percentile.
1.2.3 Short-Term Trash Load Reduction Plan
In February 2012, the City of Millbrae developed a Short-Term Plan that described the current level
of control measures implementation and identified the type and extent to which new or enhanced
control measures would be implemented to attain a 40% trash load reduction from its MS4 by July
1, 2014. Since that time, the City of Millbrae has begun to implement its short-term plan. Control
measures implemented to date via the short-term trash reduction plan are:
• Single-Use Carryout Plastic Bag Ordinance
The Single-Use Carryout Bag Ordinance (No 742), adding section 6.50 to the Millbrae Municipal Code,
was adopted at the February 14, 2012 City Council meeting. The Ordinance, which became effective
on September 1, 2012, prohibits the use of single-use carryout plastic bags and the distribution of
free paper bags at retail stores, including grocery stores, supermarkets, convenience stores, drug
stores, clothing stores, and other retail stores. Stores are allowed to distribute paper bags that
contain a minimum of 40 percent post-consumer recycled content for a minimum charge of $0.10 for
each point-of-sale paper bag. The stores retain the charge for the bags. The Ordinance does not apply
to protective types of bags, including for meat, produce, and bakery items. The businesses exempt
from the Ordinance include food vendors, such as restaurants and take-out food establishments; dry
cleaners; and non-profit charitable reuse organizations. New businesses were informed during the
businesses license application process and followed up by staff to ensure compliance. New
businesses are required to fill out an Acknowledgement and Verification Form that they understand
and will comply with the regulations. One business had a site visit inspection and was provided
information for complying with the regulations; the business switched to compliant bags. No
citations were issued. Businesses are required to maintain records for three years for the charge on
paper bags. The City continued to distribute reusable cloth shopping bags made from 100 percent
post-consumer recycled plastic bottles to Millbrae residents and has distributed over 8,500 reusable
bags to date.
• Public Education and Outreach Programs
The City of Millbrae participates in the regional Be the Street Campaign geared toward youth and has
posted the information to the City’s website. In addition, County staff conducted the Campaign at the
fall 2013 Coastal Cleanup Day. Efforts are planned to have the Campaign conducted at the local high
school and middle school in 2014. Classroom presentations are conducted throughout the school
year and include litter prevention and water pollution prevention. Assemblies at the grade schools
5City of Millbrae
incorporate picking up litter and address water pollution prevention. Community wide and school
outreach is conducted twice a year for volunteer litter cleanups.
• Improved Trash Bin/Container Management
In an effort to decrease the amount of litter in the downtown and northern management areas, the
City revised the collection schedule to increase the collection frequency for identified public trash
bins and decrease collection for trash bins in other areas that do not need as much service. In
addition, tenants identified as not having trash service within the Downtown area were contacted
and informed to start service. Additional outreach is planned for tenants in the downtown area to
encourage them to recycle and use trash bins allocated for their apartments and to not use the public
trash bins. In addition, the City installed a large solar-operated trash compacting container next to a
coffee shop where the public trash bin was continually overflowing with paper cups. To reduce the
amount of paper placed in a public trash bin at the Millbrae Post Office, City staff worked with the
Post Office to place an additional recycling container inside for the collection of unwanted
mail/mixed paper. Outreach is also being done to identify companies who distribute bundles of
newspapers in front of stores to reduce the potential for the newspapers to end up as litter. The City
is also looking at placing a garbage enclosure in a parking lot behind a busy section of the downtown
to accommodate waste from two restaurants and other businesses.
• On-Land Trash Clean-Ups
Beginning in 2012, the City of Millbrae began an annual citywide Earth/Arbor day trash clean-up
effort that addresses 12 sites throughout the City, including Trash Management Areas 1, 3, 4, 5 and 6.
This year, the clean-up took place on April 27, 2013 and included 125 community volunteers and 5
City staff members. Their collaborative efforts resulted in the collection of a total of 2 ¾ yards of
trash and 96 gallons of cans/bottles/containers and 2 yards (404 gallons) of paper/cardboard that
were collected separately and recycled.
• Partial Capture Treatment Devices
The City installed a total of 19 partial-capture treatment devices with funding provided through the
San Francisco Bay-area Wide Trash Capture Demonstration Project administered by San Francisco
Estuary Partnership (SFEP). Devices are currently maintained at a frequency of two times per year
with additional inspections and maintenance conducted, as necessary, after storms. To date, the City
has not experienced any issues or problems with these devices.
• Full Capture Treatment Devices
The City installed 27 United Stormwater “USW-1” full-capture treatment devices at various locations
in Trash Management Areas 1, 3, 5 and 7 during August 2012. The total area treated by these devices
is 27.24 acres. The City also installed 11 additional full-capture devices (two in TMA #2; four in TMA
#3; and five in TMA#5) in November 2013. The total drainage acreage associated with these devices
has not yet been calculated.
Control measures described in this Long-Term Plan build upon actions taken to-date via the City of
Millbrae’s Short-Term Plan. A full description of control measures implemented via short and long-
term plans is included in section 3.2. Outcomes associated with short-term plan implementation
will be reported in the City of Millbrae’s FY 2013-2014 Annual Report, scheduled for submittal to
the Water Board by September 15, 2014.
6Long-Term Trash Load Reduction Plan
1.3 Organization of Long-Term Plan
This Long-Term Plan is organized into the following sections:
1.0 Introduction;
2.0 Scope of the Trash Problem;
3.0 Trash Management Areas and Control Measures;
4.0 Progress Assessment Strategies; and
5.0 References
Section 2.0 is intended to provide a description of the extent and magnitude of the trash problem in
the City of Millbrae’s Control measures that will be implemented by the City of Millbrae as a result
of this Long-Term Plan are described in section 3.0. Section 4.0 describes the methods that will be
used to assess progress toward trash reduction targets.
7City of Millbrae
2.0 SCOPE OF THE TRASH PROBLEM
2.1 Permittee Characteristics
Incorporated in 1948, the City of Millbrae covers 2,086 acres in Santa Mateo County, and has a
jurisdictional area of 1,650 acres. According to the 2010 Census, it has a population of 21,532, with
a population density of 6,606.9 people per square mile, and average household size of 2.65. Of the
21,532 who call the City of Millbrae home, 20.1% are under the age of 18, 7.1% are between 18 and
24, 23.0% are between 25 and 44, 30.1% are between 45 and 65, and 19.7% are 65 or older.
Top employers in the City of Millbrae include City and County of San Francisco, Millbrae School
District, Starwood Hotels & Resorts Worldwide, Best Western El Rancho Inn & Suites, and the City
of Millbrae. The median household income was $68,404 in 20001.
Land uses within the City of Millbrae depicted in ABAG (2005) are provided in
Table 2. The City of Millbrae is primary comprised of 6 land uses. These include: Commercial,
Industrial, Residential, Retail, K-12 Schools, and Urban Parks.
Table 2. Percentages of the City of Millbrae's jurisdictional area2 within land use classes identified by ABAG
(2005)
% of
Jurisdictional Area
Land Use Category Jurisdictional
(Acres)
Area
Commercial and Services 100.2 5.1%
Industrial 20.5 1.0%
Residential 1,339.5 68.4%
Retail 84.8 4.3%
K-12 Schools 94.0 4.8%
Urban Parks 51.6 2.6%
2.2 Trash Sources and Pathways
Trash in San Francisco Bay Area creeks and shorelines originates from a variety of sources and is
transported to receiving waters by a number of pathways (Figure 3). Of the four source categories,
pedestrian litter includes trash sources from high traffic areas near businesses and schools,
1
From the 2000 Census. The median household income for the City of Millbrae from the 2010 Census is not currently available.
2
A Permittee’s jurisdictional area is defined as the urban land area within a Permittee’s boundary that is not subject to stormwater NPDES
Permit requirements for traditional and non-traditional small MS4s (i.e. Phase II MS4s) or the California Department of Transportation, or
owned and maintained by the State of California, the U.S. federal government or other municipal agency or special district (e.g., flood control
district).
8Long-Term Trash Load Reduction Plan
transitional areas where food/drinks are not permitted (e.g. bus stops), and from public or private
special events with high volumes of people. Trash from vehicles occurs due to littering from
automobiles and uncovered loads. Inadequate waste container management includes sources such
as overflowing or uncovered containers and dumpsters as well as the dispersion of household and
business-related trash and recycling materials before, during, and after collection. On-land illegal
dumping of trash is the final source category.
Trash is transported to receiving waters through three main pathways: 1) Stormwater
Conveyances; 2) Wind; and, 3) Direct Dumping. Stormwater or urban runoff conveyance systems
(e.g., MS4s) consist of curbs/gutters, and pipes and channels that discharge to urban creeks and the
San Francisco Bay shorelines. Wind can also blow trash directly into creeks or the Bay. Lastly, trash
in receiving waters can also originate from direct dumping into urban creeks and shorelines.
This Long-term Plan and associated trash control measures described in Section 3.0 are focused on
reducing trash from one of the transport pathways illustrated in Figure 3– stormwater
conveyances. Specifically, the Long-term Plan is focused on reducing the impacts of discharges
from MS4s to San Francisco Area receiving waters and the protection of associated beneficial uses.
Source Pedestrian Inadequate On-land Litter from
Litter Waste Container Dumping Vehicles
Categories
Management
Transport Stormwater
Pathways
Wind Direct Dumping
Conveyances
Receiving
Waters
Urban Creeks and the San Francisco Bay Estuary
Figure 3. Trash sources categories and transport pathways to urban creeks.
The City of Millbrae clears all of the creek beds within the Millbrae city limits of trash, debris and
overgrowth biannually and during inclement weather events. The work is completed by city staff
and usually is completed within one working day per cleaning event, per creek bed. The total creek
bed length cleaned is approximately 1.5 miles and approximately 10 gallons (total) of non-
compacted trash is gathered from each biannual occurrence.
9City of Millbrae
2.3 Trash Generating Areas
2.3.1 Generation Categories and Designation of Areas
The process and methods used to identify the level of trash generation within the City of Millbrae
are described in this section and illustrated in Figure 4.
Figure 4. Trash sources categories and transport pathways to urban creeks.
As a first step, trash generation rates developed through the BASMAA Trash Generation Rates
Project were applied to parcels within the City of Millbrae based on current land uses and 2010
household median incomes. A Draft Trash Generation Map was created as a result of this
application. The draft map served as a starting point for the City of Millbrae to identify trash
generating levels. Levels of trash generation are depicted on the map using four trash generation
rate (gallons/acre/year) categories that are symbolized by four different colors illustrated in Table
3.
Table 3. Trash generation categories and associated generation rates (gallons/acre/year).
Category Very High High Moderate Low
Generation Rate
> 50 10-50 5-10Long-Term Trash Load Reduction Plan
could potentially contribute trash to the MS4. Based on the level of trash observed,
each segment (i.e., assessment area) was placed into one of four on-land assessment
condition categories that are summarized in Table 4. Using the Draft Protocol the City
assessed a total of 6 areas to assist in conducting/refining trash generating area
designations. Photos were taken at these locations and On-Land Visual Assessment
Forms were utilized, and are retained by city staff, to provide proof of these low
generation assessments.
Table 4. Definitions of on-land trash assessment condition categories.
On-land Assessment
Summary Definition
Condition Category
A
Effectively no trash is observed in the assessment area.
(Low)
B Predominantly free of trash except for a few pieces that are easily
(Moderate) observed.
C Trash is widely/evenly distributed and/or small accumulations are
(High) visible on the street, sidewalks, or inlets.
D Trash is continuously seen throughout the assessment area, with
large piles and a strong impression of lack of concern for litter in the
(Very High) area.
b. Querying Municipal Staff or Members of the Public
The City of Millbrae used a preliminary map of the city depicting trash generation
rates, based on land usage and median income, to survey the trash loads associated
with various areas of the city. Long-time, highly knowledgeable City staff used
institutional knowledge and ground-truthing methods to verify or disprove the initial
rates depicted by the preliminary map. Six (6) areas that were delineated as being
medium or high trash generating areas were proved, in fact, to be low trash
generating areas after field verifications were performed based upon the
recommendations made by our most informed and experienced field staff.
3. Based on assessments conducted to confirm/refine trash generation category designations,
the City created a final trash generation map that depicts the most current understanding of
trash generation within the City of Millbrae. The City documented this process by tracking
the information collected through the assessments and subsequent refinements to the Draft
Trash Generation Map. The City of Millbrae’s Final Trash Generation Map is included as
Figure 5.
2.3.2 Summary of Trash Generating Areas and Sources
Summary statistics for land use and trash generation categories generated through the mapping
and assessment process are presented in Table 5.
11City of Millbrae
Table 5. Percentage of jurisdictional area within the City of Millbrae assigned to each trash generation
category.
Trash Commercial
Jurisdictional K-12 Urban
Generation and Industrial Residential Retail Other
Area (Acres) Schools Parks
Category Services
Very High 0.0 0.0% 0.0% 0.0% 0.0% 0.0% 0.0% 0.0%
High 78.7 0.0% 0.0% 0.0% 100.0% 0.0% 0.0% 0.0%
Medium 368.6 27.0% 5.6% 26.8% 1.3% 25.4% 14.0% 0.0%
Low 1,512.1 0.0% 0.0% 82.0% 0.1% 0.0% 0.0% 17.8%
12Long-Term Trash Load Reduction Plan
Figure 5. Final Trash Generation Map for the City of Millbrae
13City of Millbrae
Page Intentionally Left Blank
14Long-Term Trash Load Reduction Plan
3.0 TRASH MANAGEMENT AREAS AND CONTROL MEASURES
This section describes the control measures that the City of Millbrae has or plans to implement to
solve trash problems and achieve a target of 100% (i.e. full) trash reduction from their MS4 by July
1, 2022. The selection of control measures described in this section is based on the City of Millbrae’s
current understanding of trash problems within its jurisdiction and the effectiveness of control
measures designed to reduce trash impacts associated with MS4 discharges. Information on the
effectiveness of some trash control measures is currently lacking and therefore in the absence of
this information, the City based its selection of control measures on existing effectiveness
information, their experience in implementing trash controls and knowledge of trash problems, and
costs of implementation. As knowledge is gained through the implementation of these control
measures, the City may choose to refine their trash control strategy described in this section. If
significant revisions or amendments are made, a revised Long-Term Plan will be submitted to the
Water Board through the City of Millbrae’s annual reporting process.
3.1 Management Area Delineation and Prioritization
Consistent with the long-term plan framework, the City of Millbrae delineated and prioritized trash
management areas (TMAs) based on the geographical distribution of trash generating areas, types
of trash sources, and current or planned control measure locations. TMAs are intended to form the
management units by which trash control measure implementation can be tracked and assessed for
progress towards trash reduction targets. Once delineated, TMAs were also prioritized for control
measure implementation. The City of Millbrae’s primary management areas were selected based on
the spatial distribution of trash generating areas and the location of specific existing or planned
management actions within City’s jurisdiction. City staff used the following procedure to designate
TMAs:
City of Millbrae staff delineated 6 Trash Management Areas based on a combination of land usage,
boundaries created by topography, and trash generation rates. The most high traffic areas, which
are the areas most immediately surrounding El Camino Real (CA State Highway 82) were divided
into 3 areas based on divisions created by roads and thoroughfares. This resulted in 2 areas on the
West side of El Camino (divided into a Northern section and a Southern section) and 1 area
bordering El Camino to the East. Another TMA was created to encompass all of the medium and
high trash generating areas that exist off of Millbrae Avenue and its cross streets that are situated
East of El Camino Real and West of the San Francisco Bay. Parks, schools and churches were
compiled into a single TMA based on similar land usage and trash generation rates, while the
remaining area, consisting of all “Low Trash Generating” areas, was compiled into a final group.
Staff has prioritized the five (5) trash generation areas that contain medium and high generation
rates based upon factors that include trash generation rate, land usage, public presence, trash
sources and applicable control measures that could be utilized in each respective area. We deemed
that areas that were considered to be high trash generating areas would take precedence over
those with lower rates and that areas that were high-traffic with a large public presence would take
precedence over lower traffic areas. This was decided based on the need to quickly enact control
measures in higher generation and higher usage areas to avoid any further negative effects of trash
accumulation and to begin what we assume will be a more intensive effort to remediate higher
trash levels. Furthermore, applicable trash control measures were taken into account in order to
determine the prioritization as the timeliness of those actions planned for specific areas will affect
15City of Millbrae
the timeline for implementation. For instance, installing trash capture devices will require
budgetary actions and coordination with outside contractors and will, therefore, take more time to
accomplish than in-house measures, such as on-land trash clean-ups, which can be implemented
relatively quickly.
A map depicting the City’s TMAs is included as
Figure 6. All jurisdictional areas within the city are included within a TMA. The amount of
jurisdictional land area and associated trash condition categories for each TMA are included in
Table 6.
16Long-Term Trash Load Reduction Plan
Table 6. Jurisdictional area and percentage of each Trash Management Area (TMA) comprised of trash
generation categories
Trash Generation Rate
TMA Jurisdictional Area (Acres)
Very High High Medium Low
1 77.5 0.0% 56.6% 42.7% 0.6%
2 89.6 0.0% 15.6% 84.0% 0.4%
3 104.1 0.0% 18.8% 74.4% 6.8%
4 141.7 0.0% 0.0% 100.0% 0.0%
5 44.5 0.0% 2.7% 91.4% 5.9%
6 1,502.0 0.0% 0.0% 0.0% 100.0%
17City of Millbrae
Figure 6. Trash Management Area Map for the City of Millbrae.
18Long-Term Trash Load Reduction Plan
Page Intentionally Left Blank
19City of Millbrae
3.2 Current and Planned Trash Control Measures
The City of Millbrae has taken an aggressive approach to trash reduction and has implemented a variety of trash
control measure to aid in the reduction of overall trash loads throughout the City. We have implemented single-
use carryout bag and polystyrene foam food service ware policies throughout the City in addition to a
comprehensive city-wide street sweeping program that addresses all areas of the City, focusing mainly on high
traffic and high trash generating areas. In addition, we conduct daily on-land trash pick-ups in our “Downtown
area”, biannual on-land clean-ups at our creek sites, annual city-wide trash clean-ups and have recently
implemented quarterly on-land clean-ups in 3 of our 6 Trash Management Areas. Furthermore, through our
trash-bin container management strategy, the City is reducing the amount of litter observed in its commercial
areas by restructuring its trash-bin locations and pick-up frequencies, and reaching out to residences and
businesses with inadequate trash containers to help them obtain the appropriate level of service to handle their
respective trash loads. All of our storm drain inlets are inspected and cleaned at a minimum annual frequency.
The City has also installed full and partial trash-capture devices in 4 of our 6 Trash Management Areas (see
Figure 7- Trash Full Capture Treatment Device map). These devices are inspected and maintained biannually,
with additional inspection and maintenance conducted, as necessary after large storms.
In the future, the City intends to install 3 large trash capture devices at 3 separate outfall locations prior to the
end of 2020. These devices, in conjunction with our on-land and source control efforts, should result in meeting
the trash reduction load reduction goal of “No Visual Impact” by July 1, 2022 deadline.
3.2.1 Trash Management Area #1
Trash Management Area #1 (TMA #1) is our “Downtown area” which spans approximately 76 acres along
Broadway and its side streets and runs parallel along the west side of El Camino Real. This area is largely retail
and commercial land uses with some residential properties existing above and amongst the commercial land
uses. It is the most highly trafficked area of the City and consists of trash generated from retail land uses,
pedestrians and vehicles. On-land clean-ups, daily street sweeping and full-capture trash devices have been
implemented within TMA #1 to address trash that is present due to these sources. The City also maintains a
network of public trash bins within this area. The tendency for public bins to become full and overflow has added
to the presence of trash. Currently, City staff is addressing this source via trash bin reorganization and working
with property owners to ensure adequate trash containers and service levels by each property in the area. The
City of Millbrae also has plans to design and install 2 large full capture devices within this TMA in the next 5
years, and to implement no parking restriction during street sweeping hours to increase street sweeping
effectiveness on Broadway within the next year.
This Trash Management Area has been identified as the first priority for the City of Millbrae due to being the
most highly trafficked area and, subsequently, having the highest density of trash generation and accumulation.
Full-Capture Treatment Devices
Implemented Prior to and Continued After MRP Effective Date:
There are currently 2 hydrodynamic separator units installed at the Friendship Plaza, located at 45 South El
Camino Real in Millbrae. Both units are installed in the parking lot of Friendship Plaza. The drainage basin is
the site of Café Roma/Walgreens’ at 45 South El Camino Real. The two units drain the entire site including
runoff from the roofs of the two buildings. The property owner maintains and cleans the units annually with
inspections provided by the City of Millbrae Building Department.
Implemented after MRP Effective Date and Prior to July 1, 2014:
In August 2012, the City of Millbrae installed 25 United Storm Water connector pipe-screen full-capture
devices (USW-1), covering 14.85 acres of land in the downtown area. These devices are inspected and
maintained at a biannual frequency with additional inspection and maintenance conducted, as necessary after
storms. To date, the City of Millbrae has experienced no failures or other issues with these devices.
20Long-Term Trash Load Reduction Plan
Planned for Future Implementation between July 2014 and July 2022:
The City plans to design and install 2 large full-capture treatment devices that will treat TMA #1 within the
next 5 years. Currently, the proposed location for the first large device is Cowan Canal, which the City shares
maintenance responsibility with the City of Burlingame. The device will serve the drainage area located south
of Millbrae Avenue. The proposed location for the second device is Highline Canal. It will serve a large portion
of the City’s entire drainage area, including TMA #1 between Meadow Glen and Chadbourne, which accounts
for approximately ¾ of TMA #1’s total drainage area.
Street Sweeping
Implemented Prior to and Continued After MRP Effective Date:
The City of Millbrae’s street sweeping schedule within TMA#1 includes daily sweeping of the Downtown area.
Current parking enforcement for sweeping exists along Broadway and surrounding side streets, from
Millbrae Avenue to Taylor Blvd, with “No Parking” signage posted for Monday through Friday, 2:00 am
through 6:00 am. As a result, the sweeper is reaching the curb for the most effective sweeping.
Implemented after MRP Effective Date and Prior to July 1, 2014:
No actions were implemented during this time period as the City was evaluating the effectiveness of sweeping
within this area, and determining if additional actions are necessary to increase the effectiveness of its
sweeping program.
Planned for Future Implementation between July 2014 and July 2022:
Daily street sweeping will continue along Broadway from Taylor Blvd. to Meadow Glen. Prior to the end of FY
2013-2014, the City plans to install additional parking enforcement signs requiring mandatory car removal
along all of Broadway.
On-Land Clean-ups
Implemented Prior to and Continued After MRP Effective Date:
The City of Millbrae’s Parks Department performs on-land clean-ups within TMA#1 along Broadway and its
surrounding side streets, 6 days a week. City staff removes pedestrian litter, litter thrown from vehicles, and
trash that is the result of customers patronizing local retail locations. City staff retrieves an average of 10
gallons of uncompacted trash each day, which is mainly comprised of coffee cups, newspapers, and cigarette
butts.
Since 2002, the City of Millbrae has also held an annual Coastal Cleanup event that covers 15 to 20 areas,
including the entire area delineated as TMA#1 along Broadway and its side streets from Murchison Drive to
Meadow Glen Avenue. On September 21, 2013, despite heavy rain, the event included 100 community
volunteers and 3 City staff members. Because the amount of trash collected is quantified cumulatively,
specific numbers for TMA#1 are not available.
Implemented after MRP Effective Date and Prior to July 1, 2014:
Beginning in 2012, the City of Millbrae began an annual citywide Earth/Arbor day trash clean-up effort that
addresses 12 sites throughout the City, including the entire area delineated as TMA#1 along Broadway and its
side streets from Murchison Drive to Meadow Glen Avenue. This year, the clean-up took place on April 27,
2013 and included 125 community volunteers and 5 City staff members. Because the amount of trash
collected is quantified cumulatively, specific numbers for TMA#1 are not available. These cleanups are
intended to continue into the foreseeable future with no plans to cease or reduce the current level of effort.
Planned for Future Implementation between July 2014 and July 2022:
The City of Millbrae has no additional on-land cleanups planned for TMA #1 since current on-land cleanup
efforts have been determined to be adequate in addressing trash load reduction within this TMA.
21City of Millbrae
Partial-Capture Treatment Devices
Implemented Prior to and Continued After MRP Effective Date:
The City of Millbrae did not install any partial-capture devices during this time period since the availability of,
and necessity for, such devices was not yet known to City staff.
Implemented after MRP Effective Date and Prior to July 1, 2014:
In August 2012, the City installed 15 United Stormwater Clean Screen III Partial-Capture devices (USW-2) in
TMA #1 with funding provided through the San Francisco Bay-area Wide Trash Capture Demonstration
Project administered by San Francisco Estuary Partnership (SFEP). Devices are currently maintained at a
frequency of two times per year with additional with additional inspection and maintenance conducted, as
necessary after storms. To date, the City has not experienced any issues or problems with these devices.
Planned for Future Implementation between July 2014 and July 2022:
The City of Millbrae has no plans for future installation of partial-capture devices within TMA #1. The City
feels that full-capture devices and other trash control measures are a more effective use of resources in
addressing trash load reduction within TMA #1.
Improved Trash Bin/Container Management
Implemented Prior to and Continued After MRP Effective Date:
City of Millbrae staff was not aware of any problems with the existing system of trash bins within TMA #1
during this time period. The trash bins and locations were seemingly adequate until a recent assessment
performed by City staff revealed some issues.
Implemented after MRP Effective Date and Prior to July 1, 2014:
In an effort to eliminate overflowing public trash bins and to reduce litter within the Downtown area, the City
revised the collection schedule to increase the collection frequency for identified public trash bins and
decrease collection for trash bins in other areas that do not need as much service. In addition, tenants
identified as not having trash service within the Downtown area were contacted and informed to start
service. Additional outreach is planned for tenants in the downtown area to encourage them to recycle and
use trash bins allocated for their apartments and to not use the public trash bins.
On a regular basis, City staff contacts businesses and residents identified as using public trash bins within the
Downtown and other areas to determine if they have trash service. If they do not have trash service, both are
asked to sign-up for service, and instructed not to use public trash bins.
In addition, the City of Millbrae has implemented the following additional measures relating to improved
trash bin management within TMA #1:
• Installed a large solar-operated trash compacting container next to a coffee shop where the public
trash bin was continually overflowing with paper cups. As a related measure, the City distributed
reusable travel mugs to reduce the use of single-use paper cups. Over 500 reusable travel mugs were
distributed in 2013. By early 2014, a total of 1,000 travel mugs will have been distributed.
• To reduce the amount of paper placed in a public trash bin at the Millbrae Post Office, City staff
worked with the Post Office to place an additional recycling container inside for the collection of
unwanted mail/mixed paper. Outreach is also being done to identify companies who distribute
bundles of newspapers in front of stores to reduce the potential for the newspapers to end up as
litter.
Planned for Future Implementation between July 2014 and July 2022:
To eliminate accumulating trash observed within the surrounding area, the City is planning to install a trash
enclosure within a parking lot behind a busy section of Broadway to accommodate waste from two
restaurants and other businesses. In addition, the City is planning to install a solar trash compactor unit at the
Millbrae Library in FY 2014-2015 to address trash accumulation around trash bins provided at the library.
22Long-Term Trash Load Reduction Plan
The City is currently researching various cigarette butt disposal containers and trash can lids with built-in
ashtrays to help remedy the presence of cigarette butt litter in areas where they have the potential of
reaching the storm drainage system. The City plans to pilot-test a set of these devices in FY 2014-2015 to
determine if the desired impact is achieved.
23City of Millbrae
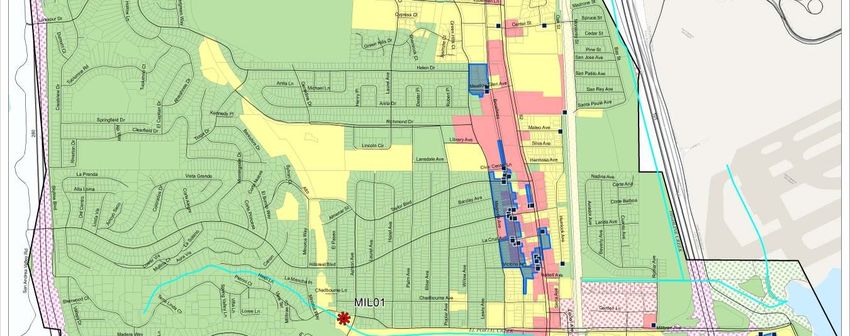
Figure 7. Trash Full Capture Device Map for the City of Millbrae
24Long-Term Trash Load Reduction Plan
Page Intentionally Left Blank
25City of Millbrae
3.2.2 Trash Management Area #2
Trash Management Area #2 (TMA #2) is approximately 84 acres of land bordered by El Camino Real on the
East, Green Hills Golf Course to the West, TMA #1 to the South and the San Bruno border to the North. This area
is mostly residential to the West of Broadway with retail and commercial land uses in the Eastern portion closest
to El Camino Real. The close proximity of TMA #2 to El Camino Real lends itself to litter facilitated by a large
amount of vehicular traffic through the area. On-land clean-ups, street sweeping and partial trash- capture
devices have been implemented within TMA #2 to address trash that is present due to these sources. The City also
maintains a network of public trash bins within this area. The tendency for public bins to become full and
overflow has added to the presence of trash. Currently, City staff is addressing this source via trash bin
reorganization and working with property owners to ensure adequate trash containers and service levels by
each property in the area. The City of Millbrae also has plans to design and install a large full capture device that
will serve this TMA in the next 5 years. Although this Trash Management Area is itemized as the second priority,
the City of Millbrae is making every effort to address all TMAs immediately, regardless of prioritization.
Full-Capture Treatment Devices
Implemented Prior to and Continued After MRP Effective Date:
The City of Millbrae did not install any full-capture devices during this time period since the availability of,
and necessity for, such devices was not yet known to City staff.
Implemented after MRP Effective Date and Prior to July 1, 2014:
In November 2013, the City installed 2 Full Capture USW-1 Devices in TMA #2 that capture about half of the
drainage associated with this area. The first device was placed at the North West corner of El Camino Real
and Center Street while the second was placed on Broadway, just across from Paramount Drive. These
devices are indicated on the Millbrae Full Capture Map included above. Due to the timing of their installation,
the associated drainage areas were not able to be depicted on this map.
Planned for Future Implementation between July 2014 and July 2022:
The City plans to design and install a large full-capture device that will serve the drainage area encompassed
by TMA #2. Currently, the proposed location of this device is the concrete drainage channel located behind
1136 Landing Lane. This device will treat the area between Jasmine and Cypress Courts to the South and
Millwood & Capuchino Drives to the North. This area accounts for approximately 1/3 of TMA #2.
Street Sweeping
Implemented Prior to and Continued After MRP Effective Date:
The streets closest to El Camino Real, which include retail and commercial land uses are swept 5 days a week.
The primarily residential areas to the West are swept twice a month. There is no parking enforcement in this
area. Therefore, the sweeper can only get to the curb where cars are not present.
Implemented after MRP Effective Date and Prior to July 1, 2014:
No actions were implemented during this time period as the City was evaluating the effectiveness of sweeping
within this area, and determining if additional actions are necessary to increase the effectiveness of its
sweeping program.
Planned for Future Implementation between July 2014 and July 2022:
The City does not have any future plans to implement additional sweeping within this area. The City feels that
current sweeping efforts coupled with additional trash control measures implemented within TMA #2 are
adequate in addressing trash load reduction within this TMA.
26You can also read