Machine Learning Enabled Wi-Fi Saturation Sensing for Fair Coexistence in Unlicensed Spectrum
←
→
Page content transcription
If your browser does not render page correctly, please read the page content below

Received February 16, 2021, accepted March 10, 2021, date of publication March 15, 2021, date of current version March 23, 2021.
Digital Object Identifier 10.1109/ACCESS.2021.3066052

Machine Learning Enabled Wi-Fi Saturation
Sensing for Fair Coexistence
in Unlicensed Spectrum
MERKEBU GIRMAY , ADNAN SHAHID , (Senior Member, IEEE), VASILIS MAGLOGIANNIS ,
DRIES NAUDTS , AND INGRID MOERMAN , (Member, IEEE)
IDLab, Department of Information Technology (INTEC), Ghent University–imec, 9052 Ghent, Belgium
Corresponding author: Merkebu Girmay (merkebutekaw.girmay@ugent.be)
This work was supported in part by the European H2020 Programs under Grant 952189 (5G-BLUEPRINT project) and Grant 101016499
(DEDICAT6G project), and in part by the CEF Program under Grant INEA/CEF/TRAN/M2016/1364071 (CONCORDA project).

  ABSTRACT In the past few years, machine learning (ML) techniques have been extensively applied
  to provide efficient solutions to complex wireless network problems. As such, Convolutional Neural
  Network (CNN) and Q-learning based ML techniques are most popular to achieve harmonized coexistence
  of Wi-Fi with other co-located technologies such as LTE. In the existing coexistence schemes, a co-
  located technology selects its transmission time based on the level of Wi-Fi traffic generated in its collision
  domain which is determined by either sniffing the Wi-Fi packets or using a central coordinator that can
  communicate with the co-located networks to exchange their status and requirements through a collaboration
  protocol. However, such approaches for sensing traffic status increase cost, complexity, traffic overhead,
  and reaction time of the coexistence schemes. As a solution to this problem, this work applies a ML-based
  approach that is capable to determine the saturation status of a Wi-Fi network based on real-time and over-
  the-air collection of medium occupation statistics about the Wi-Fi frames without the need for decoding.
  In particular, inter-frame spacing statistics of Wi-Fi frames are used to develop a CNN model that can
  determine Wi-Fi network saturation. The results demonstrate that the proposed ML-based approach can
  accurately classify whether a Wi-Fi network is saturated or not.

  INDEX TERMS Wi-Fi saturation, traffic load estimation, coexistence, unlicensed spectrum, machine
  learning, convolutional neural networks.

I. INTRODUCTION                                                                                   Similarly, the popularity of smart mobile devices and their
Recently, modern industry is extending the deployment of                                       bandwidth hungry applications result in an explosive increase
wireless networks looking into efficient networking solutions                                  of mobile traffic demands on cellular networks which has
that can increase network performance. This expansion of                                       led to scarcity of licensed spectrum. On the other hand,
wireless network deployments in industry along with the                                        the unlicensed band has a wide range of spectrum resources
rapidly growing penetration of wireless network consumer                                       and are therefore proposed by 3GPP for opportunistic offload
devices like smartphones and tablets have led to an expo-                                      of mobile networks [3].
nential growth of wireless traffic demand. The Internet-of-                                       The two unlicensed bands that are widely used today are
Things (IoT) that will connect an unprecedented number                                         the 2.4 GHz and 5 GHz bands. The 2.4 GHz band, with
of intelligent devices to next-generation mobile networks                                      only 80 MHz spectrum, is heavily used in most regions
also uses a significant portion of the wireless spectrum [1].                                  of the world. Due to the relatively favorable propagation
In 2020, IoT Analytics estimated that 9.5 billion devices are                                  characteristics, 2.4 GHz is already occupied by many tech-
connected to the Internet and forecasts a growth of 28 billion                                 nologies like IEEE 802.15.4, Bluetooth, and Bluetooth Low
devices by 2025 [2].                                                                           Energy technologies that do not use the 5 GHz. In contrast,
                                                                                               the 5GHz band has a wider bandwidth i.e., up to 500MHz.
   The associate editor coordinating the review of this manuscript and                         Due to its wide spectral band, 5GHz band is more appeal-
approving it for publication was Adnan Kavak             .                                     ing for wireless technologies that share the same spectrum

                     This work is licensed under a Creative Commons Attribution 4.0 License. For more information, see https://creativecommons.org/licenses/by/4.0/
VOLUME 9, 2021                                                                                                                                                        42959
M. Girmay et al.: Machine Learning Enabled Wi-Fi Saturation Sensing for Fair Coexistence in Unlicensed Spectrum

with different coexistence techniques. For the same rea-                 multiple technologies operating in the 5.9 GHz Intelligent
sons, the future wireless networks also propose to use the               Transport Systems (ITS) band (more specifically between
5 GHz band [4]. In 2020, the Federal Communications                      5.85 and 5.925 GHz). ITS-G5 and Direct Short Range Com-
Commission has also adopted a new regulation that makes                  munications (DSRC) are the 802.11p standards for Vehi-
1,200 MHz of spectrum in the 6 GHz band (5.925–                          cle to Vehicle (V2V) communications in Europe and USA
7.125 GHz) available for an unlicensed use [5]. The next                 respectively [11]. On the other hand, the 5G Automotive
generations of Wi-Fi and other emerging technologies such                Association (5GAA) has been actively developing a cel-
as 5G NR-U are expected to coexist in this band.                         lular infrastructure for vehicular communication known as
   Despite the enhanced capacity, the implementation of                  Cellular Vehicle to Everything Communication (C-V2X).
many wireless technologies in the unlicensed bands raises                C-V2X has low latency and high reliability, which makes it a
serious concerns about the coexistence of co-located net-                good candidate for enabling delay sensitive and safety critical
works operating in the same band. One of the well-established            vehicular communications [12].
technologies that operate in the unlicensed spectrum is Wi-Fi               No matter which unlicensed spectral band, when multi-
(also known as 802.11). 802.11g/b/ax/n are the Wi-Fi stan-               ple technologies aim to use the 5 GHz unlicensed band,
dards that use the 2.4 GHz band, while the 5 GHz Wi-Fi band              the shared spectrum should be used in a fair and efficient
(802.11a/n/ac/ax) is also widely deployed across the world.              way and further respect the (regional) spectrum regulations in
Wi-Fi utilizes the carrier sense multiple access with collision          this band. In this study, we focus on the coexistence of Wi-Fi
avoidance (CSMA/CA) protocol to coexist with various other               and other technologies in 5 GHz band, but same solutions
wireless technologies in the unlicensed spectrum [6].                    could be applied to other bands too. While Wi-Fi technologies
   Other common technology that uses the unlicensed spec-                are designed to coexist in the unlicensed bands (by using
trum is LTE. In legacy LTE network, a centralized scheduling             clear channel assessment and back-off mechanisms), cellular
mechanism is used wherein the eNodeB (eNB) decides the                   technologies are not. For instance, LTE is used in the unli-
time and frequency at which each User Equipment (UE) in                  censed band for offloading non-critical traffic by using the
the network transmits or receives. LTE Unlicensed (LTE-U)                similar setting used by Wi-Fi for high priority traffic and this
is the first standardized technology to use the 5 GHz unli-              degrades the performance of Wi-Fi [13]. Many coexistence
censed band. LTE-U is standardized by LTE-U Forum and it                 schemes have been proposed to achieve fair and efficient
uses the 5 GHz unlicensed band for opportunistic offloading              spectrum sharing between Wi-Fi and other co-located tech-
of mobile network traffic. Another LTE standard that uses                nologies in the unlicensed band. In these existing coexistence
the 5 GHz unlicensed spectrum is LTE Licensed Assisted                   schemes, a co-located technology first estimates the traffic
Access (LAA). LAA is the standard version of the unlicensed              load of Wi-Fi network either by decoding the Wi-Fi packets
LTE developed by 3GPP [7]. LTE-U and LTE-LAA use                         or by using a central coordinator that can communicate with
different access mechanisms to coexist with other co-located             the co-located networks. However, both schemes lead to an
technologies. LTE-U uses Carrier Sense Adaptive Trans-                   increase in cost, complexity, traffic overhead, and latency for
mission (CSAT) for selecting ’ON’ and ’OFF’ duty cycles                  operating the networks. For instance, LTE-U extracts Wi-Fi
according to Wi-Fi transmission occupancy whereas LAA                    transmission occupancy by decoding Wi-Fi packets and then
uses the Listen Before Transmit (LBT) technique (similar to              selects the ‘‘ON’’ and ‘‘OFF’’ time of the LTE-U duty
Wi-Fi) [8]. Private LTE technology solutions such as Multe-              cycle [14].
Fire technology are also other technologies that are mostly                 The power of deep learning methods to extract important
implemented in the unlicensed spectrum [9].                              features in classification problems such as image classifica-
   5G New Radio in the Unlicensed band (5G NR-U) is                      tion and natural language processing indicate that Machine
an emerging wireless technology implemented in the unli-                 Learning (ML)-based solutions can be used to classify
censed spectrum. 5G NR-U has the capability to offer                     saturated and unsaturated Wi-Fi networks. In this article,
the necessary technology for cellular operators to integrate             we present an ML-based solution using Convolutional Neural
the unlicensed spectrum into 5G networks. In 5G NR-U,                    Networks (CNNs) that identifies the saturation of a Wi-Fi
unlicensed spectrum is used for full duplex uplink and                   network based on statistics of Wi-Fi frames. ns-3 simulator is
downlink transmissions. 5G NR-U supports 5G advanced                     used to model the saturated and unsaturated Wi-Fi networks
features of ultra-high-speed, high bandwidth, low latency,               examined in this study. A Wi-fi network is distinguished as
and improved reliability of wireless communications. For                 saturated network if its aggregated throughput has reached
this reason, massive-scale and highly-diverse future industrial          the maximum system throughput limit [15]. Otherwise, the
networks are showing interest towards the implementation                 Wi-Fi network is classified as unsaturated Wi-Fi net-
of 5G NR-U [10]. Despite the high expectations in terms of               work. Once the Wi-Fi network reached its saturation point,
performance claimed for 5G NR-U, its coexistence with other              the throughput cannot increase as the offered load increases.
wireless networks in the unlicensed spectrum still needs to be           More details on the saturated and unsaturated Wi-Fi networks
proven, when commercial deployments become available.                    can be found in Section III. The statistics used to develop
   Vehicular communication is another wireless communica-                our CNN models include a) histogram of Inter-frame Spacing
tion system that can benefit from harmonious coexistence of              (IFS), b) average duration of IFS and c) collision percentage

42960                                                                                                                                  VOLUME 9, 2021

M. Girmay et al.: Machine Learning Enabled Wi-Fi Saturation Sensing for Fair Coexistence in Unlicensed Spectrum

of frames. From these three statistics (features), three                          a) coexistence in LTE and Wi-Fi, b) coexistence in 5G NR-U,
CNN models are developed with different combinations of                           and c) coexistence in C-V2X and 802.11p.
the three features. The main goal of the CNN models is to
distinguish between saturated and unsaturated Wi-Fi traffic.                      A. COEXISTENCE IN LTE AND WI-FI
Note that later on in the paper, we will use the terms ‘statis-                   Recently, extensive research has been conducted on the coex-
tics’ and ‘features’ interchangeably. The proposed CNN mod-                       istence of Wi-Fi and other networks which are expected
els can be implemented with the help of technology recog-                         to operate concurrently in unlicensed spectrum bands,
nition module proposed in our previous work in [16] which                         in particular on fair coexistence of LTE and Wi-Fi. In [17],
is capable of identifying Wi-Fi traffic statistics in real-time.                  a contention window (CW) size adaptation algorithm-based
Hence, the proposed solution enhances the implementation                          channel access scheme is proposed to achieve fair coexistence
of simple and real-time sensing of Wi-Fi network saturation.                      of LTE and Wi-Fi. Similarly, authors in [18], [19] propose
Once the saturation traffic status of Wi-Fi is determined                         a mechanism to adaptively adjust the back-off window size
based on the ML model, coexistence schemes can use it to                          and LTE duty-cycle time fraction based on traffic status
make appropriate decisions on channel occupation. The key                         of a co-located Wi-Fi and the available licensed spectrum
contributions of this work include:                                               resource of the LTE-U while guaranteeing a fair coexistence
   •   Modelling and analysis of Wi-Fi network traffic charac-                    between the technologies. Authors in [20] modelled allow-
       teristics in terms of IFS histogram, average IFS duration                  able LTE transmission time selection which is determined
       and frame collision percentage.                                            by considering different targets of Wi-Fi service protection.
   •   Design of three CNN models with different input fea-                       In this work, the LTE transmission time is optimized for
       tures that can effectively classify saturated and unsatu-                  maximizing the overall normalized channel rate contributed
       rated Wi-Fi traffic which enables autonomous selection                     by both LTE and Wi-Fi systems. Almeida et al. [21] propose
       of optimal configuration parameters that offer fair coex-                  a coexistence scheme that uses blank LTE subframes in order
       istence without the need of Wi-Fi packet decoding or any                   to give transmission opportunities to Wi-Fi. The scheme is
       signaling overhead between Wi-Fi and other coexisting                      evaluated via simulations and it is concluded that the number
       technologies.                                                              and the order of the blank subframes have an impact on the
   •   Performance evaluation of the three CNN models with                        provided coexistence. Authors in [22]–[28] propose machine
       different combination of input features in terms of accu-                  learning based autonomous selection of appropriate combina-
       racy, model complexity and difficulty of acquiring those                   tions of parameters that can provide fair coexistence between
       features at run-time.                                                      co-located LTE and Wi-Fi networks. However, the studies
   •   Generalization performance of the three trained                            in [17]–[28] assume the LTE eNB can access the exact traffic
       CNN models on unseen data captured in a grey region                        requirements of the co-located Wi-Fi system. In practice,
       between saturated and unsaturated cases. Information on                    there is no dedicated common control channel between the
       the grey region is given in Section V-A.                                   two systems that can be used to exchange the traffic status.
   •   Open source of the training and the unseen test datasets                   Hence, these proposed coexistence schemes require a system
       so that other researchers can use them and compare the                     architecture modification on the two technologies to intro-
       performance and complexity of their models with our                        duce a new channel for traffic status reporting. Alternatively,
       best model.                                                                the LTE eNB can have extended Wi-Fi receiver features
                                                                                  that decode the transmitted Wi-Fi packets. These additional
   The remainder of this paper is organized as follows.                           system requirements make the implementation of the coexis-
Section II reviews some recent related studies on the coex-                       tence schemes challenging.
istence of Wi-Fi and other technologies. Section III and                             In [29] an energy detection based technique is proposed to
Section IV illustrate the problem addressed in this article and                   reliably distinguish between one and two Wi-Fi Access Points
the proposed solution respectively. The description of the sys-                   (APs). In this work, the feasibility of the proposed energy
tem model used in this work is presented in Section V. This                       detector based system is analyzed and experimentally verified
section explains the neural network model used to determine                       by selecting appropriate detection thresholds using compre-
the saturation of a Wi-Fi traffic, whereas Section VI explains                    hensive measurements in realistic environments. Similarly,
the results obtained in different traffic scenarios and provides                  the study in [30] presents an algorithm that can distinguish
a detailed performance evaluation of the proposed model.                          between one and two Wi-Fi APs by using an auto-correlation
Finally, Section VII concludes the article and discusses plans                    function on the Wi-Fi preamble and setting appropriate detec-
for future work.                                                                  tion thresholds to infer the number of operating Wi-Fi APs.
                                                                                  The authors in [31] propose a ML-based approach to deter-
II. RELATED WORK                                                                  mine multiple Wi-Fi APs which uses the observed energy
In this section, algorithms used in the coexistence of Wi-Fi                      values of the APs. The studies in [29]–[31] propose less
and other technologies and approaches used to estimate                            complex and straightforward approaches to determine the
the Wi-Fi network traffic status in the coexistence schemes                       presence of multiple active APs as compared to decoding
are reviewed. We divide the related work into three parts:                        the entire Wi-Fi packet, which would require a full Wi-Fi

VOLUME 9, 2021                                                                                                                             42961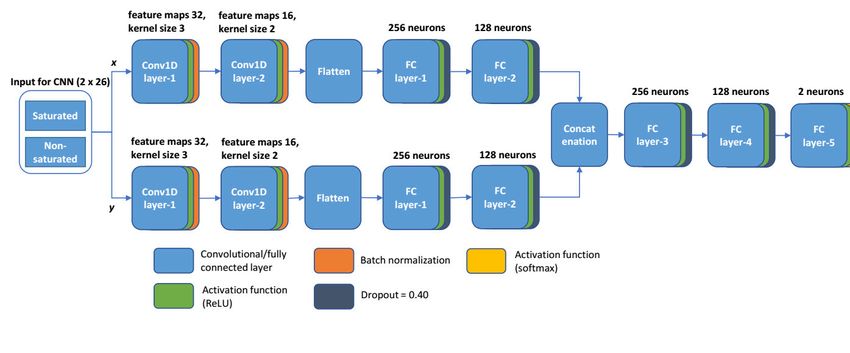
M. Girmay et al.: Machine Learning Enabled Wi-Fi Saturation Sensing for Fair Coexistence in Unlicensed Spectrum

receiver at the LTE eNB. However, each active Wi-Fi AP                   applicable regulatory requirements for operation in
can have different traffic loads and determining the number              unlicensed band, such as limits on transmit power, spectral
of active APs is not an appropriate measure to estimate the              density, and channel occupancy. Furthermore, the NR-U
real status of co-located Wi-Fi networks. To achieve an effi-            system must also achieve fair coexistence with other nodes
cient coexistence between Wi-Fi and other technologies, the              of either the same or a different technology [10]. In [43]
co-located technologies must be able to estimate the traffic             a system-level simulator that models the NR-U and IEEE
load status of the Wi-Fi network.                                        802.11 technologies coexistence is presented. The proposed
   In [32], [33], CNN based models are used to perform                   NR-U model targets to model NR-U network in the currently
identification of Wi-Fi transmissions from other co-located              available unlicensed spectrum bands while meeting its regu-
transmissions of other technologies. In our previous work a              latory requirements. In [44], an overview of standardization
similar CNN model has been trained by capturing in-phase                 efforts in coexistence of NR-U and Wi-Fi is presented. The
and quadrature-phase (IQ) samples of LTE and Wi-Fi trans-                authors also discuss the implementation challenges on the
missions [16]. The model is validated using commercial off-              coexistence of NR-U and Wi-Fi. Furthermore, the authors
the-shelf LTE and Wi-Fi hardware equipment and it can                    suggest that the lessons learned from 5 GHz LTE and Wi-Fi
identify the duration of each transmitted frame from each                coexistence should be used as a basis for the development
technology and the duration of idle slots. In this work,                 of new standards for 6 GHz. Thus, the studies proposed
the idle time slots are used to compute the channel occupancy            in the coexistence of LTE and Wi-Fi in [22]–[28] can be
time (COT) percentage of Wi-Fi traffic which implicitly indi-            extended towards the coexistence of NR-U and Wi-Fi. Hence,
cates the traffic demand of Wi-Fi. This COT is used to make              determining the traffic status of Wi-Fi without any need of a
adaptive selection of the transmission opportunity (TxOP)                dedicated channel for signaling exchange can play a great role
of a co-located LTE. In [34], [35], the CNN based traffic                in enhancing the coexistence of NR-U and Wi-Fi.
classification proposed in [16] is also used to implement
coexistence schemes between private LTE and Wi-Fi. In an                  C. COEXISTENCE IN C-V2X AND 802.11p
unsaturated Wi-Fi network, the COT can be a good indicator               The debate for implementation of C-V2X or 802.11p is
of the Wi-Fi traffic demand. However, the COT cannot be                  still ongoing. Both technologies are claiming the rights to
used to distinguish saturated and unsaturated Wi-Fi traffic and          operate in the 5.9 GHz band which is reserved for ITS
this makes the use of COT challenging when the Wi-Fi traffic             operations [3]. If both technologies are deployed in the future,
is saturated (see Table 3 in Section III for details).                   C-V2X will have to operate and possibly coexist with incum-
   Authors in [36] propose a Q-learning based approach                   bent 802.11p as well as possibly with regular Wi-Fi users
to estimate the traffic characteristics of Wi-Fi. The pro-               of other 802.11 modes. This coexistence problem, which is
posed approach provides a decision-making framework that                 very similar to LTE and Wi-Fi coexistence in an unlicensed
employs carrier sensing at the LTE eNB to identify the idle              band, deserves further attention. IEEE 802.11p uses a random
time of the Wi-Fi. This work mainly aims to maximizing                   access MAC whereas C-V2X, based on LTE, employs a
unlicensed LTE utilization of the idle spectral resources.               centralized MAC scheduling approach (C-V2X mode 3) or
J. Tan et al. [37] proposed a Deep Reinforcement Learn-                  a distributed semi-persistent scheduling approach (C-V2X
ing (DRL) based technique to estimate the traffic demand                 mode 4) [12]. Thus, studies on unlicensed LTE and Wi-Fi
of Wi-Fi. In this work, DRL is used to enable the LAA LTE                coexistence [17], [20]–[37] can be adopted for this coexis-
system to learn and predict the future Wi-Fi traffic demands             tence problem too. On the other hand, the coexistence of
by continuously observing the average number of total idle               DSRC, 801.11p and other 802.11 technologies have attracted
slots, average number of successful transmitted Wi-Fi pack-              some research attention [45]–[48].
ets, and average number of collisions, which can reflect the
Wi-Fi traffic demands implicitly. This work entirely consid-              D. ENHANCEMENTS
ers unsaturated Wi-Fi traffic. However, the parameters such              We have observed that many researchers propose different
as number of successful transmitted Wi-Fi packets which are              coexistence schemes to achieve fair and efficient coexistence
observed in the DRL based Wi-Fi traffic estimation have                  of Wi-Fi and other technologies. In previous works many
different characteristics in saturated and unsaturated Wi-Fi             efforts have been done to estimate the load in a Wi-Fi net-
traffic [15].                                                            work. These studies assume that there is a signaling protocol
                                                                         which is available between co-located networks to inform the
B. COEXISTENCE IN 5G NR-U                                                networks about the current load, or they can decode Wi-Fi
In [38]–[42] the use of unlicensed bands within a single                 traffic, or they try to estimate the load in a Wi-Fi network.
radio access system named 5G over unlicensed spectrum                    Very often load estimation is based on wrong assumptions
is introduced. These studies emphasize on the performance                (e.g. number of active APs, or COT), and, to the best of our
of 5G in supporting stringent Internet of Things (IoT) use               knowledge none of previous studies take into account the
cases and discuss and compare the alternative strategies for             saturation behavior of Wi-Fi. This paper proposes a coexis-
spectrum management in unlicensed spectrum for 5G appli-                 tence, that (i) does not require any signaling protocol, (ii) does
cations. However, a NR-U network system must adhere to any               not require to decode Wi-Fi traffic, and (iii) is capable to

42962                                                                                                                                  VOLUME 9, 2021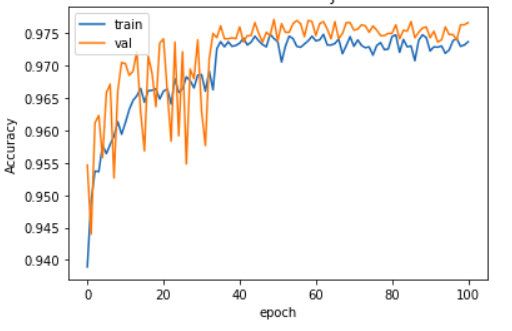
M. Girmay et al.: Machine Learning Enabled Wi-Fi Saturation Sensing for Fair Coexistence in Unlicensed Spectrum

discriminate between saturated and unsaturated Wi-Fi net-                         can more easily control the traffic load to investigate saturated
work behavior, which will lead to much better decisions to                        and unsaturated scenarios than in real-life experiments. This
control coexistence.                                                              makes it convenient to make several experiments and collect
                                                                                  sufficient dataset. The Wi-Fi network modelled in this work
III. PROBLEM DEFINITION                                                           is composed of one AP and a variable number of actively
The limitation of the licensed spectrum and its high                              transmitting stations which have different traffic loads. The
associated cost has motivated the use of unlicensed bands.                        stations connected to an AP are the Active Nodes (ANs) that
Thus, many wireless systems are emerging in the unlicensed                        generate traffic in the modelled Wi-Fi network. The topology
spectrum. When another wireless network shares the same                           of the modelled Wi-Fi network is shown in Figure 1. We con-
unlicensed band with a legacy Wi-Fi system, the most chal-                        sider 1 AP which is connected to N randomly distributed
lenging issue is to prevent the co-located networks from                          active nodes in a circular area with a radius of 25m range,
severe performance degradation due to interference, while                         ensuring that all ANs are in the same collision domain.
satisfying Quality of Service (QoS) requirements of the indi-
vidual co-located networks and maintaining fair spectrum
access.
   The main problem with existing technologies such as LTE
and C-V2X is that they were not designed to operate in
shared spectrum bands with Wi-Fi. On the other hand, Wi-Fi
is designed for operation in unlicensed bands and to avoid
collision with other co-located wireless networks, in partic-
ular other Wi-Fi networks. Cellular technologies, like LTE
and C-V2X technologies on one hand, and Wi-Fi on the
other hand use different medium access protocols. The MAC
mechanisms are not designed to operate together and will lead
to performance degradation when operated concurrently in
the same band [13].
   In most of the existing spectrum sharing and coexis-
                                                                                  FIGURE 1. Illustration of network topology.
tence techniques, previously proposed solutions assume that
the coexisting wireless systems are perfectly aware of the
Wi-Fi network status (e.g. Wi-Fi traffic demands or the                              Table 1 shows the range of parameters used to model
number of active Wi-Fi users). These previously proposed                          different scenarios of 802.11a network in the ns-3 simula-
solutions assume that all nodes from the co-located technolo-                     tor. Unless specified, the simulations discussed in this paper
gies can exchange the aforementioned information. However,                        use the parameters presented in this table. The Short Inter-
it requires architectural modifications on the existing tech-                     frame Spacing (SIFS) and DCF Interframe Spacing (DIFS)
nologies to establish a dedicated signaling control channel                       considered in the 802.11a network are 16µs and 34µs respec-
between multiple independent systems in order to exchange                         tively, whereas the duration of each slot is 9µs. The consid-
their requirements. A technology that is designed to coexist                      ered Wi-Fi network uses a constant speed propagation delay
with Wi-Fi could also deploy a Wi-Fi receiver to sense the                        model named as ConstantSpeedPropagationDelayModel and
traffic characteristics of co-located Wi-Fi systems. But this                     a propagation loss model based on log normal distribution
also leads to higher implementation complexity.                                   which is named LogDistancePropagationLossModel [49].
   As a solution to the aforementioned challenges, this work                      The active nodes considered in the modeled Wi-Fi network
proposes a solution that can distinguish saturated and unsat-                     generate a User Datagram Protocol (UDP) traffic. The Packet
urated Wi-Fi traffic in real-time by analyzing the histogram                      Arrival Rate (PAR) of the UDP traffic is varied in a wide
distribution of IFS, average duration of IFS and percentage
of collisions. These features can be derived by processing
the statistics obtained from the technology recognition sys-                      TABLE 1. Parameters used to model different Wi-Fi traffic scenarios.

tem proposed in our previous work [16]. The technology
recognition solution also imposes additional capabilities of
the LTE system as it can use the same receiver unit as the
LTE transceiver system for capturing I/Q samples and can
hence be easily integrated in future LTE radios. In this work,
ns-3 simulator is used to model a 802.11a network and the
features are generated from the Wi-Fi frames that access
a channel modelled in the simulator. The ns-3 simulator
is used as it is one of the prominent simulators to model
wireless networks. Furthermore, by using the simulator we

VOLUME 9, 2021                                                                                                                                      42963
M. Girmay et al.: Machine Learning Enabled Wi-Fi Saturation Sensing for Fair Coexistence in Unlicensed Spectrum

range to investigate the traffic characteristics of different load
levels.
   The saturation curve of the 802.11a network is shown
in Figure 2 for different numbers of active nodes which use
minimum contention window (CWmin ) of 15 and maximum
contention window (CWmax ) of 1023 for a 1500 byte packet
size. The graph shows how the cumulative throughput (= sum
of the throughput of all active nodes in the network) varies
as the packet arrival rate at the MAC queue increases. It can
be observed that the maximum cumulative throughput i.e.
the saturation throughput obtained depends on the number of
active nodes contending for the medium.
   As it can be observed in Figure 2(a), the cumulative
throughput remains almost constant after a certain point even
if the number of packets arriving on the MAC queue keeps
increasing. This point is called the saturation point and it is
represented by solid circle points in the graph. Figure 2(b)
shows the number of transmitted, successful and collision
frames in 10 minutes time interval for different numbers
of active nodes. The results presented in this figure were
obtained by setting the cumulative packet arrival rate to
2500 packets/second. The PAR indicates the number of pack-
ets arriving at the MAC queue in every second. Transmitted
frames are all frames that are transmitted on the medium.
Part of the transmitted frames are successful meaning that
those frames can be successfully decoded and acknowledged
by the receiver, while other transmissions cannot be success-              FIGURE 2. (a) Throughput saturation curves for different number of active
fully received due to collisions. Collisions occur when two                nodes (b) Number of transmitted, successful and collided frames in
                                                                           during a time interval of 10 minutes with CWmin =15 and
or more nodes in the same collision domain transmit their                  CWmax =1023 for a 1500 byte packet size.
frames simultaneously. It can be observed that the number
of frame collisions increase with the number of active nodes
                                                                           TABLE 2. Saturation throughput of 2 and 10 active nodes for
competing for the shared medium. The main goal of this work                different CWmin and K configurations.
is to deliver a system that can assess the characteristics of
Wi-Fi traffic by analyzing the medium occupation statistics
to determine whether or not the traffic load has reached this
saturation point.
   Table 2 shows the saturation throughput (the maximum
system throughput) for 2 and 10 active nodes for different
configurations of CWmin and the CWmax . The saturation
throughput of each configuration is determined by increasing
the PAR of the UDP traffic until it reaches the saturation
point. The figure shows that the obtained saturation through-
put depends on the configuration of CWmin and number of                    with 1 active node and 50 active nodes. From Table 3, we can
retransmissions(K). For fewer active nodes, the probability                observe that the COT percentage is not an appropriate metric
of frame collisions is not high even if a low CWmin and fewer              to distinguish saturated and unsaturated traffic, as the same
re-transmissions are used and this leads to a high saturation              COT percentage can be achieved for saturated as well as
throughput. However, for a large number of active nodes this               unsaturated traffic.
configuration leads to a high frame collision probability and                 In order to find out whether a Wi-Fi network is saturated
thereby a low saturation throughput.                                       or not, we also inspected the histogram of IFS distribu-
   For unsaturated Wi-Fi traffic, a coexisting technology can              tion for saturated and unsaturated traffic scenarios as shown
use the COT of the Wi-Fi network to take a decision on the                 in Figure 3. Unfortunately, the histogram plot is not also a
air-time allocated to the Wi-Fi network. Table 3 shows the                 suitable means to discriminate between saturated and unsatu-
COT utilisation obtained in different Wi-Fi traffic scenarios.             rated Wi-Fi networks. This is due to the fact that IFS depends
The packet sizes used in the considered scenarios are 500 byte             on the exponential back-off time used in frame retrans-
and 1500 byte. CWmin was configured to 15 and CWmax was                    missions which on its turn depends on many parameters
set 1023. The COT percentage was computed for scenarios                    such as number of active nodes, PAR, CWmin , and CWmax .

42964                                                                                                                                    VOLUME 9, 2021
M. Girmay et al.: Machine Learning Enabled Wi-Fi Saturation Sensing for Fair Coexistence in Unlicensed Spectrum

TABLE 3. COT in different scenarios.

                                                                                  FIGURE 4. Architecture of proposed solution.

                                                                                  step was executed in which a CNN was trained on the features
                                                                                  to distinguish saturated from unsaturated Wi-Fi traffic. Once
                                                                                  a CNN is trained, then in the last decision step, the traffic
                                                                                  status of Wi-Fi is identified as saturated or unsaturated and the
                                                                                  coexisting wireless network can adapt its airtime accordingly.
                                                                                  Using the proposed model to classify saturated and unsatu-
                                                                                  rated network has the following advantages:
                                                                                     • It helps the co-located technology to make simple
                                                                                       coexistence decision algorithms as compared to aggre-
                                                                                       gated throughput and COT based coexistence decision
                                                                                       algorithms which depend on many parameters such as
                                                                                       Modulation and Coding Schemes and packet size and it
                                                                                       requires decoding and deep packet inspection of Wi-Fi
                                                                                       frames.
FIGURE 3. Histogram of Interframe Spacing.                                           • It enhances the implementation of real-time coexistence
                                                                                       decisions as there is no delay to receive reports of Wi-Fi
Hence, distinguishing saturated and unsaturated Wi-Fi net-                             network traffic load status which are reported from the
works seems to be a hard problem that cannot be achieved by                            Wi-Fi nodes via a messaging protocol between infras-
applying simple rules on COT statistics.                                               tructures. This also makes it in compliance with Com-
                                                                                       mercial Off-the-shelf (COTS) Wi-Fi devices as there
IV. PROPOSED SOLUTION                                                                  is no need for modifying the network architecture to
From the previous section, it becomes clear that rule-based                            exchange messages for reporting Wi-Fi traffic status.
solutions are not suitable for the identification of satu-                           • It is compliant with all possible IEEE802.11 standards
rated or unsaturated Wi-Fi network. Therefore, we introduce                            and MAC features of frame management such as frame
ML techniques by developing a CNN model to identify the                                aggregation, frame fragmentation and block acknowl-
status of Wi-Fi traffic based on the histogram of IFS, average                         edgment. In the proposed scheme the statistics of IFS
IFS duration, and collision percentage of the transmitted                              is used to develop a model that can determine Wi-Fi sat-
frames.                                                                                uration. The IFS statistics is dependent on the contention
   Figure 4 shows the complete architecture of the CNN                                 window and back-off time selected based on the number
based saturation sensing model (training and execution) and                            of active senders contending on the medium. Therefore,
it comprises the following sequential steps: channel assess-                           the IFS histogram of saturated Wi-Fi networks has sim-
ment, pre-processing, CNN modeling training/validation, and                            ilar features even if different IEEE 802.11 standards
decision. Initially, the channel assessment step is done to                            are considered. Hence, a model trained with 802.11a
sense the duration of each transmitted Wi-Fi frame over an                             network can be used with other IEEE 802.11 standards
operating channel. In practice, this stage can be done by                              too.
capturing and processing the IQ samples of Wi-Fi traffic
as described in our previous work [16]. In this work, the                         V. NEURAL NETWORK MODEL FOR WI-FI SATURATION
Wi-Fi network is modeled in the ns-3 simulator and the                            SENSING
duration of each frame is obtained by monitoring the chan-                        A. DATA COLLECTION AND PROCESSING
nel model. In the pre-processing step, the histogram of IFS                       In order to develop a CNN model that can classify saturated
and the average IFS duration features are extracted. The                          and unsaturated traffic, we prepared a large dataset that rep-
percentage of frame collisions are further obtained from                          resents the traffic characteristics of both cases. In this dataset
the frame statistics collected in the channel assessment step.                    collection, different scenarios of saturated and unsaturated
The ACK frame can be easily identified due to its short                           802.11a networks were modelled using ns-3 simulator based
duration, typically 28µs and hence we can observe if each                         on the parameters mentioned in Table 1. The parameters
transmitted frame has its corresponding ACK. After gen-                           considered in preparation of the dataset were selected to
erating the three features (i) histogram distribution of IFS,                     cover a wide range of possible practical network configu-
(ii) average IFS duration and (iii) collision percentage of the                   rations. The number of active stations varied from 1 to 50
frames on the channel, the CNN modeling training/validation                       (1,2,3,. . . ,50) based on the topology shown in Figure 1.

VOLUME 9, 2021                                                                                                                                42965
M. Girmay et al.: Machine Learning Enabled Wi-Fi Saturation Sensing for Fair Coexistence in Unlicensed Spectrum

The stations are randomly distributed within a radius of 25m.                     considered for each certain situation. From our inspection
The topology and range of location of the stations were                           on different parameter configurations, we have observed that
selected to consider a wide range of scenarios in the same                        the IFS distribution does not change significantly for fixed
collision domain. Packet sizes of 500, 1000, 1500, and                            packet size, traffic load, and CWmin (if the number of active
2000 bytes were used to represent from short to long packets.                     nodes does not change significantly) and this leads to higher
To cover a sufficient range of possible practical network                         accuracy even if few sample elements are considered for each
configurations, minimum contention window values of 15,                           network configuration.
31, 63, 127, 255, 511, and 1023 were considered. The PAR
is tuned below and above a grey region of saturation point                         B. CNN STRUCTURE
for saturated and unsaturated networks respectively. Once the                     Since we have different types of features (i) histogram of
PAR of saturation point for a specific network configura-                         IFS (26 values of x and 26 values of y), (ii) average IFS
tion is determined to be PARsat , the grey region is defined                      duration (σ - single value), and (iii) percentage of frame
when the PAR lies between PARsat − 250 packet/s and                               collision (ρ - single value), three CNN architectures were
PARsat +250 packet/s. UDP traffic was generated at different                      designed (Figure 5) each one using different combinations
packet arrival rates to investigate the traffic characteristics of                of the three features. Figure 5(a) shows a CNN architecture
different load levels covering a wide range of performance                        with two horizontal branches and each branch is associated
variations in saturated and unsaturated traffic cases.                            with 26 values of x and y. Further, each branch comprises
   For each configuration and traffic load examined in this                       two 1D convolutional layers and two fully connected layers.
study, the simulation run-time was set to 20 minutes. Then,                       The two 1D convolutional layers use feature maps and kernel
the starting time and duration of each frame accessing                            size of: Conv1D layer-1 (feature maps 32, kernel size 3) and
the medium is monitored to generate the IFS distribution                          Conv1D layer-2 (feature maps 16, kernel size 2). Both the
and collision percentage. This channel monitoring is done                         branches are concatenated at the concatenation point and
based on frames transmitted after the first minute, as the                        after that three more fully connected layers are used. The
IEEE802.11 association process takes place in the start                           hyperparameters including feature maps, kernel size, number
up of the connection between the AP and the stations.                             of layers, neurons count, etc., are selected because they give
Each element ε in a row of the dataset is obtained by                             best accuracy and generalization performance. The last fully
monitoring IFS and percentage of collision and is com-                            connected layer of the architecture is the softmax layer and
posed of {x1 , x2 , . . . , x26 , y1 , y2 , . . . , y26 , σ, ρ, l}. The values    comprises 2 neurons. The output of 2 neurons represents the
{x1 , x2 . . . , x26 , y1 , y2 , . . . , y26 } represent the histogram of         two classes: ’saturated traffic’ and ’unsaturated traffic’. This
the IFS values for the M frames that accessed the medium                          CNN architecture only relies on the histogram of IFS.
in 1 second duration. x26 represents the maximum IFS dura-                           Figure 5(b) shows a CNN architecture that is based on
tion (in ms) in the considered M frames whereas x1 is x26 /26.                    two sets of features (i) histogram of IFS (26 values of x and
The remaining xi values are buckets at uniform spacing                            26 values of y) and (ii) average IFS duration (σ - single value).
between x1 and x26 . For i>1, the values of yi represent the IFS                  The two input features correspond to three branches in the
histogram count (in percentage) for a corresponding bucket                        CNN architecture where the first two branches correspond to
interval between xi-1 and xi . In the case of y1 , the bucket                     the histogram of IFS and the third branch corresponds to the
interval is between 0 and x1 . The σ and ρ in the sequence of                     average IFS duration.
the dataset element represent the average IFS duration (in ms)                       Similarly, Figure 5(c) shows a CNN architecture that is
and percentage of frame collisions respectively. The average                      based on three sets of features (i) histogram of IFS (26 values
IFS duration is computed by averaging the IFS between                             of x and y), (ii) average duration of IFS (σ - single value),
each frame in the dataset element ε over the total number                         and (iii) percentage of frame collision (ρ - single value).
of frames. Similarly, the collision percentage is computed                        The three input features correspond to four branches in the
by counting the frames that are not acknowledged (if no                           CNN architecture. The first two branches correspond to the
corresponding ACK frame is received by the transmitter).                          histogram of IFS, the second branch corresponds to the aver-
The last parameter in the data set element is l which repre-                      age IFS duration, and the third branch corresponds to the
sents the labeling. Labels ‘‘1’’ and ‘‘0’’ represent saturated                    percentage of frame collision.
and unsaturated Wi-Fi networks respectively. Based on this                           The goal of having three models with distinct input features
approach, 20,000 sample elements are collected with a more                        is to analyze which input feature combinations are more rel-
or less equal portion of saturated and unsaturated traffic                        evant in the classification of saturated and unsaturated Wi-Fi
scenarios. With this dataset size, few sample elements of a                       networks.
specific network configuration are used for training. How-                           We captured two datasets: (i) training and validation
ever, we have observed that increasing the dataset beyond                         and (ii) test. The total number of sample elements in the
20,000 does not produce significant improvement on the                            training and validation dataset are 20,000, as mentioned ear-
performance of the model. This shows that the granularity                         lier. Each sample element has a size of (1 x 54) elements
of the parameter setting in our training is small enough to                       and it is further divided into three features: (1 x 52) or two
achieve good accuracy even though few sample elements are                         times 26 values of the histogram of IFS, (1 x 1) single value

42966                                                                                                                                           VOLUME 9, 2021
M. Girmay et al.: Machine Learning Enabled Wi-Fi Saturation Sensing for Fair Coexistence in Unlicensed Spectrum
FIGURE 5. Convolutional Neural Network Architecture for a) model based on the histogram data of IFS b) model based on
histogram data of IFS and average IFS duration c) model based on histogram data of IFS, average IFS duration, and percentage of
frame collision.
VOLUME 9, 2021 42967M. Girmay et al.: Machine Learning Enabled Wi-Fi Saturation Sensing for Fair Coexistence in Unlicensed Spectrum
of the average IFS duration, and (1 x 1) single value of Wi-Fi networks doesn’t change significantly at least for few
the percentage of frame collision. For training of the three seconds [51].
classifiers, we divided the data into training and validation The first step in the proposed saturation sensing scheme
datasets with a split of 70/30 and the whole dataset was is capturing the I/Q samples of the wireless signal from the
normalized using StandardScaler from sklearn python. For medium and classifying Wi-Fi frames. To estimate the Wi-Fi
the optimizer, the Adam optimizer [50] was used as it gave the traffic load we generate an IFS histogram based on IFS values
best accuracy performance. In addition, ReduceLROnPlateau of Wi-Fi frames captured in a period of 1s. In our simula-
was used from Tensorflow because it helped in reducing the tion, we use a discrete event simulator (ns-3) and parameter
learning rate from 0.001 to 0.0001 when the validation loss parsing is done by functions and hence the collection of
stopped improving. In order to have a good balance between Wi-Fi frame statistics occurs incurring negligible processing
overfitting and underfitting, a batch size of 512 and a dropout latency. However, in real time implementations, a technology
of 0.40 were used. The total number of sample elements in the recognition solution is required to capture, pre-process and
test dataset are 500 and this test set was captured intentionally classify the Wi-Fi frames on the medium. In our model the
in the grey region of the dataset used and in a Wi-Fi network LTE eNB captures I/Q samples to classify Wi-Fi frames and
configuration where hidden terminal problem occurs. The there is no need for Wi-Fi packet decoding. In our previ-
concern of generating the test dataset in the grey region and ous work [52], we have seen that the capturing I/Q sam-
hidden node problem cases is to check the accuracy of the ples, pre-processing and classifying process requires a total
three models i.e., how well they identify such corner case of 951ms (average over 100 runs, using NVIDIA Jetson Nano
sample elements. The training and test datasets are publicly for executing a wireless technology recognition system) for
available and can be used by other researchers .1 wireless signals measured in 1 second. Once the wireless
technologies are classified from the measured wireless signal,
C. IMPLEMENTATION PLATFORM the Wi-Fi frames are used to generate an IFS histogram
The neural network algorithm framework is developed based which is used by the trained model to classify the saturation
on Python 3.9.0 with Tensorflow 1.1.0 and Keras 2.2.5. status of the Wi-Fi network. Executing this process takes an
Keras is a high-level application programming interface for average processing time of 81ms (average over 100 runs).
neural networks written in Python and it is designed to Therefore, in practical systems the proposed system requires
run seamlessly on top of both Central Processing Unit and an end-to-end processing time of 1.032s. In the proposed
Graphics Processing Unit. Different Wi-Fi network scenarios Wi-Fi saturation sensing scheme, the model is proposed to
were modeled using ns-3.31 to generate the training/testing report the saturation status every T seconds. The period T
datasets which are used to train and validate the proposed can be optimally selected based on the traffic dynamics of
CNN models. In our setup, we have used a NVIDIA GTX the co-located networks. For a very dynamic traffic the value
1080 Ti GPU that incorporates 3584 NVIDIA Cuda cores. of T has to be set low. On the other hand, this value can be
Here we discuss the scalability and time complexity of increased for less dynamic traffic to reduce computational
the proposed saturation classification solution. In this work, overhead. However, this optimal selection of period T is not in
a wide range of Wi-Fi network scenarios are investigated. the scope of this work. Generally, it can be observed that the
Wi-Fi networks that have 1-50 active nodes with a traffic processing time of the proposed scheme will have a negligible
load which varies in a wide range from a very low traffic impact on implementing real-time coexistence decisions.
load to high traffic load (beyond the capacity of the net- One of the challenges of implementing such ML based
work) are considered in this work and the range of scenarios models is that the training of the ML model requires GPU
considered in the study cover most practical Wi-Fi network hardware. In practical implementations, the model can be
deployments. This work considers a clean channel environ- trained on GPUs first and executed on CPUs (e.g. the pro-
ment where noise and interference from other networks are posed model can be executed on the CPU of LTE eNB to
not considered. However, our saturation classification mod- enhance LTE and Wi-Fi coexistence). There is also a recent
els solely depend on statistics of spacing duration between trend in ML which involves executing ML models on embed-
consecutive Wi-Fi frames (IFS and average IFS duration) ded platforms e.g., NVIDIA Jetson Nano, microcontrollers,
coming from an efficient technology recognition system. Our etc by using model quantization. For instance, our recent
previous works on technology recognition for identifying work uses a NVIDIA Jetson Nano for executing a CNN
LTE and Wi-Fi technologies operate accurately in different model for recognition of wireless technologies [52]. How-
complex environments in the presence of multiple access ever, the focus in this work is not on model quantization and
points and stations [16]. This confirms that the proposed we leave this out for future investigations. Hence, it has been
saturation classification solution can also operate in differ- validated that the model can be trained offline on a more
ent complex environments with varying access points and powerful GPU and implemented on commodity CPU devices
stations. In most practical applications, the traffic load of for real-time operation by the coexisting technologies.
Despite the need for GPU based training, the implemen-
1 https://gitlab.ilabt.imec.be/mgirmay/ML-enabled-wi-fi-saturation- tation of the proposed solution is less complex than tradi-
sensing tional approaches which consider deployment of a central
42968 VOLUME 9, 2021M. Girmay et al.: Machine Learning Enabled Wi-Fi Saturation Sensing for Fair Coexistence in Unlicensed Spectrum
coordinator and they require huge information exchange CNN models. This CNN model also has simpler CNN layer
overhead for exchanging information with the co-located architecture (Figure 5) and fewer model parameters (Table 4)
networks through a collaboration protocol. Whereas the which make it a better option for practical implementations.
proposed ML approach does not require such information The IFS histogram based model outperforms the other models
exchange with the co-located network and the information as the features of the IFS histogram indirectly reflect the
about Wi-Fi saturation can be acquired on the eNB side by average IFS value and collision percentage. The IFS duration
executing the ML model. In general, our model is proposed between a successfully decoded frame and its corresponding
to be implemented in wireless technologies co-located with ACK frame is 16 µs (which is the SIFS). Hence, the fre-
Wi-Fi and there are no any modifications required in the quency count of this SIFS value in the IFS histogram indicates
Wi-Fi side. Hence, our solution has no effect on implemen- the number of ACK frames, which indirectly reflects the
tation complexity of the Wi-Fi networks and this goes in line percentage of collisions. Furthermore, if few active nodes
with Wi-Fi own goals of simple implementation. (e.g. 1 or 2 active nodes) are considered, the collision per-
centage remains low even if the traffic load is high enough to
VI. PERFORMANCE EVALUATION exceed the saturation point and this can mislead the classifi-
A. MODEL PERFORMANCE cation of saturated and unsaturated Wi-Fi networks.
In the previous section, we have described 3 different CNN
models that can be used to classify saturated and unsatu- B. CONFUSION MATRIX
rated Wi-Fi networks. The models are trained by splitting the In order to further investigate the performance of the pro-
dataset into training and testing datasets with a split of 70/30. posed CNN models on classifying saturated and unsatu-
Table 4 shows the performance of the three proposed CNN rated Wi-Fi networks, we visualized the confusion matrix
models in terms of different metrics including accuracy on of the CNN models for the validation datasets, as presented
validation dataset, accuracy on corner case test dataset, and in Figure 6 for the three CNN models. In this figure, each
model parameters. In the table, Model a represents the CNN column stands for the true label (saturated and unsaturated
model based on IFS histogram only whereas Model b refers to Wi-Fi networks) and each row represents for the predicted
the CNN based on IFS histogram and average IFS duration. labels. The CNN-predicted tags and the true labels indicate a
Simlarly, Model c refers to the CNN model based on IFS high accuracy for all proposed CNN models.
histogram, IFS duration and Collision percentage. Initially,
the accuracy of the models is evaluated by testing the perfor- C. ACCURACY AND LOSS CURVES
mance of the CNN models on the validation dataset. In terms After analyzing the performance of the proposed CNN mod-
of accuracy on the validation dataset, the results show that the els, we have observed that the IFS histogram based CNN
CNN model based on the histogram of IFS only outperforms model is the best in terms of accuracy and simplicity. In this
the other two models. section, the accuracy and loss curves of this model are pre-
sented. The accuracy and loss curves are obtained in a com-
TABLE 4. Performance of CNN models proposed to classify saturated and plete CNN training process by testing the performance of the
unsaturated Wi-Fi network. model on the 30% of the total dataset samples which are used
to validate the CNN model. Figure 7(b) and Figure 7(a) show
the accuracy and loss curves of the CNN model respectively.
The results show that the model has a fast convergence on
both classification accuracy and loss.
The performance of the models is also evaluated on a D. SYSTEM ILLUSTRATION
special test dataset which is obtained based on corner case Figure 8 shows IFS histogram of saturated and unsaturated
scenarios. This performance evaluation is done to validate if Wi-Fi networks in the grey region of the dataset used to
the CNN models can accurately classify saturated and unsat- train the CNN models. The Figure shows the values of
urated Wi-Fi networks in corner case scenarios. The test set {x1 , x2 , . . . , x26 , y1 , y2 , . . . , y26 } which are generated based
considered in this evaluation includes traffic scenarios which on the procedure described in Section V-A. The histograms
lie in the grey region of the training dataset. This special test presented in this graph are obtained by configuring 10 active
set also includes Wi-Fi network configurations with hidden nodes that use CWmin of 15 and CWmax is set to 1023. For
node problems. The results show that the IFS histogram based this specific configuration, the cumulative PAR of satura-
CNN model performs better than the other proposed models. tion point (PARsat ) is determined to be 2260 packets/s, i.e
In the corner case dataset, the IFS histogram based CNN 226 packets/s for each active node. The IFS histograms for
model can classify saturated and unsaturated Wi-Fi networks unsaturated and saturated Wi-Fi networks shown in Figure 8
at an accuracy of 94.8% (Table 4). are generated by setting the cumulative PAR of the 10 active
Based on the performance evaluation on the validation nodes to 2200 packet/s and 2300 packet/s respectively. From
and test datasets, we can observe that the CNN model based the classification decision outcome of the trained model,
on IFS histogram performs better than the other proposed it can be observed that our IFS histogram based CNN model
VOLUME 9, 2021 42969M. Girmay et al.: Machine Learning Enabled Wi-Fi Saturation Sensing for Fair Coexistence in Unlicensed Spectrum
FIGURE 7. Performance of CNN based on IFS histogram a) model
accuracy b) model loss.
TABLE 5. Wi-Fi traffic load estimation outcomes based on different
approaches.
FIGURE 6. Confusion matrix a) CNN based on IFS histogram b) CNN
based on IFS histogram and average IFS c) CNN based on IFS histogram,
average IFS and collision percentage.
can accurately classify them despite a very similar distribu-
tion pattern.
E. COMPARISON OF THE PROPOSED SCHEME WITH
EXISTING WI-FI LOAD ESTIMATION TECHNIQUES
In Section II we have reviewed many coexistence schemes packet size = 1500 bytes), and Config-4 (AN = 20, PAR =
and approaches used to estimate the load of a Wi-Fi net- 150 packets/s/AN, packet size = 500 bytes).
work. Most of the existing coexistence studies assume that As it can be observed from the configurations used, 2 and
there is a signaling protocol which is available between 20 active nodes with packet sizes of 500 byte and 1500 byte
co-located networks to inform the networks about the cur- are considered for the performance comparison. The CWmin
rent load, or they can decode Wi-Fi traffic. However, there was configured to 15 and CWmax was set 1023. ENAN based
are also some techniques proposed to estimate the load in load estimation uses the number of active nodes to estimate
a Wi-Fi network. Mostly, Estimation of Number of Active the Wi-Fi and gives wrong load estimations in Config-2 (few
Nodes (ENAN) [29]–[31], or computation of COT [16], AN with high PAR each) and Config-3 (many AN with low
[34] are used to estimate the traffic load of Wi-Fi network. PAR each). We can also observe that Config-2 is saturated
Table 5 shows the load estimation reports of the ENAN and has a COT of 60.7% on contrary Config-3 is unsaturated
based, COT based and the proposed Wi-Fi load estimations with a COT of 66.8%. Hence, it is not easy to distinguish
in different scenarios. The network configurations used for saturated and unsaturated Wi-Fi networks using COT. On the
this performance comparison are Config-1 (AN = 2, PAR = other hand, Table 5 shows that the proposed solution can
1000 packets/s/AN, packet size = 1500 bytes), Config-2 accurately classify the saturated and unsaturated Wi-Fi traffic
(AN = 2, PAR = 2000 packets/s/AN, packet size = loads. In general, it can be observed that the proposed model
500 bytes), Config-3 (AN = 20, PAR = 100 packets/s/AN, outperforms the existing schemes as it does not require any
42970 VOLUME 9, 2021You can also read