Modelling Spatial Behaviours in Clinical Team Simulations using Epistemic Network Analysis: Methodology and Teacher Evaluation
←
→
Page content transcription
If your browser does not render page correctly, please read the page content below
Modelling Spatial Behaviours in Clinical Team Simulations using
Epistemic Network Analysis: Methodology and Teacher Evaluation

GLORIA MILENA FERNANDEZ-NIETO, University of Technology Sydney, AUS
ROBERTO MARTINEZ-MALDONADO, Monash University, AUS
KIRSTY KITTO, University of Technology Sydney, AUS
SIMON BUCKINGHAM SHUM, University of Technology Sydney, AUS
In nursing education through team simulations, students must learn to position themselves correctly in coordination with
colleagues. However, with multiple student teams in action, it is difficult for teachers to give detailed, timely feedback on these
spatial behaviours to each team. Indoor-positioning technologies can now capture student spatial behaviours, but relatively
little work has focused on giving meaning to student activity traces, transforming low-level x/y coordinates into language
that makes sense to teachers. Even less research has investigated if teachers can make sense of that feedback. This paper
therefore makes two contributions. (1) Methodologically, we document the use of Epistemic Network Analysis (ENA) as
an approach to model and visualise students’ movements. To our knowledge, this is the first application of ENA to analyse
human movement. (2) We evaluated teachers’ responses to ENA diagrams through qualitative analysis of video-recorded
sessions. Teachers constructed consistent narratives about ENA diagrams’ meaning, and valued the new insights ENA offered.
However, ENA’s abstract visualisation of spatial behaviours was not intuitive, and caused some confusions. We propose,
therefore, that the power of ENA modelling can be combined with other spatial representations such as a classroom map, by
overlaying annotations to create a more intuitive user experience.
CCS Concepts: • Applied computing → Collaborative learning; Computer-assisted instruction; Learning management systems.
Additional Key Words and Phrases: Epistemic Network Analysis, nursing, simulation, spatial behaviour, qualitative analysis
ACM Reference Format:
Gloria Milena Fernandez-Nieto, Roberto Martinez-Maldonado, Kirsty Kitto, and Simon Buckingham Shum. 2021. Modelling
Spatial Behaviours in Clinical Team Simulations using Epistemic Network Analysis: Methodology and Teacher Evaluation. 1,
1 (January 2021), 16 pages. https://doi.org/10.1145/nnnnnnn.nnnnnnn

1    INTRODUCTION
In healthcare education, students are often immersed in manikin-based team simulations (see Figure 1) designed
to provide realistic scenarios that help them to practise a range of clinical procedures [14] and develop critical
clinical skills that they will need in the workplace [4] to improve patient outcomes [21]. Specific spatial abilities are
required for registered healthcare professionals [16], such as knowing when to keep close physical proximity to
the patient [31] and to other team members [27]; and being able to accomplish a specific task through appropriate
positioning and coordination in a specific location of the ward [44].
Authors’ addresses: Gloria Milena Fernandez-Nieto, gloria.m.fernandeznieto@student.uts.edu.au, University of Technology Sydney, Sydney,
NSW, AUS; Roberto Martinez-Maldonado, Roberto.MartinezMaldonado@monash.edu, Monash University, Melburne, Victoria, AUS; Kirsty
Kitto, Kirsty.Kitto@uts.edu.au, University of Technology Sydney, Sydney, NSW, AUS; Simon Buckingham Shum, Simon.BuckinghamShum@
uts.edu.au, University of Technology Sydney, Sydney, NSW, AUS.

Permission to make digital or hard copies of all or part of this work for personal or classroom use is granted without fee provided that
copies are not made or distributed for profit or commercial advantage and that copies bear this notice and the full citation on the first
page. Copyrights for components of this work owned by others than ACM must be honored. Abstracting with credit is permitted. To copy
otherwise, or republish, to post on servers or to redistribute to lists, requires prior specific permission and/or a fee. Request permissions from
permissions@acm.org.
© 2021 Association for Computing Machinery.
XXXX-XXXX/2021/1-ART $15.00
https://doi.org/10.1145/nnnnnnn.nnnnnnn

                                                                                        , Vol. 1, No. 1, Article . Publication date: January 2021.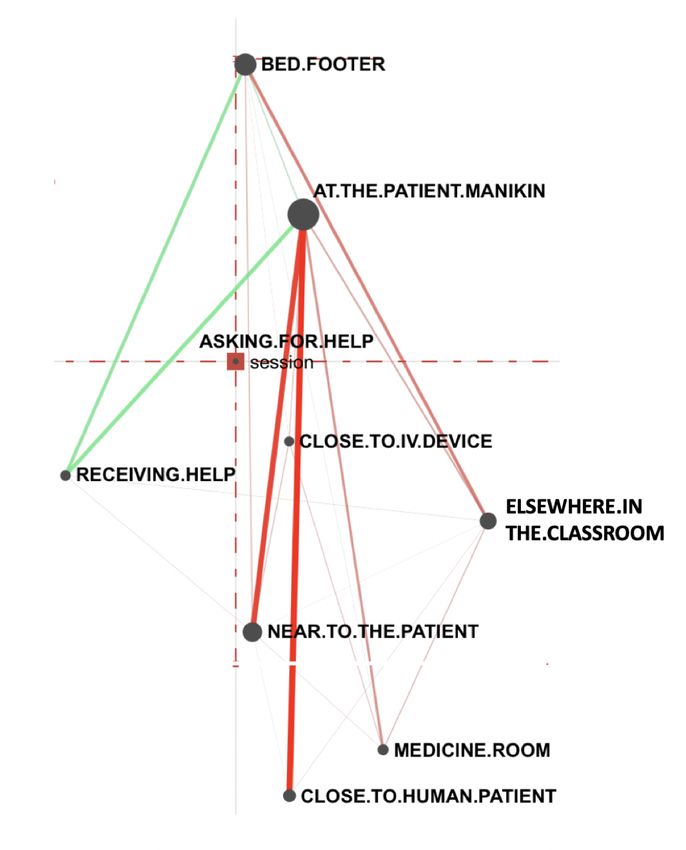
2   • Gloria Milena Fernandez-Nieto, Roberto Martinez-Maldonado, Kirsty Kitto, and Simon Buckingham Shum

                    Fig. 1. Healthcare simulation ward: meaningful spaces of interest as defined by teachers.

   The use of evidence for debriefing after the simulation is a signature pedagogy in simulation-based healthcare
education [7] that enables students to reflect on errors and for educators to engage in dialogic feedback with
students. However, many spatial behaviours in physical spaces can easily become occluded due to the multiple
tasks students have to accomplish, and the fact that there are typically 5-6 teams in action on the ward. Although
video-based products to support student reflection exist, they are typically impractical for in-class use (it is
too difficult for the teacher to cue up key moments from multiple teams, ready for a short 15-20 minute group
debriefing session), and imprecise for generating evidence about positioning measures. In turn, healthcare
students rarely reflect on such evidence to improve their spatial abilities [15]. Also teachers may commonly find
it challenging to assess and support students’ development of such spatial skills. This lack of evidence to inform
reflective training practices has been identified as a persistent gap in healthcare education [22].
   Indoor-positioning technologies can pervasively capture traces of student spatial behaviours which, if effectively
curated, could be rendered visible for the purpose of supporting reflection and learning on spatial abilities.
However, despite a growing interest in using positioning analytics in healthcare (e.g. [11, 23]) and in classroom
studies (e.g. [25, 33]) little work has focused on giving meaning to such low-level x/y coordinates beyond
measuring proximity. To address this, we investigate the use of Epistemic Network Analysis (ENA) [37] as
a means to imbue healthcare students’ positioning data with the meanings that presence and movement in
particular spaces of interest (Figure 1) signify during team simulations, and make these visible for discussion.
   First, this paper contributes a better understanding of the potential for ENA representations to support
reflection on spatial team behaviours, by presenting a qualitative study that examines teachers’ perspectives
on ENA representations of spatial behaviours. To generate these, positioning data was captured while teams of
undergraduate nurses engaged in healthcare simulations. A set of spaces of interest, particularly relevant for
the simulation tasks, were identified from previous co-research with teachers who designed and facilitated the
experience. Based on these, positioning data was modelled, by following principles of Quantitative Ethnography
(QE) to encode multiple sources of data [6] into higher-order meaningful codes, and were represented as epistemic
networks to teachers. Second, this paper documents teachers’ perspectives on such ENA representations, in terms

, Vol. 1, No. 1, Article . Publication date: January 2021.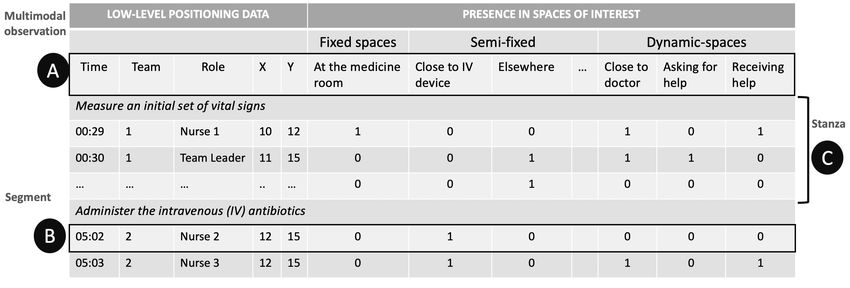
Modelling Spatial Behaviours in Clinical Team Simulations using Epistemic Network Analysis: Methodology and Teacher Evaluation • 3
of how they: (i) made sense of the ENA diagrams; (ii) envisaged potential uses of ENA to support their teaching;
and (iii) proposed improvements to ENA diagrams to better support students in guided reflection.
The rest of the paper is structured as follows. Section 2 presents the foundations and related work in the areas
of indoor positioning analytics in education and Epistemic Network Analysis. Section 3 introduces the simulation
learning context. Section 4 describes how positioning data was collected and modelled, and how the epistemic
networks of spatial data were generated and evaluated with teachers. Section 5 presents the results from such
evaluations performed with five educators to examine their perceptions on spatial ENA representations. Finally,
Section 6 discusses the results and presents potential avenues of future work. The paper finalises with some
concluding remarks in Section 7.
2 BACKGROUND AND RELATED WORK
This section presents (i) current works exploring spatial aspects of learning using indoor positioning technologies
and analytics; and (ii) foundations of Epistemic Network Analysis.
2.1 Indoor Positioning Analytics in Education
Recent developments in sensing technologies, and improvements in their accuracy, are enabling new ways to
investigate complex processes that occur in physical learning settings (e.g. [30, 43]). The traces created by these
technologies are opening up opportunities to examine the spatial behaviours of students in physical learning
spaces, and so to support both researchers’ investigations, and teachers’ reflections. For instance, Sensei [33] and
EduSense [1] equip classrooms with sensing technologies that enable automatic proximity tracking of teachers
and students. Sensei relies on tiny proximity sensors embedded in shoes and other wearables to provide relative
positions of students and teachers in a classroom. This enables the creation of basic visualisations that assist
teachers to observe which areas of the classroom they visit more, which students they interact with, and for
how long. EduSense is a computer vision system that detects the proximity of students and the teacher, also
recognising kinaesthetic behaviours such as raising a hand, and facial features. While both technologies provide
relative proximity rather than continuous position tracking, the data they capture holds promise for generating a
deeper understanding of spatial behaviours.
Other researchers have used indoor positioning systems that enable tracking the locations of teachers and
students point by point. For example, An et al. [2] and Martinez-Maldonado [24] created displays that alerted
a teacher who appeared to have spent little time with certain students. Going beyond measuring proximity,
Martinez-Maldonado et al. [25] describe Moodoo, a library to extract spatial metrics related to instructional
behaviours which enables the analysis of how different learning designs impact upon the way teachers move in
classrooms and approach students. However, most of these works have focused only on teachers’ behaviours. Less
work has focused on students working in teams, with some remarkable exceptions. These include work by Chng
et al. [8] who used depth sensors to automatically identify if students were working individually or collaboratively
in a maker-space, and then analyse how group strategies can impact individual student performance. Work by
Echeverria et al. [11] also looked at nursing spatial behaviours, visualising the positions of nurses around a
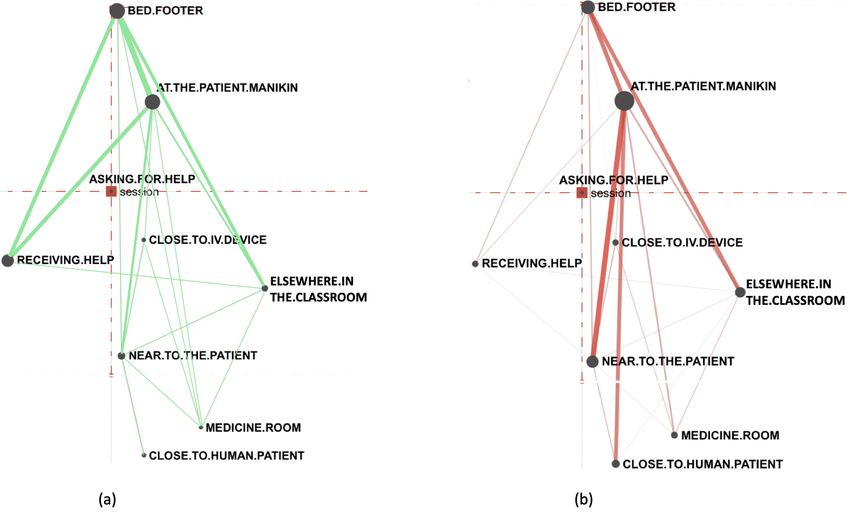
patient manikin using a combination of heatmaps and state diagrams. However, the visualisation in Figure 2,
representing student transitions between locations, does not provide any indication of either the frequency of
nurses movements, and critically, no indication of the meaning of nurses’ presence in different locations.
These examples demonstrate the growing interest in using indoor-positioning technologies to study spatial
behaviours in physical learning spaces, however, most are limited to quantifying proximity information among
teachers and students [8, 24, 33]. Although some metrics have been proposed to model the positioning or proximity
traces to correlate them to instructional [25] or collaborative [8] behaviours, less work has focused upon giving
meaning to such low-level x/y coordinates of students interacting in physical learning spaces for the purpose of
, Vol. 1, No. 1, Article . Publication date: January 2021.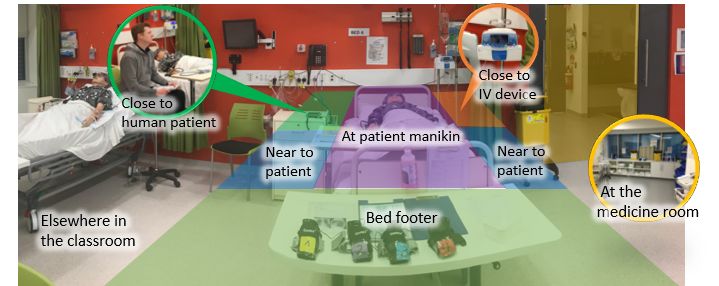
4 •    Gloria Milena Fernandez-Nieto, Roberto Martinez-Maldonado, Kirsty Kitto, and Simon Buckingham Shum

             Fig. 2. A visualisation of nurses’ movements between positions as modelled by Echeverria et al. [11].

supporting reflection and learning. We therefore go beyond these previous works, and particularly beyond the
work of Echeverria et al. [11] in a healthcare setting, by exploring the opportunity of using epistemic network
analysis (ENA) to imbue student positioning data with the meanings that certain spaces may have during a
particular learning task.
   In recent years, ENA has been gaining prominence in LA [40] and CSCL [10, 39] by virtue of the fact that it
focuses on the relationships between codes in data, and generates visualisations that facilitate the comparison
of datasets. Since we were interested in configurations of spatial relationships in students’ positioning, and
comparing student teams, ENA held promise as an analytic technique. However, modelling spatial data introduced
new challenges, critically, how does one map from low level sensor x/y coordinates, to higher order codes (required
for ENA modelling) that reflect the language and concepts used by nursing educators?
   The next section presents a brief introduction to ENA, and introduces the important question of how educators
make sense of ENA representations.

2.2    Epistemic Network Analysis
Epistemic Network Analysis (ENA) is a relatively novel statistical method, motivated by Quantitative Ethnography
(QE) [35], for constructing dynamic network models that quantify and visualise the structure and strength of
connections among elements in coded data [38]. In ENA, nodes represent the codes used to analyse the data,
and edges or links represent connections, which are weighted: thicker and more saturated lines suggest stronger
connections, whereas thinner, less saturated lines suggest weaker ones. ENA was initially developed to model
cognitive networks from discourse (e.g. chat or forum) data, for example, in collaboration and self-regulated
learning (e.g. [13, 17, 32, 41]).
   However, since its inception with discourse data, ENA has been used to extract insights from other sources
of data. For example, Wooldridge et al. [42] modelled communication patterns of health care teams in both
face-to-face and computer mediated settings. In this work, task allocation roles by medical staff (e.g. receivers and
senders of task allocations) in physical and virtual spaces became the codes in the epistemic networks to identify

, Vol. 1, No. 1, Article . Publication date: January 2021.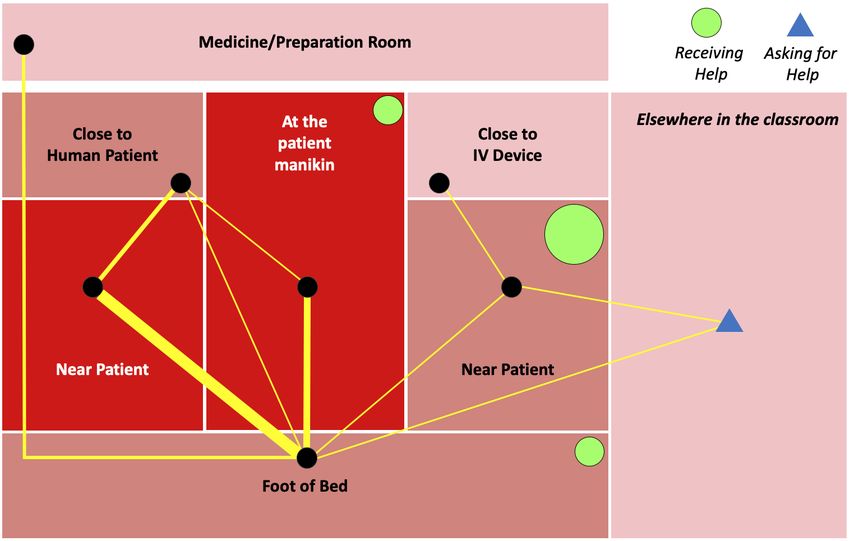
Modelling Spatial Behaviours in Clinical Team Simulations using Epistemic Network Analysis: Methodology and Teacher Evaluation •       5

communication patters. A further example is given by Collier [9], who applied ENA to fMRI (functional Magnetic
Resonance Imaging) data from children to identify areas of the brain that are co-activated during numeracy tasks.
Finally, Andrist et al. [3] applied ENA to model eye-tracking data to identify how dyads synchronise their gaze
patterns to perform collaborative tasks.
   However, we have identified two critical gaps in our understanding of ENA that our work seeks to address: (i)
ENA’s application to embodied learning, and (ii) teachers’ perceptions of ENA. Firstly, despite the importance of
face-to-face activity in myriad educational contexts, ENA has not yet been used to model student/teacher activity
in a physical space. Secondly, ENA has to date been a tool for researchers to make sense of their data, which means
that little evidence has been collected regarding teachers’ perceptions of ENA’s value to support their practice.
An exception is the work of Herder et al. [20], who piloted a simplified ENA diagram as part of a sophisticated
tool for high school teachers to monitor and assess students’ progress during an online simulation. The ENA was
generated in real time, from automated analysis of student actions. Of the three teachers who were studied, one
valued the concept of the network diagram to show higher order integration between concepts, another was not
confident about its coding classifications, and the third struggled to interpret it. All teachers were unfortunately
overwhelmed by the demands of the teaching their class, and so did not have time to experiment with it more
fully.
   To the best of our knowledge, this is the first paper in applying ENA to model spatial behavioural data. As
such, the two key contributions of this paper lie in its exploration of: (i) the potential of using ENA to imbue
students’ spatial data with the meanings that presence in particular spaces of interest signifies during a learning
task; and (ii) teachers’ perspectives on ENA representations of spatial behaviours of their nursing student teams.

3 CONTEXT
3.1 The Learning Situation
This paper focuses on five classes, part of a course on Integrated Nursing Practice, conducted during Week 7
(of a 12 week term) in 2019, with students in their third year at the [Anonymous university]. Approximately 25
students typically attend a class in the simulation ward, and they are organised in teams of 4–6 students, each
working in a simulated training scenario around a patient bed. One team in each of the five classes volunteered
to participate in this study and have their activity tracked, completing informed consent forms (ethics approval
number ETH16-0582). The average duration of the simulation was 69 minutes (std=14.4). A total of 25 students
(21 female) were studied (aged 20-45 years, mean=23.5, std=5.4). Five teachers were involved in teaching the five
classes.
   In this simulation, students took on various nursing roles to collaboratively care for a patient experiencing an
allergic reaction to medication. The teacher played the role of the main doctor on the ward, and one student
played the role of the patient, giving a voice to the manikin. According to the learning design, a highly effective
team should carry out the following critical actions:
   (1) Measure an initial set of vital signs;
   (2) Administer the intravenous (IV) antibiotics;
   (3) Take a second set of vital signs;
   (4) Stop the IV antibiotic after the patient reacts with chest tightness;
   (5) Perform an electrocardiography (ECG); and
   (6) Call the doctor after stopping the IV antibiotic.
   The simulation was therefore divided into 5 phases: Phase 1: patient assessment (from the beginning of the
simulation to the moment nurses realise the patient needs IV antibiotic); Phase 2: IV fluid preparation; Phase 3: IV
fluid administration; Phase 4: patient adverse reaction (since the patient starts complaining about the allergic
reaction until the moment nurses stop the IV antibiotic); Phase 5: patient recovery.

                                                                               , Vol. 1, No. 1, Article . Publication date: January 2021.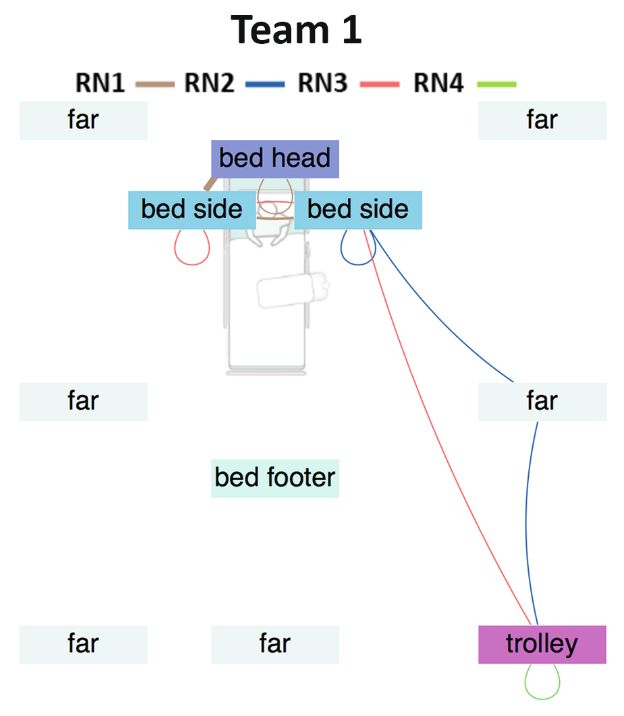
6       • Gloria Milena Fernandez-Nieto, Roberto Martinez-Maldonado, Kirsty Kitto, and Simon Buckingham Shum

4 METHODOLOGY
4.1 Positioning Data
Students’ positioning data was captured through wearable tags1 carried in waist-mounted bags. The positioning
system triangulates the exact location of each tag with reference to 8 anchors affixed to the classroom walls. The
raw positioning data consists of x and y coordinates in millimeters captured at 2-3Hz but downsampled to 1Hz
for normalisation purposes across teams.

4.2        Data Modelling
4.2.1 Identifying spaces of interest. Ward locations take on multiple meanings, based on the kind of activity
unfolding, and the presence of teachers, students and objects (e.g. devices, furniture) [29]. Following Hall’s
analysis of proxemic behaviour [18] such spaces can be of three types: fixed spaces, which have their shape and
size determined by the presence of objects that cannot easily be moved (e.g. walls or screens); semi-fixed spaces
which are established by movable features in the environment (e.g. tables, beds, curtains and clinical trolleys)
that only remain unmoved and unrearranged during peoples’ interactions; and dynamic spaces, which are formed
solely by the spacing and orientation of individuals as they interact with each other.
   The meanings that presence and movement in these spaces of interest signifies for the particular learning
design of the simulation under study have been identified during several years of co-research with the nursing
academics who teach the students, through a combination of formal interviews and past prototyping (Echeverria
et al. [11]). For example, these instructors have explained that in this simulation nurses usually gather around
the foot of the bed where the documentation about the patient is commonly located, but that at least one nurse
should remain close to the patient continuously after they complain about chest pain.

             Space of interest                                                                               Example expected behaviour
    Row                                                    Meaning                                                                                          Type
                  (codes)                                                                                          in current simulation
    1       At the medicine       Here, nurses commonly get medicine and equipment                Nurses are expected to be at the medicine room         Fixed
            Room                  they require for the patient care.                              retrieving the antibiotic and IV equipment.
    2       Close to IV device    From here, nurses can check, start and stop the IV de-          After noticing the patient is having an allergic re-   Semi-fixed
                                  vice.                                                           action nurses are expected to be close to the IV de-
                                                                                                  vice to stop it.
    3       Close to the human    Nurses being close to the student enacting the patient          Nurses are expected to be close to the patient per-    Semi-fixed
            patient               can indicate that verbal assessment of the patient is tak-      forming the initial assessment.
                                  ing place.
    4       Near to patient       At these spaces nurses validate the intubation device           Nurses are expected to be near to the patient vali-    Semi-fixed
                                  (left) and assess vital signs (e.g. pulse, hart rate) (right)   dating the intubation is working properly.
    5       At the      patient   Being very close to or on top of the patient bed can indi-      After noticing the patient is having an allergic re-   Semi-fixed
            manikin               cate the patient is being attended. Certain clinical pro-       action nurses should attach the ECG device to the
                                  cedures require nurses to lean over the patient’s bed.          manikin.
    6       At the bed footer     From here, the team leader monitors and delegates               The scribe should be next to the patient, or at the    Semi-fixed
                                  tasks; and nurses coordinate, read charts or write ob-          head/footer of the bead.
                                  servations.
    7       Elsewhere in the      Nurses can be in other spaces interacting with other            Nurses have to notify the doctor that the patient      Semi-fixed
            classroom             nurses, finding books (e.g. the Monthly Index of Med-           had an allergic reaction.
                                  ical Specialities) validating medication, or looking for
                                  the doctor (teacher).
    8       Asking for help       Nurses asking for help to the doctor (teacher).                 Nurses spending time elsewhere in the classroom        Dynamic
                                                                                                  and close to the doctor.
    9       Receiving help        Nurses receiving help from the doctor (teacher).                Nurses being close to the teacher in any space of      Dynamic
                                                                                                  interest but elsewhere in the classroom.
                                               Table 1. Codes for the meaningful spaces of interest.

4.2.2 Modelling from positioning data to spaces of interest. Each fixed and semi-fixed space of interest was
mapped as two-dimensional square regions in the tracker coordinate system to classify location (Figure 1). For
1 www.pozyx.io

, Vol. 1, No. 1, Article . Publication date: January 2021.
Modelling Spatial Behaviours in Clinical Team Simulations using Epistemic Network Analysis: Methodology and Teacher Evaluation • 7
the case of the dynamic spaces, proximity data between nurses and the teacher was used to dynamically identify
when students were close to the teacher and where in the classroom this occurred.
As described in section 4.2.1, spaces of interest for this simulation were elicited during an extensive process of
co-research with nursing academics, and are summarised in Table 1. For example, the only fixed space for this
simulation was the medicine room which is a well defined area with medical instruments and supplies (Table 1,
row 1). Semi-fixed spaces were determined by different areas depending on the position of the IV device (row 2),
the student acting as the patient (row 3), and the patient’s bed (rows 4-6), meaning that these spaces could change
depending on the classroom or lab where the simulation is being enacted. Finally, dynamic spaces were defined
as any area in which a nurse and doctor were in close proximity (≤1.5 m) to each other. Thus, if a nurse was
close to the teacher and they both were elsewhere in the classroom, this was coded as asking for help (row 8). If
they were both present in any of the semi-fixed spaces of interest (i.e. rows 2-6), this was coded as receiving help
(row 9). All the remaining positions in the classroom were coded as elsewhere in the classroom. Consequently,
each datapoint of each nurse in the dataset is associated with a space of interest, possibly in conjunction with
asking/receiving help.
To encode indoor positioning data and the spaces of interests into a higher-order level of meaning we followed
the Multimodal Matrix (MM) methodology [6]. Building on the MM, this paper’s novel contribution is documenting
how to drive the modelling of learners’ positioning data from teachers’ pedagogical intentions, and coding
fixed, semi-fixed and dynamic spaces of interest within a physical learning space. Figure 3 shows a simplified
representation of the modelling performed on the positioning data. The MM is a data structure in which each
code m is represented by a n column of the matrix. For example, Figure 3 (A) shows the raw data and the spaces
of interest.
Fig. 3. Schematic showing the application of the Multimodal Matrix modelling technique to two phases in the simulation
activity.
Based on QE, segments [36] (m rows) are the smallest units considered for analysis. For sensor data, each row
can represent a time window (e.g. one second in our studies) of the team activity (Figure 3, B). This way, the
content of each cell expresses an attribute of a given team member at that moment. In our study, we represented
the presence or absence of a student in one or more spaces of interest at a given moment (i.e., each second).
Finally, segments can be grouped into stanzas to represent meaningful associations. In discourse analysis, a stanza
might correspond to a number of utterances before or after a particular incident [12]. In our study, the phases of
simulation (see section 3) can serve to group the segments into stanzas (Figure 3, C).
, Vol. 1, No. 1, Article . Publication date: January 2021.8 • Gloria Milena Fernandez-Nieto, Roberto Martinez-Maldonado, Kirsty Kitto, and Simon Buckingham Shum
4.2.3 Generating epistemic networks from spatial data. The output of the modelling described above was processed
using the online ENA tool2 for the duration of the simulation. In the resulting epistemic networks, each node
represents the codes for fixed, semi-fixed and dynamic spaces of interest, and the activities of asking for and
receiving help, and each edge represents transitions between two spaces of interest, possibly in conjunction with
help seeking/receiving. The positioning of nodes does not correspond to actual positions on the floorplan (a key
point to which we will return when we report teachers’ responses). Instead, ENA automatically places the nodes
in fixed positions to facilitate visual comparison of networks (for details of the algorithm, see Shaffer [34]). From
the 5 teams, we selected the ENA diagrams of Team 1 (Figure 4a) and Team 3 (Figure 4b) for our study, because
they were the more contrasting teams (see Figure 5).
Fig. 4. Presence of nurses in spaces of interest around the patient and in the classroom during the healthcare simulation
using Epistemic Network Analysis for Team 1 (a) and Team 3 (b).
4.3 Evaluation of ENA diagrams with educators
The qualitative study in this paper used a retrospective reflection technique [19] to investigate the Nursing
educators’ responses to the ENA diagrams of their students’ activity. Five teachers (T1-T5) were interviewed,
each of whom had taught the simulation beforehand, to preserve the authenticity and value of the study. The
discourse analysis of five experts is sufficient to identify salient patterns and is effective for identifying most
usability problems with prototypes [28]. Our study sought to address three research questions:
• RQ1: What insights can teachers gain from visual representations of nursing teams spatial behaviours
using ENA?
2 http://www.epistemicnetwork.org/
, Vol. 1, No. 1, Article . Publication date: January 2021.Modelling Spatial Behaviours in Clinical Team Simulations using Epistemic Network Analysis: Methodology and Teacher Evaluation • 9
• RQ2: What potential uses of ENA for supporting teaching and reflection on nurses’ spatial behaviours are
envisaged?
• RQ3: If potential uses are identified, then what improvements are needed for making ENA representations
for special data into effective reflection tools for nurses?
4.3.1 Interview protocol. The interviews were conducted as approximately 20 minute online video conferences
via Zoom, structured as follows: (1) Explanation of the ENA diagram. The researcher showed a floorplan to explain
the spaces of interest, and then showed the ENA for Team 1 (Figure 4a) to show how they corresponded to the
node labels. It was emphasised that node locations bore no correspondence to the floorplan, the meanings of
edges and thickness were explained as reflecting the number of transitions between locations, but no explanation
was given about why nodes were positioned as they were (this was judged to be too complex to explain quickly).
(2) Interpretation of ENA (RQ1). Educators were asked to think aloud while inspecting the connections presented
in the three ENA diagrams shown in Figure 4. The prompt question was "According to this diagram, can you
explain how TEAM 1 transitions between the Spaces of Interest?" (3) Eliciting envisaged usage (RQs 2 and 3). After
viewing the three ENA diagrams, teachers were then asked about the potential value of ENA for student and
teacher reflections, and about any improvements to the ENA design that might help to support their teaching
practice.
Fig. 5. The comparison network shows the difference between teams: green edges where Team 1 is stronger, red edges where
Team 3 is stronger.
, Vol. 1, No. 1, Article . Publication date: January 2021.10 • Gloria Milena Fernandez-Nieto, Roberto Martinez-Maldonado, Kirsty Kitto, and Simon Buckingham Shum 4.3.2 Video analysis. The interviews were video-recorded, fully transcribed, and coded using NVivo. Two researchers were present in each session. We examined participants’ statements and their actions exploring the prototypes. Following Mcdonald et al. [26], and given the direct alignment between the study protocol and the analysis themes, statements of interest were jointly coded [5] by two researchers according to the pre-set themes of the study protocol: (a) teachers’ interpretations of ENA visual representations of spaces of interest; (b) anticipated usage strategies; and (c) opportunities to improve ENA to support reflection. Resulting coded statements were examined by the authors who had several discussions to select instances that illustrate the opportunities and concerns raised by the teachers. 5 RESULTS This section presents the results of the analysis organised around the three questions motivating these studies. 5.1 RQ1: Teachers’ Interpretations of the ENA Diagrams Strong connections. Four of the five teachers were immediately able to start interpreting the ENA diagrams of both teams (see Figure 4, a and b respectively) focusing on the visually salient, strongest connections (thicker edges). However one teacher found them very confusing and could not volunteer any reading of them. When interpreting the ENA diagram for team 1, teachers first mentioned the strong connection between the nodes bed footer and at the patient manikin. According to teachers, the meaning of this connection is associated with the patient-care construct (e.g. students assessing the patient vital signs). By focusing on the other two edges forming a triangle with the node receiving help, one of the teachers explained that “the most common behaviour of nurses in team 1 was moving from the head of the bed to the footer, because they [focused on] assessing the patient, and then they were receiving help from the teacher, probably because they needed guidance to achieve the task” (teacher T1). For team 3, teachers highlighted the connections between the nodes at the patient manikin, near to the patient and close to the human patient. For example, teacher T2 described that “these students seem to have started at the patient manikin more than anything else, then going close to the human patient, students did interact with the patient, with the person and the actual manikin”. Similarly, teacher T4 confirmed this as follows: “it looks like team 3 was doing more of communication with the actual human patient as well”. Regarding other strong connections, teachers explained the meaning of nurses using those spaces, for example, nurses being elsewhere in the classroom suggested that nurses may have gone to find additional help (e.g. books), or the ECG device to assess the patient. In sum, all educators agreed that team 1 was receiving significant help from the teacher, which for this simulation was not expected, because this is an immersive simulation and the students were meant to be addressing critical incidents independently as a team. Team 3 was much more focused on the patient, as expected. This suggests that teachers associated strong connections to the predominant spatial behaviours of students. Weak and missing connections. Teachers also interpreted thinner edges. For example, regarding the node close to IV devices in team 1, teacher T1 explained that “the [team members] do not need to be there very often [in that space], they are there just for preparing the medicine and then they give the medicine so that is fine, instead they need to be closer to the patient”. Also, teacher T5 explained that this weak connection occurred “probably because students first tried to figure out what was going on with the patient”, which according to this teacher is the explanation of the presence of some connection to the node receiving help. Regarding identified missing connections, three out of the five educators agreed that team 1 was generally not as close to the patient as was expected for this simulation. For example, the teacher T3 explained that “there was not a lot of contact with the human patient and it is a procedural problem of team 1” (note just one thin edge connected to the node close to human patient. However, teacher T1 argued that, although not ideal, team 1 could still assess the human patient because “students can still talk to the human patient from the other side of the bed. So they may have done a lot assessment on the actual manikin and then maybe just talked to the human patient from , Vol. 1, No. 1, Article . Publication date: January 2021.
Modelling Spatial Behaviours in Clinical Team Simulations using Epistemic Network Analysis: Methodology and Teacher Evaluation •       11

the other side of the bed”. The principal insight from the ENA representation for team 3, that all teachers agreed
with, was that students were generally far from the teacher, neither asking nor receiving help. For instance,
teacher T1 explained that “this team was autonomous because they look like they asked less for help, even when
they may have received some help, it seems they did not depend on it”. Teacher T5 described this behaviour from
the spatial traces as follows: “probably this team was in a more advance level of expertise or was more confident
with the work they were doing”. This suggests that, based on missing connections, teachers were also able to
identify the nurses’ lack of presence in spaces of interest, which pointed to qualities and also potential areas of
improvement for the teams.
   Comparing networks. Four out of five teachers suggested that this visual comparison (Figure 5) confirmed
what they interpreted from the individual ENA representations. For example, teacher T4, suggested that “this
[comparison visualisation] just reinforces what I was talking about before, there is a correction to be made for team 1
or a couple of corrections in terms of performance. More interaction to the patient is needed and they should avoid
receiving too much help from the teacher. Whereas, team 3, was much more engaged with the patient”. Likewise,
teacher T5 reflected on this comparison, suggesting that “students in team 1, which is the green one, were more
keen to ask for more help from the teacher than team 3, which was more independent, and tried to figure it out by
themselves what to do”. Finally, only one of the educators interpreted other connections apart from the more
prominent edges. Teacher T2 explained that “Team 3 went to the medication room a little bit more than the other
team” and associated this to the more independent and active behaviours of team 3.

5.2   RQ2: Anticipated Pedagogical Uses
Regarding the potential use of ENA representations for supporting their teaching practice, four out of five of the
teachers agreed that this tool could be very useful for nursing students to reflect on aspects like patient-care and
team autonomy. For example, T2 suggested that this tool could be used “during the debrief session to focus on
teams that might have required specific interventions, such as team 1”.
   Teacher T4 also highlighted the potential of using the ENA representations for teachers to reflect on their own
practice. This teacher explained how she focused on the extent to which she provided help to the students, as
follows: “for me as a teacher if I am doing an immersive simulation, I am expected to let students to figure out the
situations or try to address the simulation scenario by their own without my help”.
   Moreover, T1 explained that ENA representations can be very useful for teachers because they normally want
to compare teams at a glance, “it is good that you can see the comparison because then you can see the differences
among different teams”. Additionally, teacher T2 mentioned that whether or not students receive or request help
“can also indicate that they had to receive a kind of additional support or instruction to address the simulation, it
might suggest possible changes in the learning design”.
   In sum, teachers recognised the contribution of ENA diagrams to: identify teams’ spatial behaviours, compare
teams, interrogate their own practice (regarding to what extent they affected the immerse character of the sim),
and to revise the learning design.

5.3   RQ3: Improvements to ENA Diagrams
During the interviews teachers expressed concerns about the complexity of the visual representations to interpret.
For example, T3 stated that he recognised the value of the tool for reflection but “it is a bit difficult to interpret,
and there should be some clear guidelines to go to the clinical staff and students for them to understand what the
visualisation means”. In fact, we acknowledge that an accurate explanation of the ENA representation (codes and
connections) is needed to avoid teachers’ misinterpretations, specifically regarding the position of codes and its
independence with the actual floor position. This because, all teachers confused the node positions with a floor
position.

                                                                                , Vol. 1, No. 1, Article . Publication date: January 2021.
12 • Gloria Milena Fernandez-Nieto, Roberto Martinez-Maldonado, Kirsty Kitto, and Simon Buckingham Shum
A number of improvements were suggested, which reflected the distinctions being made between codes
(nodes). Three teachers recommended simplifying the ENA representations by combining the codes for the
patient-manikin and the human role-playing the patient (which counter-intuitively, were not next to each other in
the diagram): “the patient manikin and the person playing the role of the patient represent the same entity for the
simulation, both might refer to patient-care” (T1); “even when (the human patient and the manikin) are located at
different spatial data points, it would be worthwhile to combine them because that’s the composite” (T3).
However, in another instance, the nodes were not making an important distinction. T3 suggested splitting the
code near to the patient into two different codes: “there is a left side to the patient and a right side to the patient.
There will be different procedures being performed at each side. I think it may be worthwhile to consider separating
those ones out” [...] “the right hand side of the patient will be predominantly where students will be doing clinical
assessment, checking vital signs, and talking to the patient. Whereas the left side in this scenario is where the IV-device
is, having both might bring additional insights about the nurses behaviours”.
Finally, other recommendations were related to the inclusion of additional elements to support interpretations.
For example, the T3 suggested that the ENA representations “could just have some legend down the side or some
explanatory notes linked to the edges” to explain the meaning of the connections. Alternatively teachers requested
more contextual information regarding what was happening during a particular period of time, for example,
when critical clinical procedures were occurring, or focused the analysis pf differentiated spatial behaviours
according to the specific roles enacted by students such as the team leader.
6 DISCUSSION
Revisiting the research questions (Section 4.3), we can summarise the teachers’ interviews as follows: (RQ1)
teachers could interpret strong and weak connections in individual teams, and were able to characterise and
assess spatial behaviours in relation to learning outcomes such as effective patient-care and team autonomy. The
teams difference diagram was considered helpful, and reinforced their initial interpretations; (RQ2) teachers
envisaged the use of ENA diagrams to identify teams’ spatial behaviours, interrogate their own practice and to
support interventions; (RQ3) teachers requested additional contextual details regarding tasks and roles to assist
ENA interpretation, and proposed both node fusion to hide unnecessary distinctions, and node fission to bring
out important distinctions that were masked.
Reflecting on these findings, several points merit discussion. Learning to read ENA requires the ability to first
decode the visual language, before being able to interpret it. We found that four of the five teachers, following a
few minutes’ guided walkthrough from the researcher, could decode the language, and could construct consistent
narratives about what it signified in terms of student and teacher behaviour. It was noticeable that after the initial
strangeness of the first exposure to an ENA diagram, narrative interpretations flowed much more quickly from
the teachers when they moved onto the Team 3 diagram.
We did find that using ENA to visualize spatial behaviours introduced additional complexities not found when
modelling non-spatial activity. One teacher found it very confusing and could not give any interpretations of it.
Several teachers needed ongoing reminders that node positions were independent of floorplan position. One
teacher thought the ENA seemed upside-down, since the medical room was at the bottom. Another teacher
appeared to interpret an edge that passed close to a node as meaning students were literally close to that location.
ENA’s quadrants added visual noise, but no meaning to the teachers. Everyone found it incongruous that the ENA
node for the manikin patient was positioned a long way from the human role-playing the patient’s voice, when
conceptually they are the same thing, and physically adjacent in the room (in fact, they wanted them merged).
However, the four teachers who engaged with ENA were not confused by the fact the nodes in the diagrams
represented both spaces of interest and activities (requesting/receiving help). Thus, depending on which nodes
, Vol. 1, No. 1, Article . Publication date: January 2021.Modelling Spatial Behaviours in Clinical Team Simulations using Epistemic Network Analysis: Methodology and Teacher Evaluation • 13
were being connected, edges could represent transitions between two spaces, or the space in which an activity
occurred. They found it very natural to interpret (for instance) Team 1 received help at the bed footer.
The key insight from this initial trial is that most of the teachers could learn to read ENA, but not all aspects
were intuitive, especially since it describes spatial behaviour. ENA excelled visually in showing at a glance
the most salient nodes and transitions, and enabling team comparison. Noting that making sense of nodes’
relative positioning is challenging for researchers who understand the underlying algorithm, we made no attempt
to explain this to the teachers, since this was deemed irrelevant. However, the disconnection between ENA
positioning and the floorplan is strange, and leads us to reflect on whether teachers should be exposed to ENA
directly.
We propose that much of the valuable information in ENA diagrams can be decoupled from the particular
network visualisation generated by the current tool. ENA can be used to enrich other spatial visualisations, that
make more sense to educators and students, such as the familiar floorplan of the simulation ward. Our thinking,
therefore, has returned to the kind of visualisation developed by Echeverria et al. [11] (Figure 2), but annotated
with the information from the spaces of interest-based ENA modelling that teachers gave such positive feedback
on. Figure 6 shows an interface mockup, in which ENA edge size is translated into edges overlayed directly onto
a floorplan, ENA node size is translated into colour saturation to create a heatmap, which at a glance shows
which spaces of interest were most frequently occupied, and asking/receiving help nodes are translated into
differentiated icons of different sizes in the relevant location. Clearly, modelling could include other weighted
activity-based icons, and their weighted interconnections, with controls to view/hide different layers. This
map still facilitates comparisons between teams, but is, we suggest, much more intuitive than ENA’s abstract
representations, designing out the possibility of the interpretive confusions that the teachers showed.
7 CONCLUSIONS
This paper makes two contributions, one methodological, and the other, a learning analytics infrastructure for an
authentic educational challenge (improving feedback in clinical team simulations). Methodologically, we have
documented the use of Epistemic Network Analysis (ENA) to model and visualize nurses’ positioning during
clinical simulations, by coding the contextual meanings that different spaces of interest take on. To our knowledge,
this is the first application of ENA to the analysis of spatial activity. It has enabled analysis within teams, and
comparison across teams. Given the importance of face-to-face activity in diverse educational settings, this is a
valuable step. This also demonstrates the value of Quantitative Ethnography for learning analytics, in which a
qualitative understanding of the meanings that spaces and locations take on is critical, in order to quantitatively
model low-level sensor data from a complex activity, in a manner that respects how stakeholders understand this
activity.
Secondly, we are conducting this work in order to provide new insights to improve the value of clinical
teamwork simulations. We have documented preliminary evidence that Nursing academics could make sense
of the ENA diagrams, seeing them as provocations to productive reflection and discussion among themselves
as teachers, and for use with nursing students. After a few minutes’ orientation from the learning analytics
researcher, most could read the diagrams (i.e. were able to construct appropriate narratives about what the
ENA signified about performance within a team, and team differences). However, we have also documented the
complexities that an abstract spatial map such as this introduces when describing spatial behaviours. This led us
to reflect on how the strengths of ENA as a conceptual representation, which received strong validation, can be
preserved but more intuitively visualized, through ENA annotation of a map of the space where the teaching and
learning activity takes place.
Future work will involve further design iterations to evaluate the proposed visualisation with teachers, and
once they have validated it, to introduce it to students. The focus in this paper has been on ENA modelling
, Vol. 1, No. 1, Article . Publication date: January 2021.14 • Gloria Milena Fernandez-Nieto, Roberto Martinez-Maldonado, Kirsty Kitto, and Simon Buckingham Shum
Fig. 6. Design concept for visual feedback to educators and students. A map of the simulation ward is overlaid with
annotations from the ENA modelling, translating node/edge weights into a heatmap, movement trajectories, and icons for
different activities (e.g. circle or triangle).
of spatial behaviours, but data from other kinds of sensors can clearly be added (e.g. speech-to-text; use of
equipment), in combination with more conventional kinds of conceptual activity codes for which ENA was
originally developed. These could in turn, of course, make the visualisations more complex, leading to further
design iterations.
In conclusion, this research program seeks to develop a learning analytics infrastructure that not only has
representational integrity (the model is expressive enough to reflect important conceptual distinctions in the
real world), but also communicative integrity — enabling the sensemaking needed to close the feedback loop not
only to researchers, but to educators, and ultimately, to students. This paper’s contributions have advanced our
understanding of how to address these dual concerns.
8 ACKNOWLEDGMENTS
Gloria Fernandez Nieto gratefully acknowledges the University of Technology Sydney for PhD Scholarship
support. Roberto Martinez-Maldonado’s research is partly funded by Jacobs Foundation.
REFERENCES
[1] Karan Ahuja, Dohyun Kim, Franceska Xhakaj, Virag Varga, Anne Xie, Stanley Zhang, Jay Townsend, Chris Harrison, Amy Ogan, and
Yuvraj Agarwal. EduSense: Practical Classroom Sensing at Scale. Proceedings of the ACM on Interactive, Mobile, Wearable and Ubiquitous
Technologies, 3(3):1–26, Sep 2019. doi: https://doi.org/10.1145/3351229.
[2] Pengcheng An, Saskia Bakker, Sara Ordanovski, Ruurd Taconis, and Berry Eggen. ClassBeacons: Designing Distributed Visualization
of Teachers’ Physical Proximity in the Classroom. In Proceedings of the Twelfth International Conference on Tangible, Embedded, and
, Vol. 1, No. 1, Article . Publication date: January 2021.Modelling Spatial Behaviours in Clinical Team Simulations using Epistemic Network Analysis: Methodology and Teacher Evaluation • 15
Embodied Interaction, pages 357–367, New York, NY, USA, Mar 2018. ACM. doi: https://doi.org/10.1145/3173225.3173243.
[3] Sean Andrist, Wesley Collier, Michael Gleicher, Bilge Mutlu, and David W. Shaffer. Look together: analyzing gaze coordination with
epistemic network analysis. Frontiers in Psychology, 6:1016, Jul 2015. ISSN 1664-1078. doi: https://dx.doi.org/10.3389.
[4] Liz Berragan. Simulation: An effective pedagogical approach for nursing? Nurse Education Today, 31(7):660–663, 2011. ISSN 02606917.
doi: https://doi.org/10.1016/j.nedt.2011.01.019.
[5] Virginia Braun and Victoria Clarke. Using thematic analysis in psychology. Qualitative Research in Psychology, 3(2):77–101, Jan 2006.
ISSN 1478-0887. doi: https://doi.org/10.1191/1478088706qp063oa.
[6] Simon Buckingham Shum, Vanessa Echeverria, and Roberto Martinez-Maldonado. The multimodal matrix as a quantitative ethnography
methodology. In International Conference on Quantitative Ethnography, pages 26–40. Springer, 2019. doi: https://doi.org/10.1007/978-3-
030-33232-7_3.
[7] Adam Cheng, Walter Eppich, Taylor Sawyer, and Vincent Grant. Debriefing: the state of the art and science in healthcare simulation.
Healthcare simulation education: evidence, theory and practice. Chichester: Wiley, pages 158–64, 2018. doi: https://doi.org/10.1002/
9781119061656.ch21.
[8] Edwin Chng, Mohamed Seyam, William Yao, and Bertrand Schneider. Using Motion Sensors to Understand Collaborative Interactions in
Digital Fabrication Labs. In International Conference on Artificial Intelligence in Education, pages 118–128. Springer, Cham, Jul 2020. doi:
https://doi.org/10.1007/978-3-030-52237-7_10.
[9] W. Collier. Application of ena-based network analyses to fmri data on school-children’s acquisition of number symbols. In Discovery
Challenge Research Symposium, Madison, Wisconsin, USA, 2015. Wisconsin Institutes for Discovery.
[10] Andras Csanadi, Brendan Eagan, Ingo Kollar, David Williamson Shaffer, and Frank Fischer. When coding-and-counting is not enough:
using epistemic network analysis (ENA) to analyze verbal data in CSCL research. International Journal of Computer-Supported
Collaborative Learning, 13(4):419–438, Dec 2018. doi: https://doi.org/10.1007/s11412-018-9292-z.
[11] Vanessa Echeverria, Roberto Martinez-Maldonado, Tamara Power, Carolyn Hayes, and Simon Buckingham Shum. Where is the nurse?
towards automatically visualising meaningful team movement in healthcare education. In Proceedings International Conference on Artificial
Intelligence in Education, pages 74–78, Cham, 2018. Springer International Publishing. doi: https://doi.org/10.1007/978-3-319-93846-2\_14.
[12] Vanessa Echeverria, Roberto Martinez-Maldonado, and Simon Buckingham S. Towards collaboration translucence: Giving meaning
to multimodal group data. In Proceedings of the 2019 CHI Conference on Human Factors in Computing Systems, pages 1–16, 2019. doi:
https://doi.org/10.1145/3290605.3300269.
[13] Máverick Ferreira, Vitor Rolim, Rafael Ferreira Mello, Rafael Dueire Lins, Guanliang Chen, and Dragan Gašević. Towards automatic
content analysis of social presence in transcripts of online discussions. In Proceedings of the Tenth International Conference on Learning
Analytics & Knowledge, pages 141–150, 2020.
[14] Marva Foster, Marie Gilbert, Darlene Hanson, Kathryn Whitcomb, and Crystal Graham. Use of simulation to develop teamwork
skills in prelicensure nursing students: an integrative review. Nurse educator, 44(5):E7–E11, 2019. doi: https://doi.org/10.1097/NNE.
0000000000000616.
[15] Kristin L. Fraser, Michael J. Meguerdichian, Jolene T. Haws, Vincent J. Grant, Komal Bajaj, and Adam Cheng. Cognitive Load Theory
for debriefing simulations: implications for faculty development. Advances in Simulation, 3(1):28, Dec 2018. ISSN 2059-0628. doi:
https://doi.org/10.1186/s41077-018-0086-1.
[16] Janet Gardner. Spatial ability in registered nurses. PhD thesis, University of North Texas, Texas, May 2014.
[17] Dragan Gašević, Srećko Joksimović, Brendan R Eagan, and David Williamson Shaffer. Sens: Network analytics to combine social and
cognitive perspectives of collaborative learning. Computers in Human Behavior, 92:562–577, 2019. doi: https://doi.org/10.1016/j.chb.2018.
07.003.
[18] Edward T. Hall. A system for the notation of proxemic behavior. American Anthropologist, 65(5):1003–1026, 1963. ISSN 15481433.
[19] Marc Hassenzahl and Daniel Ullrich. To do or not to do: Differences in user experience and retrospective judgments depending
on the presence or absence of instrumental goals. Interacting with Computers, 19(4):429–437, Jul 2007. ISSN 0953-5438. doi: https:
//doi.org/10.1016/j.intcom.2007.05.001.
[20] Tiffany Herder, Zachari Swiecki, Simon Fougt, Andreas Tamborg, Benjamin Allsopp, David W. Shaffer, and Morten Misfeldt. Supporting
teachers’ intervention in students’ virtual collaboration using a network based model. In Proceedings of the 8th International Conference
on Learning Analytics and Knowledge, pages 21–25, New York, NY, USA, Mar 2018. ACM. doi: https://doi.org/10.1145/3170358.3170394.
[21] Michaela Kolbe and Margarete Boos. Laborious but elaborate: The benefits of really studying team dynamics. In Frontiers in Psychology,
volume 10, page 1478. Frontiers Media S.A., Jun 2019. doi: https://doi.org/10.3389/fpsyg.2019.01478.
[22] Bette Mariani and Jessica Doolen. Nursing Simulation Research: What Are the Perceived Gaps? Clinical Simulation in Nursing, 12(1):
30–36, 2016. ISSN 18761399. doi: https://doi.org/10.1016/j.ecns.2015.11.004.
[23] Gabriele Marini. Towards indoor localisation analytics for modelling flows of movements. In Adjunct Proceedings of the 2019 ACM
International Joint Conference on Pervasive and Ubiquitous Computing and Proceedings of the 2019 ACM International Symposium on
Wearable Computers, pages 377–382, 2019. doi: https://doi.org/10.1145/3341162.3349306.
, Vol. 1, No. 1, Article . Publication date: January 2021.16 • Gloria Milena Fernandez-Nieto, Roberto Martinez-Maldonado, Kirsty Kitto, and Simon Buckingham Shum
[24] Roberto Martinez-Maldonado. "I Spent More Time with that Team": Making Spatial Pedagogy Visible Using Positioning Sensors. In
Proceedings of the 9th International Conference on Learning Analytics & Knowledge - LAK19, pages 21–25, New York, New York, USA,
2019. ACM Press. doi: https://doi.org/10.1145/3303772.3303818.
[25] Roberto Martinez-Maldonado, Vanessa Echeverria, Jurgen Schulte, Antonette Shibani, Katerina Mangaroska, and Simon Buckingham S.
Moodoo: Indoor Positioning Analytics for Characterising Classroom Teaching. In International Conference on Artificial Intelligence in
Education, pages 360–373. Springer, Cham, Jul 2020. doi: https://doi.org/10.1007/978-3-030-52237-7_29.
[26] Nora Mcdonald, Sarita Schoenebeck, and Nora McDonald. Reliability and Inter-rater Reliability in Qualitative Research: Norms and
Guidelines for CSCW and HCI Practice. Proc. ACM Hum.-Comput, 1:Article 39:23, 2019. doi: https://doi.org/10.1145/3359174.
[27] Jane Moore, Dawn Prentice, and Maurene McQuestion. Social Interaction and Collaboration among Oncology Nurses. Nursing research
and practice, 2015, 2015. ISSN 2090-1429. doi: https://doi.org/10.1155/2015/248067.
[28] Jakob Nielsen and Thomas K. Landauer. A mathematical model of the finding of usability problems. In Proceedings of the SIGCHI
conference on Human factors in computing systems - CHI ’93, pages 206–213, New York, New York, USA, 1993. ACM Press. ISBN
0897915755. doi: 10.1145/169059.169166. URL http://portal.acm.org/citation.cfm?doid=169059.169166.
[29] Pam Pointon and Ruth Kershner. Making decisions about organising the primary classroom environment as a context for learning: the
views of three experienced teachers and their pupils. Teaching and Teacher Education, 16(1):117–127, Jan 2000. ISSN 0742-051X. doi:
https://doi.org/10.1016/S0742-051X(99)00043-8.
[30] Luis P. Prieto, Kshitij Sharma, Pierre Dillenbourg, and María Jesús. Teaching analytics: Towards automatic extraction of orchestration
graphs using wearable sensors. In Proceedings of the Sixth International Conference on Learning Analytics &; Knowledge, LAK ’16, page
148–157, New York, NY, USA, 2016. Association for Computing Machinery. doi: https://doi.org/10.1145/2883851.2883927.
[31] Mikael Rask and David Brunt. Verbal and social interactions in the nurse-patient relationship in forensic psychiatric nursing care:
a model and its philosophical and theoretical foundation. Nursing inquiry, 14(2):169–76, Jun 2007. ISSN 1320-7881. doi: https:
//doi.org/10.1111/j.1440-1800.2007.00364.x.
[32] Vitor Rolim, Rafael Ferreira Leite De Mello, Vitomir Kovanovic, and Dragan Gaševic. Analysing social presence in online discussions
through network and text analytics. In 2019 IEEE 19th International Conference on Advanced Learning Technologies (ICALT), volume 2161,
pages 163–167. IEEE, 2019.
[33] Nazmus Saquib, Ayesha Bose, Dwyane George, and Sepandar Kamvar. Sensei: Sensing Educational Interaction. Proceedings of the ACM
on Interactive, Mobile, Wearable and Ubiquitous Technologies, 1(4):1–27, Jan 2018. doi: https://doi.org/10.1145/3161172.
[34] David W. Shaffer. Epistemic frames for epistemic games. Computers & Education, 46(3):223–234, Apr 2006. ISSN 03601315. doi:
https://doi.org/10.1016/j.compedu.2005.11.003. URL https://linkinghub.elsevier.com/retrieve/pii/S0360131505001582.
[35] David W. Shaffer. Quantitative ethnography. Lulu. com, Madison, WI, USA, 2017.
[36] David W. Shaffer and A. Ruis. Epistemic Network Analysis: A Worked Example of Theory-Based Learning Analytics. In Handbook
of Learning Analytics, chapter 15, pages 175–187. Society for Learning Analytics Research (SoLAR), May 2017. doi: https://doi.org/10.
18608/hla17.015.
[37] David W. Shaffer, David Hatfield, Gina N. Svarovsky, Padraig Nash, Aran Nulty, Elizabeth Bagley, Ken Frank, André A Rupp, and Robert
Mislevy. Epistemic network analysis: A prototype for 21st-century assessment of learning. International Journal of Learning and Media,
1(2), 2009. doi: https://doi.org/10.1162/ijlm.2009.0013.
[38] David W. Shaffer, Wesley Collier, and A. Ruis. A Tutorial on Epistemic Network Analysis: Analyzing the Structure of Connections in
Cognitive, Social, and Interaction Data. Journal of Learning Analytics, 3(3):9–45, 2016. ISSN EISSN-1929-7750. doi: https://doi.org/10.
18608/jla.2016.33.3.
[39] Hanall Sung, Shengyang Cao, Andrew R Ruis, and David Williamson Shaffer. Reading for Breadth, Reading for Depth: Understanding
the Relationship Between Reading and Complex Thinking Using Epistemic Network Analysis. International Conference on Computer
Supported Collaborative Learning, Jun 2019. doi: https://doi.dx.org/10.22318/cscl2019.376.
[40] Zachari Swiecki and David Williamson Shaffer. iSENS: an integrated approach to combining epistemic and social network analyses. In
Proceedings of the Tenth International Conference on Learning Analytics & Knowledge, pages 305–313, New York, NY, USA, Mar 2020.
ACM. doi: https://doi.org/10.1145/3375462.3375505.
[41] Zachari Swiecki and David Williamson Shaffer. isens: an integrated approach to combining epistemic and social network analyses. In
Proceedings of the Tenth International Conference on Learning Analytics & Knowledge, pages 305–313, 2020.
[42] Abigail Wooldridge, Pascale Carayon, David W. Shaffer, and Brendan Eagan. Quantifying the qualitative with epistemic network
analysis: A human factors case study of task-allocation communication in a primary care team. IISE Transactions on Healthcare Systems
Engineering, 8(1):72–82, Jan 2018. ISSN 24725587. doi: https://doi.org/10.1080/24725579.2017.1418769.
[43] Marcelo Worsley. Multimodal Learning Analytics’ Past, Present, and, Potential Futures. In 2nd Multimodal Learning Analytics Across
(Physical and Digital) Spaces, CrossMMLA 2018, pages 1–16, Mar 2018.
[44] Zhan Zhang and Aleksandra Sarcevic. Constructing Awareness Through Speech, Gesture, Gaze and Movement During a Time-Critical
Medical Task. In ECSCW 2015: Proceedings of the 14th European Conference on Computer Supported Cooperative Work, 19-23 September
2015, Oslo, Norway, pages 163–182. Springer International Publishing, Cham, 2015. doi: https://doi.org/10.1007/978-3-319-20499-4_9.
, Vol. 1, No. 1, Article . Publication date: January 2021.You can also read