Convergent evidence for the pervasive but limited contribution of biomass burning to atmospheric ammonia in peninsular Southeast Asia
←
→
Page content transcription
If your browser does not render page correctly, please read the page content below

Atmos. Chem. Phys., 21, 7187–7198, 2021
https://doi.org/10.5194/acp-21-7187-2021
© Author(s) 2021. This work is distributed under
the Creative Commons Attribution 4.0 License.

Convergent evidence for the pervasive but limited
contribution of biomass burning to atmospheric
ammonia in peninsular Southeast Asia
Yunhua Chang1 , Yan-Lin Zhang1 , Sawaeng Kawichai2 , Qian Wang1 , Martin Van Damme3 , Lieven Clarisse3 ,
Tippawan Prapamontol2 , and Moritz F. Lehmann4
1 KLME & CIC-FEMD,        Yale-NUIST Center on Atmospheric Environment, Nanjing University of Information
Science & Technology, Nanjing 210044, China
2 Research Institute for Health Sciences (RIHES), Chiang Mai University, Chiang Mai 50200, Thailand
3 Université libre de Bruxelles (ULB), Spectroscopy, Quantum Chemistry and Atmospheric Remote Sensing (SQUARES),

Brussels 1050, Belgium
4 Department of Environmental Sciences, University of Basel, Basel 4056, Switzerland

Correspondence: Yan-Lin Zhang (dryanlinzhang@outlook.com)

Received: 9 October 2020 – Discussion started: 11 January 2021
Revised: 29 March 2021 – Accepted: 8 April 2021 – Published: 11 May 2021

Abstract. Ammonia (NH3 ) is an important agent involved         plications for future modeling studies to better constrain the
in atmospheric chemistry and nitrogen cycling. Current es-      climate and air quality effects of wildfires.
timates of NH3 emissions from biomass burning (BB) dif-
fer by more than a factor of 2, impeding a reliable assess-
ment of their environmental consequences. Combining high-
resolution satellite observations of NH3 columns with net-      1   Introduction
work measurements of the concentration and stable nitrogen
isotope composition (δ 15 N) of NH3 , we present coherent es-   Biomass burning (BB) in tropical vegetation regions due to
timates of the amount of NH3 derived from BB in the heart-      wildfires has been recognized as a globally important source
land of Southeast Asia, a tropical monsoon environment. Our     of trace gases (including CO2 , CO and ozone precursors) and
results reveal a strong variability in atmospheric NH3 lev-     aerosols (mostly black and organic carbon) (Crutzen and An-
els in time and space across different landscapes. All of the   dreae, 1990; Andreae and Merlet, 2001; Shi et al., 2015; An-
evidence on hand suggests that anthropogenic activities are     dreae, 2019; Crutzen et al., 1979). Most BB hot spots occur
the most important modulating control with respect to the       in West Africa and South America (Crutzen and Andreae,
observed patterns of NH3 distribution in the study area. N-     1990; van der Werf et al., 2006; Shi et al., 2015), but re-
isotope balance considerations revealed that during the in-     cent studies have also highlighted the importance of South-
tensive fire period, the atmospheric input from BB accounts     east (SE) Asia in this regard, mainly because of the much
for no more than 21 ± 5 % (1σ ) of the ambient NH3 , even       higher population densities near intensive fire burning areas
at the rural sites and in the proximity of burning areas. Our   (Huang et al., 2013; Marlier et al., 2013; Lee et al., 2017;
N-isotope-based assessment of the variation in the relative     Betha et al., 2014). The climate over large parts of SE Asia
contribution of BB-derived NH3 is further validated indepen-    is governed by a wet (typically May–July) and dry (typically
dently through the measurements of particulate K+ , a chem-     February–April) season caused by seasonal shifts in the mon-
ical tracer of BB. Our findings underscore that BB-induced      soon winds. During the dry season, dry plant materials (e.g.,
NH3 emissions in tropical monsoon environments can be           forest, peatland, banana leaf) readily ignite, resulting in large
much lower than previously anticipated, with important im-      wildfires that can markedly modify the atmospheric compo-
                                                                sition in the tropics, whereas the tropical rain belt causes

Published by Copernicus Publications on behalf of the European Geosciences Union.
7188                     Y. Chang et al.: Pervasive but limited contribution of biomass burning to atmospheric ammonia

plentiful rainfall during summer, preventing such fires dur-        tration and composition of aerosols in SE Asia (Betha et
ing the rainy season (Lee et al., 2017; Chu et al., 2018).          al., 2014; Aouizerats et al., 2015; Lee et al., 2017; Bikkina
   Besides carbon soot, BB also emits large amounts of re-          et al., 2019). However, to our knowledge, there are no re-
active nitrogen compounds (Lobert et al., 1990; Bauters et          ports on the detailed spatiotemporal patterns of the atmo-
al., 2018), in particular ammonia (NH3 ), which is believed         spheric NH3 concentration and nitrogen isotopic composi-
to represent the major source of NH3 during intensive fire          tion (δ 15 N–NH3 ) associated with BB in this region. Due to
periods (Akagi et al., 2011; Whitburn et al., 2015). However,       isotopic fractionation associated with NH3 production, pyro-
these emissions are subject to large uncertainties (differences     genic NH3 displays a distinctly higher δ 15 N–NH3 (δ 15 N de-
of a factor of 2 or greater) (Bray et al., 2018; Whitburn et al.,   fined as (Rsample /Rstandard − 1) × 1000, where R refers to the
2015, 2016b; Van Damme et al., 2015b) For example, BB is            15 N/14 N ratio in a sample or a standard) than temperature-

probably the second most important NH3 source after agri-           dependent volatilized sources (Felix et al., 2013; Chang et
culture, contributing 11 %–23 % of the global burden (Paulot        al., 2016a). The N isotopic analysis of ambient NH3 has
et al., 2017; Bouwman et al., 1997). Minor NH3 sources              been proven to be a useful tool to constrain sources of NH3
include fossil fuel burning and biogenic activity (Chang et         emissions in the atmosphere, where both natural and anthro-
al., 2012, 2016b, 2019b, 2020). A recent paper also high-           pogenic activities are relevant (Chang et al., 2019a, b; El-
lighted the underestimated importance of industrial emis-           liott et al., 2019). Here, we integrate high-resolution satel-
sions (Van Damme et al., 2018). Once emitted in the atmo-           lite observations with discrete NH3 concentration measure-
sphere, NH3 is rapidly removed by dry or wet deposition (As-        ments and δ 15 N–NH3 data obtained from a regional passive
man et al., 1998). Excess NH3 is known to be responsible            monitoring network during and after the dry season of large-
for several environmental issues: eutrophication of terrestrial     scale forest fires in the mountain areas of northern Thailand,
and aquatic ecosystem, soil acidification, and loss of plant        SE Asia.
diversity (Sutton et al., 2008, 2011; Aneja et al., 2008). In
the atmosphere, NH3 can neutralize acid gases (mostly sul-
furic acid, nitric acid or hydrochloric acid), resulting in the     2     Methods
formation of secondary aerosols that in turn negatively affect
                                                                    2.1    Site description
climate and human health (Wang et al., 2011, 2013; Paulot
and Jacob, 2014; Souri et al., 2017).                               Surrounded by the mountain ranges of the northern Thai-
   To assess the environmental impacts of BB (e.g., air qual-       land highlands, the Chiang Mai Province covers an area of
ity and climate change), atmospheric chemistry models in-           approximately 20 107 km2 , with a total population of over
corporating BB-related emissions have widely been used              1.7 million. Chiang Mai is characterized by a tropical mon-
over the past decades (Huang et al., 2013; Aouizerats et            soon climate, tempered by the low latitude and moderate el-
al., 2015; Wang et al., 2011, 2013; Souri et al., 2017), but        evation, with warm to hot weather year-round. Some 70 % of
these models are afflicted with a relatively large uncertainty      the area is covered by forests, and 13.4 % of the area is used
regarding the input parameters used (Hantson et al., 2016;          for agriculture. A continuing environmental issue in Chiang
Whitburn et al., 2015; Paulot et al., 2017). The uncertain-         Mai is smoke pollution from wildfires that primarily occur
ties, for example, for carbon emissions and for other trace         every year towards the end of the dry season between Febru-
gases (including NH3 ), can be over 200 % (Whitburn et al.,         ary and April (Tsai et al., 2013) before the relatively cool and
2015; Paulot et al., 2017; Zhu et al., 2013; Pan et al., 2020).     rainy season from May on. During the period from March
In recent years, hyperspectral sounders on board satellites         to July 2018, ambient NH3 concentrations and δ 15 N–NH3
have demonstrated their capabilities to directly measure tro-       values were determined at nine monitoring stations across
pospheric column concentrations of NH3 gas (Van Damme               the Chiang Mai Province. Figure 1 illustrates the location
et al., 2014, 2015b, 2018; Clarisse et al., 2009). There-           of sampling sites (with the different land use regimes indi-
fore, satellite observations offer a “top-down” alternative to      cated), Fig. S1 in the Supplement reports meteorological data
the bottom-up estimates. However, the biggest challenge of          for Chiang Mai and Table S1 in the Supplement details the
satellite-based NH3 assessments is the requirement for the          information of each station.
atmosphere to be cloud-free during observations as well as
the need for a sizable temperature difference between the           2.2    Sampling and laboratory analysis
land or sea surface and the atmosphere (Van Damme et al.,
2015a; Whitburn et al., 2015; Martin, 2008; Streets et al.,         In order to obtain information regarding the spatial and tem-
2013; Clarisse et al., 2010).                                       poral variability in NH3 concentrations over Chiang Mai,
   Large uncertainties remain regarding global or regional          ambient gas-phase NH3 concentrations at each site were col-
atmospheric budgets of NH3 , and the attribution of emis-           lected weekly using passive sampling devices (PSDs; AL-
sions to specific sources, emphasizing the need for inde-           PHA – Adapted Low-cost, Passive High Absorption; Cen-
pendent verification methods. An impressive body of pre-            tre for Ecology and Hydrology, Edinburgh, UK) (Chang et
vious work has studied the BB influence on the concen-              al., 2016a). The ALPHA PSD is a circular polyethylene

Atmos. Chem. Phys., 21, 7187–7198, 2021                                               https://doi.org/10.5194/acp-21-7187-2021
Y. Chang et al.: Pervasive but limited contribution of biomass burning to atmospheric ammonia                                        7189

Figure 1. Location of sampling sites: a land cover map (left; revised from Chang et al., 2016b) of the area, and zoomed in sections (right)
showing the sampling sites. The chosen sampling sites are representative of a gradient in land use from urban to rural. The images on the
right were obtained from © Google Maps.

vial (26 mm height, 27 mm diameter) with one open end.                  ples (Liu et al., 2014). The analytical precision for N isotope
The vial holds a 25 mm phosphorous acid-impregnated filter              analyses was better than 0.5 ‰ (n = 5).
and a polytetrafluoroethylene (PTFE) membrane for gaseous
NH3 diffusion. These PSDs have been widely used in Eu-
                                                                        2.3   Isotope-based source apportionment
rope, China and the US, and they are capable of detect-
ing NH3 concentrations as low as 0.03 µg m−3 (Chang et
al., 2016a; Puchalski et al., 2011; Liu et al., 2013; Tang              Isotopic mixing models represent valuable tools to estimate
et al., 2018). In the laboratory, the ALPHA filter samples              the fractional contributions of multiple sources (emission
were soaked in 10 mL deionized water (18 M cm−1 ) in a                 sources of NH3 in this study) within a mixture (the ambient
15 mL vial for 30 min with occasional shaking. Concentra-               NH3 in this study) (Layman et al., 2012). By explicitly con-
tions of NH3 -derived NH+  4 in extracts were determined us-
                                                                        sidering the uncertainties associated with the isotopic signa-
ing a DionexTM ICS-5000+ system (Thermo Fisher Scien-                   tures of single sources and the N isotope fractionation during
tific, Sunnyvale, USA). The IC (ion chromatograph) system               transformations, the application of Bayesian methods to sta-
was equipped with an automated sampler (AS-DV), an Ion-                 ble isotope mixing models yields robust probability estimates
Pac CG12A guard column and a CS12A separation column.                   of source apportionments, and its application to natural sys-
Aqueous methanesulfonic acid (MSA, 30 mM L−1 ) served                   tems is more appropriate than the application of simple linear
as eluent at a flow rate of 1 mL min−1 . The isotopic analy-            mixing models (Parnell et al., 2010). Here, a novel Bayesian
sis of the extracted NH+ 4 was based on the isotopic analy-
                                                                        approach using a mixing model, implemented in the SIAR
sis of nitrous oxides (N2 O) after chemical conversion (Liu et          (Stable Isotope Analysis in R) software package, was used to
al., 2014). More precisely, dissolved NH+ 4 in deionized wa-
                                                                        resolve multiple NH3 source categories by generating poten-
ter (DIW) extracts was oxidized to NO−   2 by alkaline hypo-
                                                                        tial solutions of source apportionment as true probability dis-
bromite (BrO− ) and then reduced to N2 O by hydroxylamine               tributions of the single source contribution to the total NH3
hydrochloride (NH2 OH · HCl). The produced N2 O was ana-                pool. The generation of such source contribution probability
lyzed using a purge and cryogenic trap system (Gilson GX-               distributions allows for the estimation of likelihood ranges
271, IsoPrime Ltd., Cheadle Hulme, UK) coupled to an iso-               of source contributions even under under-constrained condi-
tope ratio mass spectrometer (PT-IRMS; IsoPrime 100, Iso-               tions (i.e., the number of potential sources exceeds the num-
Prime Ltd., Cheadle Hulme, UK) (Liu et al., 2014). In or-               ber of different isotope system parameters + 1). The SIAR
der to correct for any machine drift and procedural blank               package is available for download from the packages sec-
contribution, international NH+  4 (IAEA N1, USGS 25 and
                                                                        tion of the Comprehensive R Archive Network site (CRAN;
USGS 26) standards were processed in the same way as sam-               http://cran.r-project.org/, last access: 10 May 2021), which
                                                                        has been widely applied in a number of fields (Chang et al.,

https://doi.org/10.5194/acp-21-7187-2021                                                  Atmos. Chem. Phys., 21, 7187–7198, 2021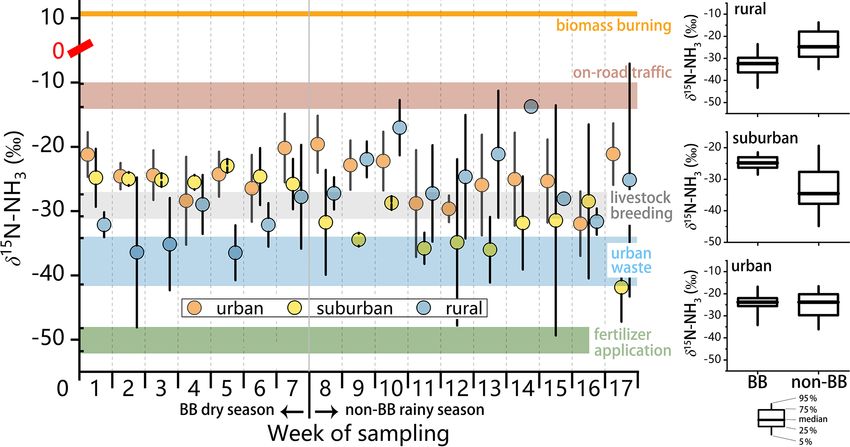
7190                     Y. Chang et al.: Pervasive but limited contribution of biomass burning to atmospheric ammonia

2019a, b). The model frame and computing methods are de-             Given that the average monthly temperature varies only
tailed in Sect. S1 in the Supplement.                             slightly in contrast to the drastic change in rainfall during
                                                                  our study period (Fig. 2c), it is reasonable to assume that
2.4    Satellite observations of ammonia and fires                temperature-dependent NH3 volatilization is not the main
                                                                  driver of changes in the NH3 columns. The amount of rain-
NH3 total columns (molec. cm−2 ) are retrieved from the In-       fall, in contrast, can have a multifaceted impact on NH3 emis-
frared Atmospheric Sounding Interferometer (IASI) observa-        sions. Firstly, there is an obvious link between precipitation
tions. The IASI instruments are on board the MetOp satel-         rates and the number of wildfires, and, if BB is a major NH3
lite series; in this work, we use IASI/MetOp-A (launched          emission source, we can also expect a relationship between
in 2006) and IASI/MetOp-B (launched in 2012) data. Both           the NH3 columns and monthly rainfall rates. Secondly, and
instruments have an overpass time of around 09:30 and             maybe more importantly, rain will dissolve atmospheric par-
21:30 LST (local solar time when crossing the Equator) and,       ticulate NH+ 4 and will act to clean the air of NH3 , which may
therefore, provide in total a global coverage four times a day.   partly explain the low NH3 levels during May and June. On
The retrieval strategy, based on artificial neural networks,      the other hand, comparison between March and April reveals
is fully detailed in previous work (Whitburn et al., 2016a;       higher NH3 levels in April despite higher rain rates, suggest-
Van Damme et al., 2017). Here, we only consider morning           ing that processes other than BB and rain-scavenging of BB-
observations, as they are more sensitive to the lower layer of    derived NH3 must be relevant factors. In Fig. 3a and b, we su-
the atmosphere. Fire radiative power (FRP) from the Mod-          perimposed the orography at the scale of the study area (Chi-
erate Resolution Imaging Spectroradiometer (MODIS) and            ang Mai and surrounding mountains) onto the images of the
fire counts derived from the 375 m Visible Infrared Imaging       year-long averaged MODIS FRP (fire radiative power) and
Radiometer Suite (VIIRS) are also used (Li et al., 2020).         IASI-NH3 for 2018, respectively. Based on visual evaluation
                                                                  alone, it seems obvious that there is no strong correlation be-
3     Results and discussion                                      tween fire intensity/number of fires and the observed IASI-
                                                                  NH3 , suggesting only limited influence of BB on NH3 . How-
3.1    Satellite-observed NH3 distributions                       ever, more strikingly, the IASI-NH3 distribution matches that
                                                                  of the population density quite well (Fig. 3c). More precisely,
Figure 2a illustrates the monthly spatial distribution of NH3     hot spots of atmospheric NH3 (Fig. 3b) appear to be con-
columns obtained from IASI in 2018 at a spatial resolution        centrated in urban areas with a dense population. Hence, our
of 0.25◦ × 0.5◦ cells. Our study area is set within a large do-   satellite remote sensing observations suggest a significant in-
main of 5.00◦ × 3.25◦ (red and black rectangles in Fig. 2a        fluence of non-BB emissions on NH3 concentrations, seem-
and b, respectively), in which a total of 260 gridded pix-        ingly related to urban anthropogenic activities.
els (0.25◦ × 0.25◦ per cell) are used for dividing active fire
points (Fig. 2b). Intriguingly, from this plot, one is tempted    3.2   Discrete concentration measurements confirm
to conclude that fires do play a very important role in NH3             urban areas as hot spots of NH3 emissions
emissions, as the NH3 columns are much higher in March
and April (dry season), which is coincident with a high num-      A total of more than 150 samples were collected in this
ber of monthly fire activities (indicated by the number of fire   study for analyzing NH3 concentrations (Fig. 4). The atmo-
points). Further, using 11 years (2008–2018) of IASI satel-       spheric NH3 concentrations over Chiang Mai ranged from
lite data, Fig. S2 presents a climatology of monthly NH3          2.5 to 46.4 µg m−3 , with mean (±1σ ) and median values
columns over Chiang Mai at a much finer spatial resolu-           of 14.5 (±9.2) and 11.4 µg m−3 , respectively. Consistent
tion, which also support the pervasive contribution of BB         with the IASI satellite-based NH3 assessment, the weighted
during dry season (March and April). Based on the average         average NH3 concentration (meanmax min ± 1σ ) during the dry
observed temporal distribution of satellite-constrained wild-     season (i.e., when wildfires were markedly more abundant)
fires, the sampling period in this study can be divided into      was significantly (p < 0.01) higher (20.646.4            −3
                                                                                                            6.8 ± 9.8 µg m )
                                                                                                    31.9           −3
two contrasting fire-regime periods: the BB season (March         than during the rainy season (10.22.5 ± 5.7 µg m ). Again,
and April) and the non-BB season (May and June). Interest-        it is tempting to conclude that there is a direct link be-
ingly, however, although the number of fire points in March       tween higher atmospheric NH3 levels and the higher num-
(43 613 points) is significantly (p < 0.01) higher than that in   ber of BB events. However, there are several aspects that
April (27 905 points) (Fig. 2b), the average NH3 column in        appear to speak against BB as the main, or only, driver of
March is nearly the same as that in April (Fig. 2a). This im-     ambient NH3 concentrations. Firstly, from a global perspec-
plies that there is not a one-to-one relationship between BB      tive, the ambient NH3 concentrations that we measured in
and NH3 emissions and, in turn, that other sources or factors     northern Thailand are generally lower than in tropical re-
(e.g., soil dryness, agricultural emissions, precipitation and    gions with a dense population or intensive agricultural pro-
temperature dependence) must also play a significant role.        duction (also see Fig. 2a) (Carmichael et al., 2003; Chang
                                                                  et al., 2016b). Secondly, within the study area, large spa-

Atmos. Chem. Phys., 21, 7187–7198, 2021                                            https://doi.org/10.5194/acp-21-7187-2021
Y. Chang et al.: Pervasive but limited contribution of biomass burning to atmospheric ammonia                                         7191

Figure 2. (a) Monthly (March–June) spatial distributions of the NH3 total columns (molec. cm−2 ) in 2018 obtained from satellite measure-
ments by the Infrared Atmospheric Sounding Interferometer (IASI)/MetOp-A instrument in 0.25◦ × 0.5◦ cells. (b) Monthly distributions of
gridded counts of active fire pixels (0.25◦ × 0.25◦ per cell) derived from the 375 m Visible Infrared Imaging Radiometer Suite (VIIRS). The
red and black squares indicate our study area in Chiang Mai. (c) Daily variations in temperature (◦ C) and rainfall (mm) in Chiang Mai city.

tial differences in NH3 concentrations were found (Fig. 4).             ent. Such a concentration gradient can be taken as evidence
Yet, despite their proximity to wildfires at the time, the three        that nonagricultural activities (including on-road traffic), at
rural sites always displayed the lowest NH3 concentrations              least in some regions, can outweigh agriculture and/or BB as
(8.326.8              −3
     2.5 ± 4.6 µg m ; Fig. 4; see detailed discussion in the            the dominant NH3 source in urban areas.
next section).                                                             Indeed, a growing body of studies confirm that the urban
   Despite relatively large uncertainties, it is well accepted          atmosphere can be a hot spot of NH3 release. Nonagricultural
that, globally, atmospheric NH3 is primarily emitted by agri-           activities, such as wastewater treatment, coal combustion,
cultural activities and biomass burning (Asman et al., 1998;            solid garbage handling, vehicular exhaust and urban green
Bouwman et al., 1997). As a consequence, one would ex-                  space contribute strongly to urban to NH3 emissions (Chang
pect the NH3 concentrations in the atmosphere over rural                et al., 2016a, 2015, 2019b; Teng et al., 2017; Li et al., 2016;
environments with lush vegetation and agricultural land use             Sun et al., 2017). For example, high vehicular NH3 emissions
to be higher than those in (sub)urban areas, where agricul-             from three-way catalysts (TWCs) have been demonstrated in
tural activities are mostly absent. In our study, the average           chassis dynamometer vehicle experiments, road tunnel tests
NH3 concentrations at the nine respective sites are 19.539.4 6.5 ±      and through ambient air measurements (Huang et al., 2018;
9.5 µg m−3 (S1; suburban), 11.919.7   4.5 ± 4.6 µg m
                                                      −3 (S2; sub-      Chang et al., 2016b, 2019b).
urban), 8.816.6
            4.4 ± 3.9 µg m
                              −3 (S3; rural), 9.026.8 ± 5.8 µg m−3
                                                 2.8
(S4; rural), 7.013.72.5  ± 3.8  µg m−3 (S5; rural), 20.240.5 9.1 ±      3.3    N isotopic constraints on the sources of natural and
8.6 µg m−3 (S6; urban traffic), 18.146.17.2 ±12.1  µg m −3 (S7; ur-            anthropogenic NH3
ban traffic), 19.646.4
                   4.2 ±10.1 µg m
                                     −3 (S8; urban) and 16.630.6 ±
                                                              6.7
8.0 µg m−3 (S9; urban) (see also compilation in Fig. 4). Thus,          The correlative analysis of the spatiotemporal concentration
against current paradigms, the observed NH3 concentrations              patterns with the variations in land use effects provides the
clearly reflect an urban (18.646.44.2 ± 9.7, n = 68) to suburban
                                                                        first qualitative constraints with respect to the relative impor-
(15.639.4
       4.5 ± 8.3, n  =  34) to rural (8.326.8
                                         2.5 ± 4.6, n = 51) gradi-
                                                                        tance of natural/BB and anthropogenic NH3 emissions, but
                                                                        it is insufficient when a more quantitative assessment is re-

https://doi.org/10.5194/acp-21-7187-2021                                                   Atmos. Chem. Phys., 21, 7187–7198, 2021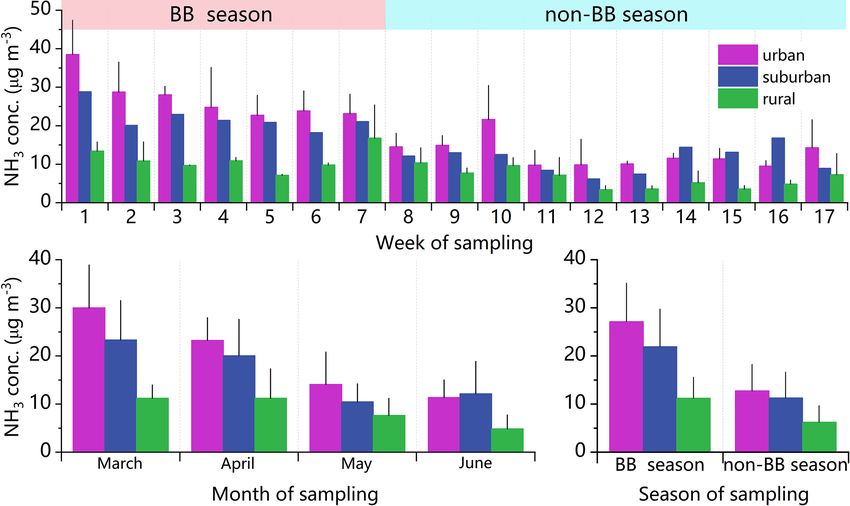
7192                      Y. Chang et al.: Pervasive but limited contribution of biomass burning to atmospheric ammonia

Figure 3. (a) The MODIS FRP (fire radiative power; the size of red dots is proportional to arbitrary FRP values) and (b) the IASI MetOp-A
and MetOp-B averaged NH3 distribution (molec. cm−2 ) for 2018. (c) Number of people per grid cell in the Chiang Mai area in 2018 at a
resolution of 3 arcmin.

Figure 4. Temporal variations in measured NH3 concentrations (µg m−3 ) between sites with different land use regimes. The error bar
indicates 1 standard deviation.

quired. The N-isotopic composition of NH3 (i.e., δ 15 N–NH3 )          emitted from the five major NH3 sources displays distinct
can provide help in this regard, as it is sensitive to changes         isotopic signatures (N-fertilizer application, −50.0 ± 1.8 ‰;
in NH3 sources with distinct isotopic composition (Elliott             urban waste volatilized sources, −37.8 ± 3.6 ‰; livestock
et al., 2019; Felix et al., 2013). δ 15 N–NH3 values deter-            breeding, −29.1 ± 1.7 ‰; on-road traffic, −12.0 ± 1.8 ‰;
mined in this study (−27.04−12.35
                               −46.28 ± 7.22 ‰, n = 145) show          biomass burning, 12 ‰) (see colored bars in Fig. 4) (Chang
a relatively large variability in time and space (Fig. 5). NH3         et al., 2016a; Kawashima and Kurahashi, 2011; Chang and

Atmos. Chem. Phys., 21, 7187–7198, 2021                                                  https://doi.org/10.5194/acp-21-7187-2021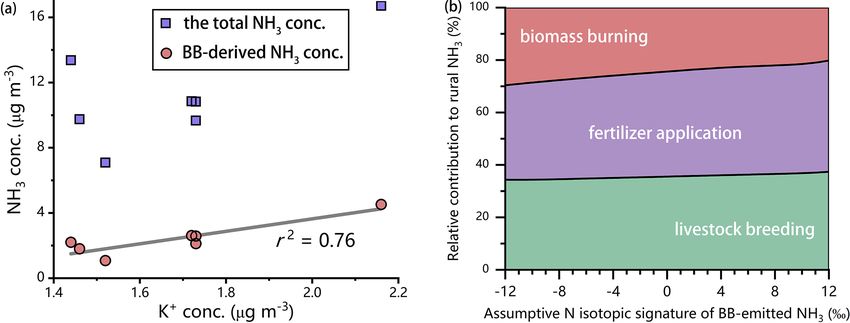
Y. Chang et al.: Pervasive but limited contribution of biomass burning to atmospheric ammonia                                                7193

Figure 5. The left panel shows weekly variations in the δ 15 N values (‰) of ambient NH3 measured in urban, suburban and rural environments
(setting 0 as the breaking point). The error bars indicate 2 standard deviations. The right panels present box plots of the distribution of δ 15 N–
NH3 during the BB season and non-BB season for each type of sampling site.

Ma, 2016). Thus, the measurement of δ 15 N–NH3 can be                       cantly (p < 0.01; one-way analysis of variance and paired-
used to distinguish between specific sources and to quantify                sample t test; similarly hereinafter) higher than that at
their contribution to the measured total NH3 pool. (Note that               the rural (−28.24−12.35
                                                                                                 −46.28 ± 8.22 ‰, n = 43) and suburban
the isotopic signature determined by Kawashima and Kura-                    (−29.94−18.78
                                                                                     −45.62 ±  7.35  ‰, n = 34) sites, respectively, indicat-
hashi (2011) is for particulate NH+ 4 , not NH3 .) As a first step,         ing a greater contribution of NH3 emissions from pyrogenic
we examine the spatiotemporal characteristics of the mea-                   (e.g., on-road traffic) sources. The average value of urban
sured δ 15 N–NH3 relative to the N isotopic source signatures               δ 15 N–NH3 during the dry season (−24.21−14.10 −34.47 ± 4.82 ‰,
to infer seasonal changes in NH3 sources.                                   n = 28) was very similar to the average value observed dur-
   The lowest δ 15 N–NH3 values were observed at the rural                  ing the rainy season (−25.25−15.31−39.44 ± 6.33 ‰, n = 40), af-
sites (S3–S5) during the dry season (−32.72−20.38
                                               −46.28 ± 6.46 ‰,             ter the pronounced decrease in NH3 concentrations due to
n = 21). These δ 15 N values are much lower than the δ 15 N                 wet removal. This rather minor difference can hardly be as-
of BB-related NH3 and indicate the pervasive influence of                   cribed to the influence of BB emissions, given the large
agricultural NH3 emissions in rural environments, rather                    seasonal fluctuation in wildfire intensity mentioned above.
than BB. During the rainy season, a drastic increase in δ 15 N–             Based on the absolute δ 15 N–NH3 values in the urban set-
NH3 (−23.97−12.35
                −37.99 ± 7.50 ‰, n = 22) at the rural sites was             tings, and their rather invariant temporal trends, we argue that
observed. Again, if BB was the dominating modulator of                      vehicle/transport is a more important and apparently steady
NH3 levels, an increased contribution from BB-derived NH3                   source of pyrogenic NH3 in the studied urban areas.
during the dry versus the wet season in rural areas should                     The two suburban sites (S1 and S2) are located ge-
have resulted in higher, not lower, δ 15 N–NH3 values. The                  ographically within the transition zone between the ur-
increased δ 15 N–NH3 during the non-BB (i.e., rainy) period                 ban and rural environments, and this transitional character
can probably be explained by the fact that agricultural NH3                 seems also indicated by their intermediate δ 15 N–NH3 values
emissions with low δ 15 N–NH3 can be dramatically lowered                   (−29.94−18.78
                                                                                     −45.62 ± 7.35 ‰, n = 34). However, interestingly, in
by continuous and heavy rainfall (Zheng et al., 2018; Chang                 comparison to the urban and rural sites, the overall δ 15 N–
et al., 2019a) so that at low levels, local sources can become              NH3 value for the two suburban sites was significantly (p <
more important (e.g., residential kitchens, nearby burning of               0.01) higher during the BB season (−24.84−21.49−28.56 ± 2.29 ‰,
biofuels for cooking).                                                      n = 14) than that during non-BB season (−33.52−18.78    −45.62 ±
   As for the urban sites, the mean δ 15 N–NH3 values at S6–                7.59 ‰, n = 20) (Fig. 5). In fact, among the three different
S9 were −23.95−16.35                           −14.10
                    −34.00 ± 4.61 ‰, −25.53−35.01 ± 6.11 ‰,                 land use regimes, the average δ 15 N–NH3 was highest for the
         −16.86                        −17.13
−24.47−33.08 ± 4.20 ‰and −25.32−39.44 ± 7.75 ‰, respec-                     suburban sites during the BB season, and it was also closer
tively. The overall average δ 15 N–NH3 value at the four                    to the NH3 isotopic signatures of pyrogenic sources during
urban sites (−24.82−14.10
                        −39.44 ± 5.74 ‰, n = 68) was signifi-               this time, raising questions regarding the importance of the

https://doi.org/10.5194/acp-21-7187-2021                                                       Atmos. Chem. Phys., 21, 7187–7198, 2021
7194 Y. Chang et al.: Pervasive but limited contribution of biomass burning to atmospheric ammonia
During the dry season, we also analyzed particulate potas-
sium (K+ ), a chemical tracer of biomass combustion, at two
rural sites (S4, S5; in 39 daily fine-particle (PM2.5 ) samples).
The particulate K+ data offer a valuable opportunity to vali-
date our isotope-based source apportionment results. Again,
we divided the dry-season data set into seven groups based on
the week of NH3 passive sampling. The correlation between
the particulate K+ concentration and the total NH3 concen-
tration at the rural sites was rather poor (r 2 = 0.43; blue sym-
bols in Fig. 7a). Such a weak correlation supports our con-
clusion regarding the isotope-based source apportionment re-
sults (see above), providing additional independent evidence
Figure 6. Source apportionment results of ambient NH3 in rural ar- that BB can hardly be the dominant source of NH3 during
eas during the dry season based on Bayesian isotopic mixing mod- the sampling period at the studied rural areas. In contrast,
eling and the isotopic source signatures. The error bars indicate the correlation between the particulate K+ concentration and
2 standard deviations.
the estimated BB-derived NH3 concentration (instead of to-
tal NH3 ) is much better (r 2 = 0.76; Fig. 7a) and, thus, fur-
contribution of BB versus road traffic in the suburban areas ther validates our modeling approach. While the indepen-
during the BB season. dent particulate K+ data further increase our confidence in
the N-isotope-based assessment, some uncertainty still re-
3.4 Isotope-based quantification of BB contribution to mains with respect to the robustness of the end-member
ambient NH3 source δ 15 N values, potential source-altering effects, and in
turn our estimates of the BB-associated NH3 contribution. In
There are several challenges that need to be overcome other words, the latter is probably sensitive to the considered
when trying to more accurately quantify the contribution range in the δ 15 N of potential NH3 emission sources, and
of BB emissions to ambient NH3 based on N isotope data. this range may be quite large or uncertain for at least some of
Firstly, given the use of only one isotope parameter (δ 15 N; the sources. The δ 15 N–NH3 from BB, in particular, is only
in contrast to NOx where the δ 18 O can also be analyzed), poorly constrained, with hardly any reports from the litera-
more than three potential NH3 sources (e.g., urban and sub- ture (e.g., Kawashima and Kurahashi, 2011). In recent cham-
urban sites) will introduce large uncertainties in isotopic end- ber experiments, we found that the δ 15 N–NH3 produced by
member mixing models in terms of quantifying their rela- the combustion of a variety of biomass types (subtropical
tive contributions to the ambient NH3 (Chang et al., 2015). trees and agricultural residues) ranged between −11.8 ‰ and
Secondly, atmospheric wet scavenging could further compro- −4.6 ‰ (Chang and Ma, 2016, Chang et al., 2019a), which is
mise or alter the primary NH3 N isotopic signatures (Elliott distinctly lower than the N isotopic signature of BB-emitted
et al., 2019; Zheng et al., 2018; Chang et al., 2019a). For NH+ 4 (12 ‰) determined previously (Kawashima and Kura-
these reasons, we focus here on the samples collected at the hashi, 2011) and adopted in this study. Assuming that the true
three rural sites during the dry BB season (lasting 7 weeks) N isotopic signatures of BB-emitted NH3 in the study area
to isotopically examine the contribution of BB emissions to falls somewhere within the range of −12 ‰ to 12 ‰ (based
ambient NH3 . We separated these samples into seven groups on our published data in Chang and Ma, 2016; Chang et
based on the week of their sampling, and we integrated the al., 2019a) and the value reported in Kawashima and Ku-
measured δ 15 N–NH3 values as well as the N isotopic signa- rahashi, 2011), we re-calculated the source apportionment
tures of potential NH3 sources (i.e., biomass burning, live- estimates as function of the different δ 15 N values for BB-
stock breeding, fertilizer application) into the Bayesian iso- emitted NH3 (Fig. 7b). The estimates are not sensitive to the
topic mixing model (see Sect. S1 for details). The results of choice of the N isotopic composition of the BB-associated
NH3 source apportionment are reported in Fig. 6. With a cer- NH3 source. Specifically, independent of the chosen δ 15 N–
tain degree of variability, the contribution of BB to the am- NH3 value, BB is always the least important of the three
bient NH3 in the rural areas during the 7 weeks of sampling main NH3 sources in rural areas, contributing no more than
in the dry season was only 21.0 % (±4.7 %). Hence, NH3 29.6 %. This is because although the isotopic signatures of
emission from BB is significantly less important than from BB-emitted NH3 have a wide range of δ 15 N values, their
livestock breeding (37.1 ± 7.1 %) and fertilizer application δ 15 N–NH3 values are still significantly (p < 0.01) higher
(41.8 ± 5.9 %). This comes as a surprise, given the fact that (i.e., without overlap as shown in Fig. 4) than the measured
the study area belongs to one of the most important BB re- δ 15 N values of ambient NH3 at the rural sites.
gions in SE Asia, or even in the world, and the samples used
for isotopic source apportionment were collected during the
season of intensive BB.
Atmos. Chem. Phys., 21, 7187–7198, 2021 https://doi.org/10.5194/acp-21-7187-2021Y. Chang et al.: Pervasive but limited contribution of biomass burning to atmospheric ammonia 7195
Figure 7. (a) Scatterplots of the aerosol K+ concentrations versus total NH3 concentrations, as well as the NH3 concentrations from BB emis-
sions, at the rural sites during the dry season. (b) Bayesian isotope modeling-based source apportionment results of ambient NH3 at the rural
sites during the dry season, as function of the assumed N isotopic signatures of BB-emitted NH3 .
As illustrated by the pie chart in Fig. 6, the average con- likely future, NH3 emissions under changing climate con-
tribution of BB to ambient NH3 at the rural sites during the ditions. While the full implications of our results remain to
season of intensive fire events is 2.4 µg m−3 ; this value can be explored, they promise to provide important guidance for
be regarded as the maximum possible concentration of BB- revising NH3 emissions from BB in atmospheric transport
emitted NH3 for the urban and rural sites, which are much models to assess their impacts on air quality, human health
further away from the fire areas. Based on the total NH3 con- and climate change.
centrations measured at the other sites, we calculate that the
contribution of BB to the ambient NH3 in the urban and sub-
urban areas is of the order of 9.6 % (ranging from 5.2 % to Data availability. Time series of data used in this paper can
14.8 %) and 12.3 % (ranging from 6.1 % to 19.9 %), respec- be found online (https://doi.org/10.5281/zenodo.4025673) (Chang,
tively. 2020).
4 Conclusion Supplement. The supplement related to this article is available on-
line at: https://doi.org/10.5194/acp-21-7187-2021-supplement.
In this study, we integrated satellite constraints on atmo-
spheric NH3 levels and fire intensity, discrete NH3 concen-
tration measurement, and N isotopic analysis of NH3 in or- Author contributions. YHC and YLZ designed the study.
der to assess the regional-scale contribution of BB to am- YHC wrote the original paper, organized the data and performed
bient NH3 in the heartland of Southeast Asia. The com- the analysis. YHC, MVD, LC and MFL revised and edited the text.
bined approach provides a cross-validation framework for All authors contributed to the final paper.
source apportioning of NH3 in the lower atmosphere and
will thus help to ameliorate predictions of BB emissions be-
Competing interests. The authors declare that they have no conflict
yond the tropics, particularly in areas of high vegetation fire
of interest.
risk. Our results suggest that during the dry wildfire sea-
son, BB emissions represent a ubiquitous but comparatively
small NH3 source, which accounts for 9.6 %, 12.3 % and
Special issue statement. This article is part of the special issue “Re-
21.0 % of ambient NH3 in urban, suburban and rural envi- gional assessment of air pollution and climate change over East and
ronments, respectively. While we do not claim that our re- Southeast Asia: results from MICS-Asia Phase III”. It is not associ-
sults necessarily apply at the global scale, and we do not ated with a conference.
question that BB is one of the most important global NH3
sources, we find that at least in the heartland of SE Asia,
BB related NH3 emissions to the atmosphere are rather mod- Acknowledgements. This study was supported by the International
erate and vary significantly in time and space. Both satel- (Regional) Cooperation and Exchange project (NSFC-TRF project;
lite observations and field and ground-based measurements grant no. 41761144056), the National Natural Science Founda-
capture these variations. Our findings underscore that BB- tion of China (grant nos. 41975166, 41977305, 41761144056 and
induced NH3 emissions in tropical monsoon environments 41705100), the Natural Science Foundation of Jiangsu Province
can be much lower than previously anticipated. Existing at- (grant nos. BK20180040 and BK20170946), the opening project
of the State Environmental Protection Key Laboratory of Forma-
mospheric transport models may overestimate current, and
https://doi.org/10.5194/acp-21-7187-2021 Atmos. Chem. Phys., 21, 7187–7198, 20217196 Y. Chang et al.: Pervasive but limited contribution of biomass burning to atmospheric ammonia
tion and Prevention of Urban Air Pollution Complex (Shanghai ondary Organic Aerosols from Biomass Burning Plumes
Academy of Environment Sciences; grant no. CX2020080583), the over Coastal Ocean Using Sugar Compounds and Stable
special fund of State Key Joint Laboratory of Environment Simu- Carbon Isotopes, ACS Earth Space Chem., 3, 1471–1484,
lation and Pollution Control (grant no. 19K01ESPCT), the Young https://doi.org/10.1021/acsearthspacechem.9b00140, 2019.
Elite Scientist Sponsorship Program by the Jiangsu Provincial As- Bouwman, A. F., Lee, D. S., Asman, W. A. H., Dentener, F. J., Van-
sociation for Science and Technology, the opening project of Shang- derHoek, K. W., and Olivier, J. G. J.: A global high-resolution
hai Key Laboratory of Atmospheric Particle Pollution and Preven- emission inventory for ammonia, Global Biogeochem. Cy., 11,
tion (LAP3 ; grant no. FDLAP19001), the Joint Open Project of 561–587, 1997.
KLME and CIC-FEMD (grant no. KLME201909), and the Gao- Bray, C. D., Battye, W., Aneja, V. P., Tong, D. Q., Lee, P.,
Tingyao Scholarship for outstanding PhD students. Lieven Clarisse and Tang, Y.: Ammonia emissions from biomass burning in
and Martin Van Damme (research associate and a postdoctoral re- the continental United States, Atmos. Environ., 187, 50–61,
searcher, respectively) are supported by the F.R.S.-FNRS. https://doi.org/10.1016/j.atmosenv.2018.05.052, 2018.
Carmichael, G. R., Ferm, M., Thongboonchoo, N., Woo, J.-H.,
Chan, L. Y., Murano, K., Viet, P. H., Mossberg, C., Bala, R.,
Financial support. This research has been supported by the Inter- Boonjawat, J., Upatum, P., Mohan, M., Adhikary, S. P., Shrestha,
national (Regional) Cooperation and Exchange project (NSFC-TRF A. B., Pienaar, J. J., Brunke, E. B., Chen, T., Jie, T., Guoan, D.,
project; grant no. 41761144056). Peng, L. C., Dhiharto, S., Harjanto, H., Jose, A. M., Kimani, W.,
Kirouane, A., Lacaux, J.-P., Richard, S., Barturen, O., Cerda,
J. C., Athayde, A., Tavares, T., Cotrina, J. S., and Bilici, E.:
Review statement. This paper was edited by Leiming Zhang and Measurements of sulfur dioxide, ozone and ammonia concentra-
reviewed by two anonymous referees. tions in Asia, Africa, and South America using passive samplers,
Atmos. Environ., 37, 1293–1308, https://doi.org/10.1016/S1352-
2310(02)01009-9, 2003.
Chang, Y.: Thailand ammonia [Data set], Zenodo,
References https://doi.org/10.5281/zenodo.4025673, 2020.
Chang, Y. and Ma, H.: Comment on “Fossil Fuel Combustion-
Akagi, S. K., Yokelson, R. J., Wiedinmyer, C., Alvarado, M. J., Related Emissions Dominate Atmospheric Ammonia Sources
Reid, J. S., Karl, T., Crounse, J. D., and Wennberg, P. O.: Emis- during Severe Haze Episodes: Evidence from 15 N-Stable Iso-
sion factors for open and domestic biomass burning for use tope in Size-Resolved Aerosol Ammonium”, Environ. Sci. Tech-
in atmospheric models, Atmos. Chem. Phys., 11, 4039–4072, nol., 50, 10765–10766, https://doi.org/10.1021/acs.est.6b03458,
https://doi.org/10.5194/acp-11-4039-2011, 2011. 2016.
Andreae, M. O.: Emission of trace gases and aerosols from biomass Chang, Y., Deng, C., Dore, A. J., and Zhuang, G.: Human Exc-
burning – an updated assessment, Atmos. Chem. Phys., 19, reta as a Stable and Important Source of Atmospheric Am-
8523–8546, https://doi.org/10.5194/acp-19-8523-2019, 2019. monia in the Megacity of Shanghai, Plos One, 10, e0144661,
Andreae, M. O. and Merlet, P.: Emission of trace gases and aerosols https://doi.org/10.1371/journal.pone.0144661, 2015.
from biomass burning, Global Biogeochem. Cy., 15, 955–966, Chang, Y., Liu, X., Deng, C., Dore, A. J., and Zhuang, G.:
https://doi.org/10.1029/2000gb001382, 2001. Source apportionment of atmospheric ammonia before, during,
Aneja, V. P., Schlesinger, W. H., and Erisman, J. W.: Farming pollu- and after the 2014 APEC summit in Beijing using stable nitro-
tion, Nat. Geosci., 1, 409–411, https://doi.org/10.1038/Ngeo236, gen isotope signatures, Atmos. Chem. Phys., 16, 11635–11647,
2008. https://doi.org/10.5194/acp-16-11635-2016, 2016a.
Aouizerats, B., van der Werf, G. R., Balasubramanian, R., and Chang, Y., Zou, Z., Deng, C., Huang, K., Collett, J. L., Lin, J.,
Betha, R.: Importance of transboundary transport of biomass and Zhuang, G.: The importance of vehicle emissions as a
burning emissions to regional air quality in Southeast Asia source of atmospheric ammonia in the megacity of Shanghai, At-
during a high fire event, Atmos. Chem. Phys., 15, 363–373, mos. Chem. Phys., 16, 3577–3594, https://doi.org/10.5194/acp-
https://doi.org/10.5194/acp-15-363-2015, 2015. 16-3577-2016, 2016b.
Asman, W. A., Sutton, M. A., and Schjørring, J. K.: Ammonia: Chang, Y., Zhang, Y. L., Li, J., Tian, C., Song, L., Zhai, X.,
emission, atmospheric transport and deposition, New Phytol., Zhang, W., Huang, T., Lin, Y. C., Zhu, C., Fang, Y., Lehmann,
139, 27–48, 1998. M. F., and Chen, J.: Isotopic constraints on the atmospheric
Bauters, M., Drake, T. W., Verbeeck, H., Bodé, S., Hervé- sources and formation of nitrogenous species in clouds influ-
Fernández, P., Zito, P., Podgorski, D. C., Boyemba, F., enced by biomass burning, Atmos. Chem. Phys., 19, 12221–
Makelele, I., Cizungu Ntaboba, L., Spencer, R. G. M., and 12234, https://doi.org/10.5194/acp-19-12221-2019, 2019a.
Boeckx, P.: High fire-derived nitrogen deposition on cen- Chang, Y., Zou, Z., Zhang, Y., Deng, C., Hu, J., Shi, Z., Dore,
tral African forests, P. Natl. Acad. Sci. USA, 115, 549–554, A. J., and Collett, J.: Assessing contributions of agricultural
https://doi.org/10.1073/pnas.1714597115, 2018. and non-agricultural emissions to atmospheric ammonia in
Betha, R., Behera, S. N., and Balasubramanian, R.: 2013 Southeast a Chinese megacity, Environ. Sci. Technol., 53, 1822–1833,
Asian Smoke Haze: Fractionation of Particulate-Bound Elements https://doi.org/10.1021/acs.est.8b05984, 2019b.
and Associated Health Risk, Environ. Sci. Technol., 48, 4327– Chang, Y., Clarisse, L., Van Damme, M., Tao, Y., Zou, Z., Dore,
4335, https://doi.org/10.1021/es405533d, 2014. A. J., and Collett, J. L.: Ammonia Emissions from Mudflats
Bikkina, S., Haque, M. M., Sarin, M., and Kawamura, K.:
Tracing the Relative Significance of Primary versus Sec-
Atmos. Chem. Phys., 21, 7187–7198, 2021 https://doi.org/10.5194/acp-21-7187-2021Y. Chang et al.: Pervasive but limited contribution of biomass burning to atmospheric ammonia 7197 of River, Lake, and Sea, ACS Earth Space Chem., 4, 614–619, Layman, C. A., Araujo, M. S., Boucek, R., Hammerschlag-Peyer, https://doi.org/10.1021/acsearthspacechem.0c00017, 2020. C. M., Harrison, E., Jud, Z. R., Matich, P., Rosenblatt, A. Chang, Y. H., Liu, X. J., Dore, A. J., and Li, K.: Stemming PM2.5 E., Vaudo, J. J., Yeager, L. A., Post, D. M., and Bearhop, pollution in China: Re-evaluating the role of ammonia, aviation S.: Applying stable isotopes to examine food-web structure: and non-exhaust road traffic emissions, Environ. Sci. Technol., an overview of analytical tools, Biolog. Rev., 87, 545–562, 46, 13035–13036, https://doi.org/10.1021/es304806k, 2012. https://doi.org/10.1111/j.1469-185X.2011.00208.x, 2012. Chu, J.-E., Kim, K.-M., Lau, W. K. M., and Ha, K.-J.: How Light- Lee, H. H., Bar-Or, R. Z., and Wang, C.: Biomass burning aerosols Absorbing Properties of Organic Aerosol Modify the Asian Sum- and the low-visibility events in Southeast Asia, Atmos. Chem. mer Monsoon Rainfall?, J. Geophys. Res.-Atmos., 123, 2244– Phys., 17, 965–980, https://doi.org/10.5194/acp-17-965-2017, 2255, https://doi.org/10.1002/2017jd027642, 2018. 2017. Clarisse, L., Clerbaux, C., Dentener, F., Hurtmans, D., and Li, F., Zhang, X., and Kondragunta, S.: Biomass Burning in Africa: Coheur, P.-F.: Global ammonia distribution derived from An Investigation of Fire Radiative Power Missed by MODIS Us- infrared satellite observations, Nat. Geosci., 2, 479–483, ing the 375 m VIIRS Active Fire Product, Remote Sens., 12, https://doi.org/10.1038/ngeo551, 2009. 1561–1580, https://doi.org/10.3390/rs12101561, 2020. Clarisse, L., Shephard, M. W., Dentener, F., Hurtmans, D., Cady- Li, Q., Jiang, J., Cai, S., Zhou, W., Wang, S., Duan, L., Pereira, K., Karagulian, F., Van Damme, M., Clerbaux, C., and and Hao, J.: Gaseous Ammonia Emissions from Coal and Coheur, P.-F.: Satellite monitoring of ammonia: A case study of Biomass Combustion in Household Stoves with Different Com- the San Joaquin Valley, J. Geophys. Res.-Atmos., 115, D13302, bustion Efficiencies, Environ. Sci. Technol. Lett., 3, 98–103, https://doi.org/10.1029/2009JD013291, 2010. https://doi.org/10.1021/acs.estlett.6b00013, 2016. Crutzen, P. J. and Andreae, M. O.: Biomass Burning Liu, D., Fang, Y., Tu, Y., and Pan, Y.: Chemical method for nitrogen in the Tropics: Impact on Atmospheric Chemistry isotopic analysis of ammonium at natural abundance, Anal. and Biogeochemical Cycles, Science, 250, 1669–1678, Chem., 86, 3787–3792, https://doi.org/10.1021/ac403756u, https://doi.org/10.1126/science.250.4988.1669, 1990. 2014. Crutzen, P. J., Heidt, L. E., Krasnec, J. P., Pollock, W. H., and Liu, X., Zhang, Y., Han, W., Tang, A., Shen, J., Cui, Z., Vitousek, Seiler, W.: Biomass burning as a source of atmospheric gases P., Erisman, J. W., Goulding, K., Christie, P., Fangmeier, A., CO, H2 , N2 O, NO, CH3 Cl and COS, Nature, 282, 253–256, and Zhang, F.: Enhanced nitrogen deposition over China, Nature, https://doi.org/10.1038/282253a0, 1979. 494, 459–462, https://doi.org/10.1038/nature11917, 2013. Elliott, E. M., Yu, Z., Cole, A. S., and Coughlin, J. G.: Iso- Lobert, J. M., Scharffe, D. H., Hao, W. M., and Crutzen, topic advances in understanding reactive nitrogen deposition P. J.: Importance of biomass burning in the atmospheric and atmospheric processing, Sci. Total Environ., 662, 393–403, budgets of nitrogen-containing gases, Nature, 346, 552–554, https://doi.org/10.1016/j.scitotenv.2018.12.177, 2019. https://doi.org/10.1038/346552a0, 1990. Felix, J. D., Elliott, E. M., Gish, T. J., McConnell, L. L., Marlier, M. E., DeFries, R. S., Voulgarakis, A., Kinney, P. and Shaw, S. L.: Characterizing the isotopic composition L., Randerson, J. T., Shindell, D. T., Chen, Y., and Falu- of atmospheric ammonia emission sources using passive vegi, G.: El Niño and health risks from landscape fire emis- samplers and a combined oxidation-bacterial denitrifier ap- sions in southeast Asia, Nat. Clim. Change, 3, 131–136, proach, Rapid Commun. Mass Spectrom., 27, 2239–2246, https://doi.org/10.1038/nclimate1658, 2013. https://doi.org/10.1002/rcm.6679, 2013. Martin, R. V.: Satellite remote sensing of sur- Hantson, S., Arneth, A., Harrison, S. P., Kelley, D. I., Prentice, I. C., face air quality, Atmos. Environ., 42, 7823-7843, Rabin, S. S., Archibald, S., Mouillot, F., Arnold, S. R., Artaxo, https://doi.org/10.1016/j.atmosenv.2008.07.018, 2008. P., Bachelet, D., Ciais, P., Forrest, M., Friedlingstein, P., Hickler, Pan, X., Ichoku, C., Chin, M., Bian, H., Darmenov, A., Colarco, T., Kaplan, J. O., Kloster, S., Knorr, W., Lasslop, G., Li, F., Man- P., Ellison, L., Kucsera, T., da Silva, A., Wang, J., Oda, T., and geon, S., Melton, J. R., Meyn, A., Sitch, S., Spessa, A., van der Cui, G.: Six global biomass burning emission datasets: inter- Werf, G. R., Voulgarakis, A., and Yue, C.: The status and chal- comparison and application in one global aerosol model, Atmos. lenge of global fire modelling, Biogeosciences, 13, 3359–3375, Chem. Phys., 20, 969–994, https://doi.org/10.5194/acp-20-969- https://doi.org/10.5194/bg-13-3359-2016, 2016. 2020, 2020. Huang, C., Hu, Q., Lou, S., Tian, J., Wang, R., Xu, C., An, J., Ren, Parnell, A. C., Inger, R., Bearhop, S., and Jackson, A. H., Ma, D., Quan, Y., Zhang, Y., and Li, L.: Ammonia Emission L.: Source partitioning using stable isotopes: cop- Measurements for Light-Duty Gasoline Vehicles in China and ing with too much variation, Plos One, 5, e9672, Implications for Emission Modeling, Environ. Sci. Technol., 52, https://doi.org/10.1371/journal.pone.0009672, 2010. 11223–11231, https://doi.org/10.1021/acs.est.8b03984, 2018. Paulot, F. and Jacob, D. J.: Hidden cost of US agricultural exports: Huang, K., Fu, J. S., Hsu, N. C., Gao, Y., Dong, X., particulate matter from ammonia emissions, Environ. Sci. Tech- Tsay, S.-C., and Lam, Y. F.: Impact assessment of nol., 48, 903–908, 2014. biomass burning on air quality in Southeast and East Paulot, F., Paynter, D., Ginoux, P., Naik, V., Whitburn, S., Van Asia during BASE-ASIA, Atmos. Environ., 78, 291-302, Damme, M., Clarisse, L., Coheur, P.-F., and Horowitz, L. https://doi.org/10.1016/j.atmosenv.2012.03.048, 2013. W.: Gas-aerosol partitioning of ammonia in biomass burn- Kawashima, H. and Kurahashi, T.: Inorganic ion and nitrogen iso- ing plumes: Implications for the interpretation of space- topic compositions of atmospheric aerosols at Yurihonjo, Japan: borne observations of ammonia and the radiative forcing Implications for nitrogen sources, Atmos. Environ., 45, 6309– of ammonium nitrate, Geophys. Res. Lett., 44, 8084–8093, 6316, 2011. https://doi.org/10.1002/2017gl074215, 2017. https://doi.org/10.5194/acp-21-7187-2021 Atmos. Chem. Phys., 21, 7187–7198, 2021
7198                        Y. Chang et al.: Pervasive but limited contribution of biomass burning to atmospheric ammonia

Puchalski, M. A., Sather, M. E., Walker, J. T., Lehmann, C. M., Gay,         man, J. A., Tang, Y. S., Sutton, M. A., Erisman, J. W., and
   D. A., Mathew, J., and Robarge, W. P.: Passive ammonia moni-              Coheur, P. F.: Towards validation of ammonia (NH3 ) measure-
   toring in the United States: Comparing three different sampling           ments from the IASI satellite, Atmos. Meas. Tech., 8, 1575–
   devices, J. Environ. Monit., 13, 3156–3167, 2011.                         1591, https://doi.org/10.5194/amt-8-1575-2015, 2015a.
Shi, Y., Matsunaga, T., and Yamaguchi, Y.: High-Resolution                 Van Damme, M., Erisman, J. W., Clarisse, L., Dammers, E., Whit-
   Mapping of Biomass Burning Emissions in Three Trop-                       burn, S., Clerbaux, C., Dolman, A. J., and Coheur, P.-F.: World-
   ical Regions, Environ. Sci. Technol., 49, 10806–10814,                    wide spatiotemporal atmospheric ammonia (NH3 ) columns vari-
   https://doi.org/10.1021/acs.est.5b01598, 2015.                            ability revealed by satellite, Geophys. Res. Lett., 42, 8660–8668,
Souri, A. H., Choi, Y., Jeon, W., Kochanski, A. K., Diao, L., Man-           https://doi.org/10.1002/2015gl065496, 2015b.
   del, J., Bhave, P. V., and Pan, S.: Quantifying the Impact of           Van Damme, M., Whitburn, S., Clarisse, L., Clerbaux, C.,
   Biomass Burning Emissions on Major Inorganic Aerosols and                 Hurtmans, D., and Coheur, P. F.: Version 2 of the IASI
   Their Precursors in the U.S., J. Geophys. Res.-Atmos., 122,               NH3 neural network retrieval algorithm: near-real-time and
   12020–12041, https://doi.org/10.1002/2017jd026788, 2017.                  reanalysed datasets, Atmos. Meas. Tech., 10, 4905–4914,
Streets, D. G., Canty, T., Carmichael, G. R., de Foy, B., Dickerson,         https://doi.org/10.5194/amt-10-4905-2017, 2017.
   R. R., Duncan, B. N., Edwards, D. P., Haynes, J. A., Henze, D.          Van Damme, M., Clarisse, L., Whitburn, S., Hadji-Lazaro, J., Hurt-
   K., Houyoux, M. R., Jacob, D. J., Krotkov, N. A., Lamsal, L. N.,          mans, D., Clerbaux, C., and Coheur, P.-F.: Industrial and agri-
   Liu, Y., Lu, Z., Martin, R. V., Pfister, G. G., Pinder, R. W., Salaw-     cultural ammonia point sources exposed, Nature, 564, 99–103,
   itch, R. J., and Wecht, K. J.: Emissions estimation from satel-           https://doi.org/10.1038/s41586-018-0747-1, 2018.
   lite retrievals: A review of current capability, Atmos. Environ.,       van der Werf, G. R., Randerson, J. T., Giglio, L., Collatz, G. J.,
   77, 1011–1042, https://doi.org/10.1016/j.atmosenv.2013.05.051,            Kasibhatla, P. S., and Arellano Jr., A. F.: Interannual variability
   2013.                                                                     in global biomass burning emissions from 1997 to 2004, Atmos.
Sun, K., Tao, L., Miller, D. J., Pan, D., Golston, L. M., Zondlo,            Chem. Phys., 6, 3423–3441, https://doi.org/10.5194/acp-6-3423-
   M. A., Griffin, R. J., Wallace, H. W., Leong, Y. J., Yang,                2006, 2006.
   M. M., Zhang, Y., Mauzerall, D. L., and Zhu, T.: Vehicle                Wang, S. X., Xing, J., Jang, C. R., Zhu, Y., Fu, J. S., and Hao,
   Emissions as an Important Urban Ammonia Source in the                     J. M.: Impact Assessment of Ammonia Emissions on Inorganic
   United States and China, Environ. Sci. Technol., 51, 2472–2481,           Aerosols in East China Using Response Surface Modeling Tech-
   https://doi.org/10.1021/acs.est.6b02805, 2017.                            nique, Environ. Sci. Technol., 45, 9293–9300, 2011.
Sutton, M. A., Erisman, J. W., Dentener, F., and Moller,                   Wang, Y., Zhang, Q. Q., He, K., Zhang, Q., and Chai, L.:
   D.: Ammonia in the environment: From ancient                              Sulfate-nitrate-ammonium aerosols over China: response to
   times to the present, Environ. Pollut., 156, 583–604,                     2000–2015 emission changes of sulfur dioxide, nitrogen ox-
   https://doi.org/10.1016/j.envpol.2008.03.013, 2008.                       ides, and ammonia, Atmos. Chem. Phys., 13, 2635–2652,
Sutton, M. A., Oenema, O., Erisman, J. W., Leip, A., van Grinsven,           https://doi.org/10.5194/acp-13-2635-2013, 2013.
   H., and Winiwarter, W.: Too much of a good thing, Nature, 472,          Whitburn, S., Van Damme, M., Kaiser, J. W., van der Werf, G.
   159–161, https://doi.org/10.1038/472159a, 2011.                           R., Turquety, S., Hurtmans, D., Clarisse, L., Clerbaux, C., and
Tang, Y. S., Braban, C. F., Dragosits, U., Dore, A. J., Simmons,             Coheur, P. F.: Ammonia emissions in tropical biomass burn-
   I., van Dijk, N., Poskitt, J., Dos Santos Pereira, G., Keenan, P.         ing regions: Comparison between satellite-derived emissions
   O., Conolly, C., Vincent, K., Smith, R. I., Heal, M. R., and Sut-         and bottom-up fire inventories, Atmos. Environ., 121, 42–54,
   ton, M. A.: Drivers for spatial, temporal and long-term trends            https://doi.org/10.1016/j.atmosenv.2015.03.015, 2015.
   in atmospheric ammonia and ammonium in the UK, Atmos.                   Whitburn, S., Van Damme, M., Clarisse, L., Bauduin, S., Heald, C.
   Chem. Phys., 18, 705–733, https://doi.org/10.5194/acp-18-705-             L., Hadji-Lazaro, J., Hurtmans, D., Zondlo, M. A., Clerbaux, C.,
   2018, 2018.                                                               and Coheur, P. F.: A flexible and robust neural network IASI-
Teng, X., Hu, Q., Zhang, L., Qi, J., Shi, J., Xie, H., Gao,                  NH3 retrieval algorithm, J. Geophys. Res.-Atmos., 121, 6581–
   H., and Yao, X.: Identification of Major Sources of Atmo-                 6599, https://doi.org/10.1002/2016JD024828, 2016a.
   spheric NH3 in an Urban Environment in Northern China                   Whitburn, S., Van Damme, M., Clarisse, L., Turquety, S.,
   During Wintertime, Environ. Sci. Technol., 51, 6839–6848,                 Clerbaux, C., and Coheur, P.-F.: Doubling of annual am-
   https://doi.org/10.1021/acs.est.7b00328, 2017.                            monia emissions from the peat fires in Indonesia during
Tsai, Y. I., Sopajaree, K., Chotruksa, A., Wu, H.-C., and Kuo, S.-           the 2015 El Niño, Geophys. Res. Lett., 43, 11007–11014,
   C.: Source indicators of biomass burning associated with in-              https://doi.org/10.1002/2016gl070620, 2016b.
   organic salts and carboxylates in dry season ambient aerosol            Zheng, X.-D., Liu, X.-Y., Song, W., Sun, X.-C., and Liu, C.-
   in Chiang Mai Basin, Thailand, Atmos. Environ., 78, 93-104,               Q.: Nitrogen isotope variations of ammonium across rain
   https://doi.org/10.1016/j.atmosenv.2012.09.040, 2013.                     events: Implications for different scavenging between ammo-
Van Damme, M., Clarisse, L., Heald, C. L., Hurtmans, D., Ngadi,              nia and particulate ammonium, Environ. Pollut., 239, 392–398,
   Y., Clerbaux, C., Dolman, A. J., Erisman, J. W., and Coheur, P. F.:       https://doi.org/10.1016/j.envpol.2018.04.015, 2018.
   Global distributions, time series and error characterization of at-     Zhu, L., Henze, D. K., Cady-Pereira, K. E., Shephard, M. W., Luo,
   mospheric ammonia (NH3 ) from IASI satellite observations, At-            M., Pinder, R. W., Bash, J. O., and Jeong, G.-R.: Constraining
   mos. Chem. Phys., 14, 2905–2922, https://doi.org/10.5194/acp-             U.S. ammonia emissions using TES remote sensing observations
   14-2905-2014, 2014.                                                       and the GEOS-Chem adjoint model, J. Geophys. Res.-Atmos.,
Van Damme, M., Clarisse, L., Dammers, E., Liu, X., Nowak, J. B.,             118, 3355–3368, https://doi.org/10.1002/jgrd.50166, 2013.
   Clerbaux, C., Flechard, C. R., Galy-Lacaux, C., Xu, W., Neu-

Atmos. Chem. Phys., 21, 7187–7198, 2021                                                       https://doi.org/10.5194/acp-21-7187-2021
You can also read