Non-destructive measurement of bitter pit in apple fruit using NIR hyperspectral imaging
←
→
Page content transcription
If your browser does not render page correctly, please read the page content below
Postharvest Biology and Technology 40 (2006) 1–6

                    Non-destructive measurement of bitter pit in apple fruit
                              using NIR hyperspectral imaging
         Bart M. Nicolaı̈ a,∗ , Elmi Lötze b , Ann Peirs a , Nico Scheerlinck a,b , Karen I. Theron b
                            a BIOSYST – MeBioS, Katholieke Universiteit Leuven, Willem de Croylaan 42, B-3001, Leuven, Belgium
                      b   Department of Horticultural Science, University of Stellenbosch, Private Bag XI, Matieland 7602, South Africa

                                                     Received 9 August 2005; accepted 18 December 2005

Abstract

  A hyperspectral NIR imaging system was developed to identify bitter pit lesions on apples. A discriminant PLS calibration model was
constructed to discriminate between pixels of unaffected apple skin and bitter pit lesions. The calibration model was successfully validated
on a different apple. The system was able to identify bitter pit lesions, even when not visible to the naked eye such as just after harvest, but
could not discriminate between bitter pit lesions and corky tissue. The reduced luminosity at the boundary of the image caused in one image
some misclassification errors.
© 2006 Elsevier B.V. All rights reserved.

Keywords: Apple; Fruit; Quality; Bitter pit; Near infrared; Spectroscopy; Hyperspectral; Imaging; Non-destructive testing

1. Introduction                                                                    individual fruit at an early stage. This would create the oppor-
                                                                                   tunity to remove such fruit prior to commercial handling.
   Bitter pit is a physiological disorder in apples which devel-                       Near infrared reflectance (NIR)-spectroscopy has been
ops post harvest. Affected fruit are either declined or the                        successfully applied to study internal quality and quality dis-
producer fined by exporters for exceeding the bitter pit thresh-                   orders of a variety of fruit species (see, e.g., Slaughter, 1995;
old which is often 0% (Wooldridge, 1999). There is therefore                       Lammertyn et al., 1998; Peirs et al., 2000, 2002, 2003a,b,
an interest in techniques to identify bitter pit prone fruit prior                 2005; Saranwong et al., 2004; Clark et al., 2004). Known
to commercialisation.                                                              advantages of NIR-spectroscopy include the measurement
   Although bitter pit is initiated during the pre-harvest                         speed, non-destructive nature, repeatability and fact that mul-
period in association with a calcium deficiency, symptoms                          tiple attributes like total soluble solids, pH and acid levels
normally develop progressively during storage. The defect                          can be measured simultaneously (Lammertyn et al., 1998).
may be identified as brown, corky, roundish lesions predomi-                       Further, it has been shown that bruises (Brown et al., 1974;
nantly under the epidermis, mainly at the calyx end (Ferguson                      Upchurch et al., 1990, 1991; Xing et al., 2003) and frost dam-
and Watkins, 1989; Lotz, 1996). Internal pit can also develop                      age (Upchurch et al., 1991) within an apple could also be iden-
just below the skin and in the cortex, but is not externally vis-                  tified by reflection measurements. Bruised areas in apples
ible (Ferguson and Watkins, 1989; Little and Holmes, 1999).                        caused a reduced NIR reflectance pattern in the 700–2000 nm
Two physiological induction methods (forcing maturity using                        region (Brown et al., 1974) as a result of cell wall destruction
ethylene or magnesium solutions) are available to predict the                      that increases the scattering of the radiation in the tissue.
potential of bitter pit occurrence pre-harvest, but both tech-                         While point measurements are useful to evaluate the fea-
niques are destructive (Retamales et al., 2000). There is a need                   sibility of NIR spectroscopy to identify disorders and to
for a non-destructive technique to detect bitter pit potential on                  identify relevant wavelength ranges, it is clear that in prac-
                                                                                   tical applications the whole surface of the fruit is to be
 ∗   Corresponding author. Tel.: +32 16 322375; fax: +32 16 322955.                inspected. Multispectral or hyperspectral imaging systems
     E-mail address: bart.nicolai@biw.kuleuven.be (B.M. Nicolaı̈).                 are, hence, required. Upchurch et al. (1994) evaluated NIR

0925-5214/$ – see front matter © 2006 Elsevier B.V. All rights reserved.
doi:10.1016/j.postharvbio.2005.12.006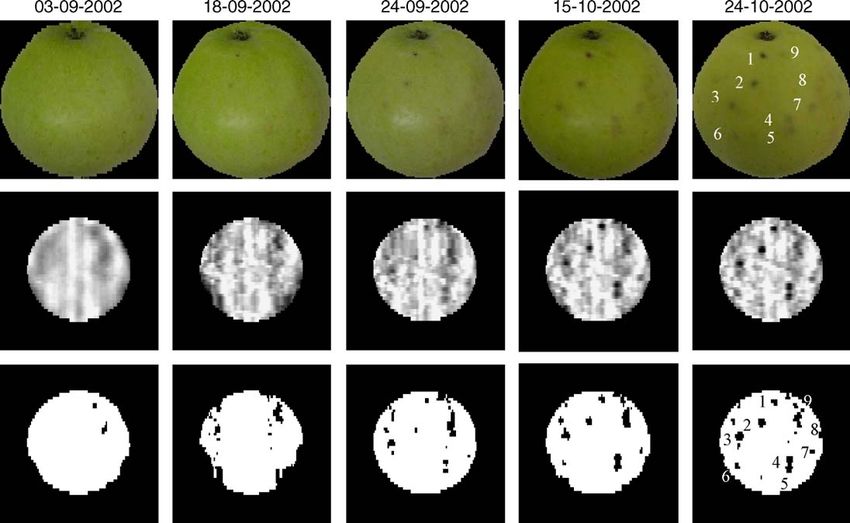
2                                   B.M. Nicolaı̈ et al. / Postharvest Biology and Technology 40 (2006) 1–6

imaging to characterise the influence of time, type and sever-
ity of bruises on the near infrared reflectance from bruised
and unbruised regions on ‘Delicious’ and ‘Golden Delicious’
apples. Wen and Tao (2000) and Cheng et al. (2003) devel-
oped a novel method based on NIR and mid-infrared (MIR)
imaging to detect defects in apple fruit. Lu (2003) developed
a near infrared hyperspectral imaging system for detecting
old and new bruises on ‘Red Delicious’ and ‘Golden Deli-
cious’ apples in the spectral region between 900 and 1700 nm.
He found that the spectral region between 1000 and 1340 nm
was most appropriate for bruise detection. Peirs et al. (2003c)
developed a hyperspectral NIR imaging system to determine
the maturity stage of pre-climacteric apple fruit.                                     Fig. 1. Hyperspectral imaging setup (not to scale).
    So far, no non-destructive method is available to detect
bitter pit lesions in apple fruit. This paper reports on NIR               quantum efficiency is higher than 75% from 1000 to 1600 nm.
hyperspectral imaging to determine bitter pit occurrence on                The camera has 320 × 240 pixel elements. The scans were
apples.                                                                    obtained continuously with an exposure time of 16.27 ms.
                                                                           A frame grabber board (Image Acquisition Hardware, 1409,
                                                                           National Instruments, TX, USA) was used for image acqui-
2. Materials and methods                                                   sition. The frame grabber was configured by the NI-IMAQ
                                                                           Vision Builder for Windows (National Instruments). The out-
2.1. Plant material                                                        put signal was compensated properly so as to avoid saturation
                                                                           or high noise levels.
   Apple fruit were harvested on September 5, 2002, from                       A spectrograph (ImSpector, Spectral Imaging Ltd., Oulu,
trees of an unnamed cultivar of a breeding program in the                  Finland) with a holographic transmission grating and a
experimental station FTC of Rillaar (Belgium). Trees were                  16 mm lens (f 1.6) were attached to the camera head. The
selected because bitter pit symptoms were already present                  horizontal and vertical pixels on the camera capture spatial
in some fruit prior to harvest. The harvested fruit, though,               and spectral information, respectively. The setup was cali-
were free of visible bitter pit symptoms. In total 15 fruit were           brated by means of a daylight lamp according to a procedure
harvested of which only 2 (denoted by A2 and A3) eventually                described by Peirs et al. (2003c).
developed bitter pit.                                                          A small aluminium moving platform (15 cm × 15 cm) was
                                                                           mounted under the camera to move the apple under the cam-
2.2. Experimental design                                                   era. The platform was attached to a screw driven by a stepper
                                                                           motor (assembly kit K8005, Velleman, Belgium). The assem-
   Fruit were stored after harvest for 5–6 weeks in a cool                 bly of the stepper motor was performed by J-Tronics (Dessel-
room at 10 ◦ C to enhance bitter pit development. During this              gem, Belgium). Driver software was developed to automate
storage period, digital photographs and NIR hyperspectral                  the data acquisition, to store the images and to synchronise
images of every fruit were acquired at six evaluation dates                platform movements with the image acquisition (Labview 6.i,
(11-9-2002, 18-09-2002, 24-09-2002, 15-10-2002 and 24-                     National Instruments). The spatial resolution was 1.5 mm.
10-2002). Fruit were removed from the cool room the night                  The total acquisition time for one apple was about 17 min.
before the image acquisition. The imaging was carried out at                   The platform was mounted in an aluminium dome which
room temperature.                                                          was painted with a granular white paint (Decokwarts, Boss-
                                                                           Paints, Waregem, Belgium) to diffuse the light produced by
2.3. Imaging systems                                                       six halogen spots (Halogen Decostar 512S-15W, Osram, Ger-
                                                                           many). The halogen spots were mounted such that the camera
    Photographs were taken with a digital camera (DSC-                     could not capture direct light from the spots. The camera and
F505V, Sony, Brussels, Belgium). Two studio lamps (Sil-                    spectrograph were mounted in the top of the dome. The body
verDome photoflex FV-SL3200-250V) were used to provide                     of the camera was at the exterior of the dome to avoid warm-
diffuse, well-distributed illumination. Fruit were put on an               ing up. A black rubber foam was used as background.
eggcup for stabilisation. A black rubber material was used as                  More details about the hyperspectral imaging setup and
background.                                                                measurement protocol can be found in Peirs et al. (2003c).
    A drawing of the hyperspectral imaging systems is shown
in Fig. 1. An Indium Gallium Arsenide near infrared line scan              2.4. Image analysis
camera (SU320-1.7RT-V, Sensors Unlimited Inc., Prince,
USA) was used for hyperspectral imaging. The optical sen-                    By moving the platform step by step, a series of line scan
sitivity of this camera ranges from 900 to 1700 nm and the                 images (wavelength × one spatial dimension) was obtained at
B.M. Nicolaı̈ et al. / Postharvest Biology and Technology 40 (2006) 1–6                                               3

                                                                                     length with an averaging filter with a structural element of
                                                                                     3 × 15 pixels, reflecting the difference in spatial resolution
                                                                                     in the x and y directions, to remove small irregularities such
                                                                                     as lenticels (Fig. 3b, apple A3). In a second step the original
                                                                                     image cube was filtered again for every wavelength with an
                                                                                     averaging filter but now with a structural element of 64 × 320
                                                                                     pixels to provide a smooth background image without any
                                                                                     surface features (Fig. 3c). Both filtered images were sub-
                                                                                     tracted from each other. To avoid luminosity effects due to
                                                                                     the irregular 3D shape of the fruit, the resulting image cube
                                                                                     was masked and only the central disk with a radius of 65% of
                                                                                     the original fruit radius was further considered. The resulting
                                                                                     image cube (further denoted as “difference image cube”) was
                                                                                     averaged over all wavelengths and scaled to the range [0, 1]
                                                                                     (Fig. 3d). Thirty-four pixels with a value larger than a thresh-
           Fig. 2. Some typical Savitsky-Golay filtered spectra.                     old of 0.7 were found and assumed to correspond to bitter pit
                                                                                     affected skin. Pixels with a value smaller than a threshold of
                                                                                     0.3 were assumed to be background. The spectra of the 37 bit-
every step. For further processing, these images were assem-                         ter pit pixels and 74 randomly selected pixels from unaffected
bled into a datacube. A square was fitted around the resulting                       skin were extracted from the difference image cube, and a
binary image, and used to remove rows and columns which                              discriminant PLS analysis was carried out. Leave-one-out
only contained background pixels from the datacube in order                          cross validation was used to determine the number of latent
to reduce its size. The reflectance spectra were Savitsky-                           variables based on minimisation of the root mean squared
Golay filtered (order 3, interval width 31) prior to further                         error of cross validation (RMSECV) (Næs et al., 2004). All
processing (Næs et al., 2004). Because of the high noise level                       spectra were mean centered. Finally, the predicted images
the spectra were limited to the range 954–1350 nm for fur-                           (Fig. 3e) were once again segmented with a threshold of 0.7
ther processing. Some typical filtered spectra of apple A2 are                       (Fig. 3f).
shown in Fig. 2.                                                                         For validation, the same image cube pre-processing pro-
   To segment the image, the following procedure was used.                           cedure was used on a different fruit (apple A2), and the
First the image cube was spatially filtered for every wave-                          discriminant PLS calibration model was used to predict a bit-

Fig. 3. Illustration of the image processing algorithm (apple A3): (a) Digital photograph of apple; (b) image of mean NIR spectra filtered with 3 × 15 averaging
filter; (c) image of mean NIR spectra filtered with 64 × 320 averaging filter; (d) difference of (b) and (c); (e) bitter pit prediction image after PLS calibration;
(f) binary bitter pit image. The numbers identify corresponding bitter pit lesions in digital photographs and binary images. The same numbering has been used
in Figs. 4a and 5. Note that the digital photograph has a slightly different orientation than the hyperspectral images.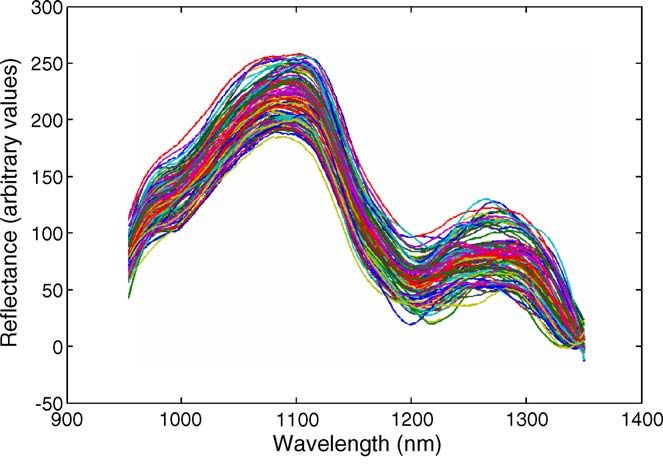
4                                          B.M. Nicolaı̈ et al. / Postharvest Biology and Technology 40 (2006) 1–6

Fig. 4. Apple A3 used for calibration (left) and apple A2 used for validation (right) after peeling showing subepidermal bitter pit lesions. The same numbering
as in Figs. 3, 5 and 6 has been used to identify bitter pit lesions.

ter pit score for every pixel. A threshold of 0.5 was then used                    tem is capable of detecting bitter pit before visual symptoms
to discriminate between unaffected and bitter pit affected                         actually occur.
pixels.                                                                                The number of latent variables in the PLS calibration
                                                                                   was as low as 2. This indicates that rather than the spectral
                                                                                   information, the total reflectance in the NIR is probably
3. Results and discussion                                                          sufficiently informative to classify individual pixels. The
                                                                                   pitted lesions probably caused an increase in light scattering
    The calibration results are shown in Fig. 3f. The identified                   due to dehydration and could therefore clearly be separated
bitter pit lesions correspond to the bitter pit lesions which                      from healthy tissue with more fluid. This is in line with
can be observed visually in Fig. 3a. While the hyperspec-                          the results of Lötze (2005) who found that the lower water
tral imaging system seems to identify additional bitter pit                        content of corky bitter pit lesions reflects a smaller amount
lesions which do appear in the digital photograph, the digital                     of radiation at the water specific wavelengths, 1400, 1800
photograph of the peeled apple clearly confirms these spots                        and 2300 nm. Findings from Brown et al. (1974) indicate
(Fig. 4a). This indicates that the hyperspectral imaging sys-                      that the average reflectance is less for bruised than unbruised

Fig. 5. Development of bitter pit during storage (apple A3). Top row: digital images; middle row: PLS predictions of bitter pit (scaled images); bottom row:
binary images of predicted bitter pit. Note that the image orientation varies slightly between the different images. The numbering corresponds to that used in
Fig. 4a and has been used to identify bitter pit lesions.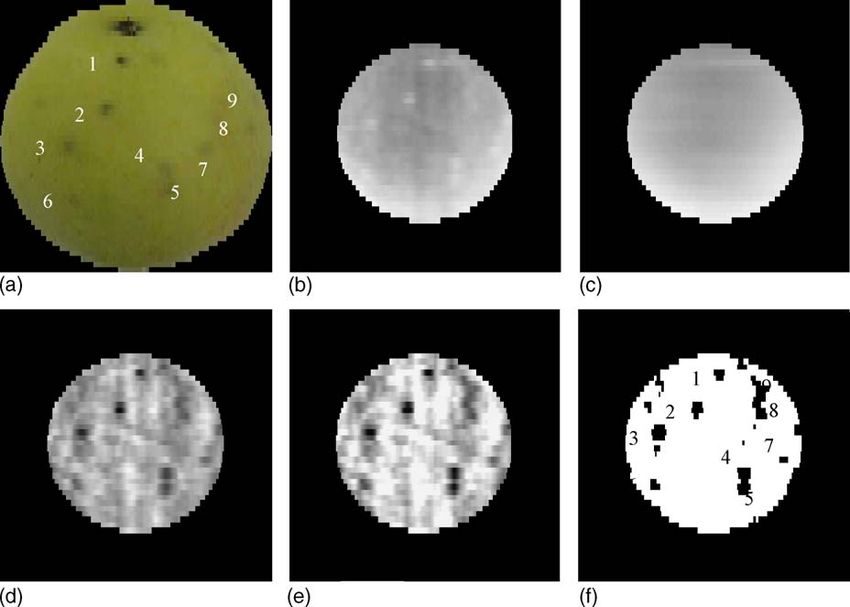
B.M. Nicolaı̈ et al. / Postharvest Biology and Technology 40 (2006) 1–6 5
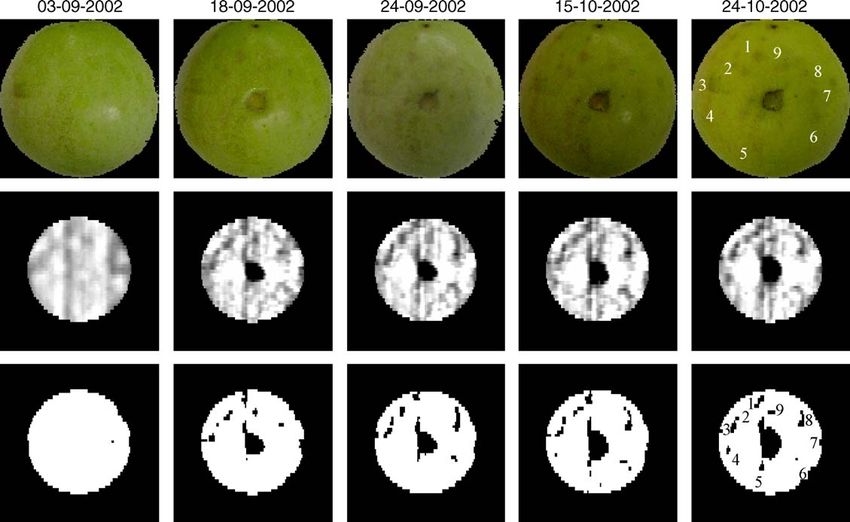
Fig. 6. Development of bitter pit during storage (apple A2). The apple was different from the one for which the PLS calibration model was developed. Top
row: digital images; middle row: PLS predictions of bitter pit (scaled images); bottom row: binary images of predicted bitter pit. The numbering corresponds
to that used in Fig. 4b and has been used to identify bitter pit lesions. Note that the image orientation varies slightly between the different images.
apples at wavelengths between 700 and 2200 nm. In bruised imaging was described by Wen and Tao (2000) and Cheng et
areas, water replaces the intercellular air spaces in the plant al. (2003).
tissue and causes a decrease in NIR reflectance of these
areas (Woolley, 1971).
The calibration model was used to identify bitter pit 4. Conclusions
lesions based on hyperspectral images at harvest (05-09-
2002) and various times after harvest (18-09-2002, 24-09- A hyperspectral NIR imaging system was developed to
2002, 15-10-2002 and 24-10-2002). The results are shown in identify bitter pit lesions on apples at harvest. The system
Fig. 5 for apple A3. The hyperspectral imaging system iden- consisted of a line scan NIR camera, a spectrograph, a mov-
tifies the bitter pit lesions well from 18-9-2002 even when ing platform and a diffuse illumination system. A discrimi-
barely visible. While the spots intensify over time, they grow nant PLS calibration model was constructed to discriminate
in size in the binary image. Note that, due to the decreased between pixels of unaffected apple skin and bitter pit lesions.
luminosity at the boundaries of the image, the system some- The calibration model was successfully validated on a differ-
times incorrectly classifies the boundary as a bitter pit lesion. ent apple. The system was able to identify bitter pit lesions,
This can be solved by either adjusting the threshold for bit- even when not visible to the naked eye such as just at har-
ter pit classification, either by reducing the size of the mask vest. The system could not discriminate between bitter pit and
or a combination of both. For a commercial system multiple corky tissue. The reduced luminosity at the boundary of the
images are probably required. image caused in one image some misclassification errors. It is
The calibration model developed for apple A3 was applied suggested to acquire multiple images to cover the whole sur-
to predict bitter pit in apple A2 as a validation. The results face of the apple while applying sufficient masking to avoid
are shown in Fig. 6. Again the system correctly identifies boundary artefacts. Also, stem and calyx effects have not been
bitter pit lesions, some of which are not visible but could be considered in this article. Finally, in a commercial implemen-
observed after peeling the apple (Fig. 4b). However, during tation a considerable speed-up of both hardware as well as
storage another disorder develops (centre of the image) which image processing sofware is required.
the system erroneously identifies as bitter pit. In practice this
is of course not relevant, as fruit with any disorder of this
intensity is to be rejected. Acknowledgements
We did not consider stem and calyx effects although it is to
be expected that they would interfere with the classification We would like to acknowledge financial support from the
algorithm. A system to identify stem and calyx based on MIR Flanders Fund for Scientific Research (F.W.O. Vlaanderen),6 B.M. Nicolaı̈ et al. / Postharvest Biology and Technology 40 (2006) 1–6
and the International Relations Offices of the K.U.Leuven spectroscopy for apple quality measurements. Biosyst. Eng. 81, 305–
and the University of Stellenbosch. 311.
Peirs, A., Scheerlinck, N., Nicolaı̈, B.M., 2003a. Temperature compensa-
tion for near infrared reflectance measurement of apple fruit soluble
solids contents. Postharvest Biol. Technol. 30, 233–248.
References Peirs, A., Tirry, J., Verlinden, B., Darius, P., Nicolaı̈, B.M., 2003b. Effect
of biological variability on the robustness of NIR models for soluble
Brown, G.K., Segerlind, L.J., Summitt, R., 1974. Near-infrared reflectance solids content of apples. Postharvest Biol. Technol. 28, 269–280.
of bruised apples. Trans. ASAE 17, 17–19. Peirs, A., Scheerlinck, N., De Baerdemaeker, J., Nicolaı̈, B.M., 2003c.
Cheng, X., Tao, Y., Chen, Y.R., Luo, Y., 2003. NIR/MIR dual-sensor Starch index determination of apple fruit by means of a hyperspectral
machine vision system for online apple stem-end/calyx recognition. near infrared reflectance imaging system. J. Near Infrared Spectrosc.
Trans. ASAE 46, 551–558. 11, 379–389.
Clark, C.J., McGlone, V.A., De Silva, H.N., Manning, M.A., Burdon, Peirs, A., Schenk, A., Nicolaı̈, B.M., 2005. Effect of natural variability
J., Mowat, A.D., 2004. Prediction of storage disorders of kiwifruit among apples on the accuracy of vis–NIR calibration models for
(Actinidia chinensis) based on visible–NIR spectral characteristics at optimal harvest date predictions. Postharvest Biol. Technol. 35, 1–13.
harvest. Postharvest Biol. Technol. 32, 147–158. Retamales, J.B., Valdes, C., Dilley, D.R., 2000. Bitter pit prediction in
Ferguson, I.B., Watkins, C.B., 1989. Bitter pit in apple fruit. Hort. Rev. apples through Mg infiltration. Acta Hort. 512, 169–179.
11, 289–355. Saranwong, S., Sornsrivichai, J., Kawano, S., 2004. Prediction of ripe-
Lammertyn, J., Nicolaı̈, B.M., De Smedt, V., De Baerdemaeker, J., 1998. stage eating quality of mango fruit from its harvest quality mea-
Non-destructive measurement of acidity, soluble solids and firm- sured nondestructively by near infrared spectroscopy. Postharvest Biol.
ness of Jonagold apples using NIR-spectroscopy. Trans. ASAE 41, Technol. 31, 137–145.
1089–1094. Slaughter, D.C., 1995. Nondestructive determining of internal quality in
Little, C.R., Holmes, R.J., 1999. In: Faragher, J. (Ed.), Storage Tech- peaches and nectarines. Trans. ASAE 38, 617–623.
nology for Apples and Pears. Post Harvest Application of Calcium. Upchurch, B.L., Affeldt, H.A., Hruschka, W.R., Norris, K.H., Throop,
Institute for Horticultural Development Agriculture, Victoria, Knox- J.A., 1990. Spectrophotometric study of bruises on whole, ‘Red Deli-
field, Australia, pp. 202–237. cious’ apples. Trans. ASAE 33, 585–589.
Lötze, E., 2005. Pre-harvest determination of bitter pit potential in apples. Upchurch, B.L., Affeldt, H.A., Hruschka, W.R., Throop, J.A., 1991. Opti-
Dissertation Presented for the Degree of Doctor of Philosophy (Agri- cal detection of bruises and early frost damage of apples. Trans. ASAE
culture) at the University of Stellenbosch, South Africa. 34, 1004–1009.
Lotz, E., 1996. Control of physiological post-harvest disorders. In: Com- Upchurch, B.L., Throop, J.A., Aneshansley, D.J., 1994. Influence of time,
brink, J. (Ed.), Integrated Management of Post Harvest Quality. Agri- bruise-type, and severity on near-infrared reflectance from apple sur-
cultural Research Council-Infruitec, Stellenbosch, South Africa, pp. faces for automatic bruise detection. Trans. ASAE 37, 1571–1575.
43–49. Wen, Z., Tao, Y., 2000. Dual-camera NIR/MIR imaging for stem-
Lu, R., 2003. Detection of bruises on apples using near-infrared hyper- end/calyx identification in apple defect sorting. Trans. ASAE 43,
spectral imaging. Trans. ASAE 46, 523–530. 449–452.
Næs, T., Isaksson, T., Fearn, T., Davies, T., 2004. A User-Friendly Wooldridge, J., February 1999. Bitter pit in apples: effect of physical and
Guide to Multivariate Calibration and Classification. NIR Publica- chemical soil factors. In: Deciduous Fruit Grower, pp. s7–s10.
tions, Charlton, Chichester, UK. Woolley, J.T., 1971. Reflectance and transmittance of light by leaves.
Peirs, A., Lammertyn, J., Ooms, K., Nicolaı̈, B.M., 2000. Prediction of Plant Physiol. 47, 656–662.
the optimum picking date of different apple cultivars by means of Xing, J., Landahl, S., Lammertyn, J., Vrindts, E., De Baerdemaeker, J.,
vis/NIR-spectroscopy. Postharvest Biol. Technol. 21, 189–199. 2003. Effects of bruise type on discrimination of bruised and non-
Peirs, A., Scheerlinck, N., Touchant, K., Nicolaı̈, B.M., 2002. Compar- bruised ‘Golden Delicious’ apples by vis/NIR spectroscopy. Posthar-
ison of Fourier transform and dispersive near infrared reflectance vest Biol. Technol. 30, 249–258.You can also read