Optimizing LOSOM's Preferred Alternative to Protect Lake Okeechobee Health
←
→
Page content transcription
If your browser does not render page correctly, please read the page content below
August 19, 2021

    Optimizing LOSOM’s Preferred Alternative
           to Protect Lake Okeechobee Health
                                                                by Paul Gray, PhD, Audubon Florida

                                                    American Coots foraging on submerged aquatic vegetation
                                                                 (SAV) in Lake Okeechobee. Photo: Paul Gray

                                      Executive Summary

In July 2021, the US Army Corps of Engineers       We discuss the impacts of high and low Lake
selected Alternative CC as its Preferred           levels on key ecological considerations for
Alternative for the Lake Okeechobee System         optimization including submerged aquatic
Operating Manual (LOSOM) and is now seeking        vegetation, short-hydroperiod marsh
to optimize this alternative for all elements of   communities, sport and bait fisheries, water
the Greater Everglades Ecosystem. Ensuring         quality in pelagic and inshore areas and
that the benefits and adversity of operations      the littoral zone, and migratory and nesting
are shared equally will ensure no one portion      bird use. Optimization to safeguard these
of the system is harmed unduly or irreparably      ecosystem functions would reduce the number
until the promise of CERP is realized.             of deep water events and ensure regular
                                                   drawdowns during the dry season.
Audubon has a long history and expertise
in the ecology of Lake Okeechobee and has          Summary considerations for optimization of
synthesized the literature and impacts of past     the Preferred Alternative are included on page
operation schedules to inform the Corps’           12 of this report.
consideration with to regard to this central
element of the system.
                                                                                                       1
Introduction
    Tentatively Selected Plan CC was designated as the Preferred Alternative by the USACE on August
    9, 2021, and will move forward with optimization toward a Final Alternative. Optimization includes
    considering all ecosystems and human infrastructure in the region. In Audubon’s August 6, 2021
    comment letter, we discussed harmful and beneficial releases from the Lake. This document focuses
    narrowly on the optimization process for Lake Okeechobee, one of many valuable south Florida
    resources.

    Lake Okeechobee has had many regulation schedules in its history with different characteristics (see
    Havens 2018). In 1978, the deepest schedule ever was implemented, causing deep-water problems in
    the Lake. As a result, a somewhat lower schedule (Run 25) was adopted in 1992. Problems continued;
    WSE was adopted in 2000 to further lower the lake. That schedule also created deep-water problems,
    which combined with safety concerns about the Hoover Dike, led to LORS08 (2008), the lowest lake
    schedule since before 1978. LORS08 was better for Lake health but allowed the Lake to reach 16 feet six
    years in a row, further degrading the Lake.

    Now that Hoover Dike repair is imminent, the USACE is developing a new schedule that can consider
    improved dike safety. The Preferred Alternative, in its present form, will result in a deeper Lake on
    average than LORS08. The frequent deep periods of this Preferred Alternative will not be as chronic as
    the very harmful schedules of the 1980s and 1990s, and the Preferred Alternative also includes more low
    water periods making it less onerous; nevertheless, harmful impacts appear imminent. This white paper
    provides a literature review and analysis of deep-water scenarios on the ecology of Lake Okeechobee
    that may assist the Corps in optimizing the Preferred Alternative to reduce harm to this and other
    Everglades resources.

                                                                        Table of Contents

    Executive Summary.........................................................................................................................2
    Lake O
           High Lake levels...................................................................................................................2
           The Atlantic Multi-decadal Oscillation and the 52-year Period of Record.........3
           Submerged Aquatic Vegetation and Fisheries...........................................................4
           Deep Water, the Pelagic Algal Community, and Fisheries......................................8
           SAV and Nutrient Effects in the Littoral Zone............................................................8
           Moist Soil and Wet Prairie Plant Communities...........................................................9
           Bird Communities................................................................................................................9
    		Wading Birds............................................................................................................9
    		Waterfowl.................................................................................................................11
    		            Eastern Black Rail...................................................................................................11
    		Migratory Shorebirds.............................................................................................11
    		Snail Kites..................................................................................................................11
           The Importance of Drawdowns.......................................................................................12
    Conclusions on Optimizing the Preferred Alternative for Lake Okeechobee................12
    Literature cited.................................................................................................................................13
    Appendix 1.........................................................................................................................................16

2
High Lake Levels

An initial warning sign of in-lake problems from the Preferred Alternative is the frequency of hitting
17-foot levels. The Lake is projected to reach this level 10 times1 in the 52-year period of record (POR).
When the lake reaches 17 feet, harm is significant. This is because deeper water increases stress on
plants, but also because the lake requires drawdown periods of months of time to reach non-harmful
levels of around 15 feet again. The combination of depth and duration make 17 feet an extreme harm
threshold.

The RECOVER Stage Envelope performance measure (2020) for the Lake summarizes impacts of hitting
17 feet as:
      “2.2.1 Extreme High
      Extreme high stages (>17 ft [5.18 m]) allow wind-driven waves to directly impact the nearshore emergent
      and submerged plant communities, causing physical uprooting and creation of organic berms that
      impede hydrologic connectivity and movement of fish and wildlife (Havens and Gawlik 2005). High
      stages promote the transport of suspended solids and associated nutrients from the mid-lake region
      (where unconsolidated sediments are thickest) into the shoreline regions; reducing water clarity and light
      penetration, increasing nutrients, and reducing SAV and emergent plant densities (further destabilizing
      sediments and releasing more nutrients) (James and Havens 2005). High stages also allow deposition
      of unconsolidated mud into nearshore regions, covering sand and peat sediments and reducing their
      suitability for SAV. High stages transport nutrient-rich water into higher elevation littoral marshes where
      changes in periphyton biomass and taxonomic structure can occur, as well as expansion of invasive
      vegetation like cattail (Typha spp.). High stages reduce coverage of woody species that are important
      for wading bird and snail kite nesting, promote conversion of spikerush (Eleocharis spp.) prairies to lily
      habitat, and reduce coverage of high marsh grasses like cordgrass (Spartina bakeri) (Zhang and Welch
      2018). High stages reduce foraging habitat and prey density for wading birds (Smith et al. 1995) and
      reduce nesting effort for both wading birds (Chastant et al. 2017) and snail kites (Fletcher et al. 2017).
      Wading bird foraging is limited by water depth, and virtually the entire marsh is too deep for even
      long-legged wading birds (e.g. great egrets, great blue herons, woodstorks) at stages >16.0 ft (4.88 m).
      Associated changes in habitat structure, like loss of SAV and associated prey, also reduce fish diversity,
      populations, and biomass (Rogers and Allen 2008). Overall, high lake stages result in loss of submerged
      plants, low-elevation emergent plants, reductions in fish populations, undesirable shifts in marsh
      vegetation composition (Sharfstein and Zhang 2017), and shifts in the macroinvertebrate community to
      those representative of disturbed ecosystems (Warren et al. 1995).”

The Atlantic Multi-decadal Oscillation and the 52-year Period of Record

Having the Preferred Alternative projected to have an overall return interval of reaching 17 feet once
every 5 years (10 years of the 52-year period of record) is troubling, but closer examination of the
patterns reveals greater concerns. A prominent climate pattern for Florida is the Atlantic Multi-
decadal Oscillation (AMO). The Atlantic Ocean gets relatively warmer and cooler over periods of
decades and when in the warm phase, the extra energy in the ocean results in Lake Okeechobee
receiving an average of about one-and-a-half times more runoff than in cool phases (Enfield et al.
2001, SFWMD monthly hydrologic outlooks2). This pattern shows strongly in modeling for the
Preferred Alternative. For the 30-year period from 1965-1994, the cool/dry phase, the Preferred

1      The high level in 2013 was projected as 16.9 feet and it is included as one of the 10 events.
2      See slide 1 of: https://www.sfwmd.gov/sites/default/files/documents/Hydrologic_Outlook_
July_13_2021.pdf.
                                                                                                               3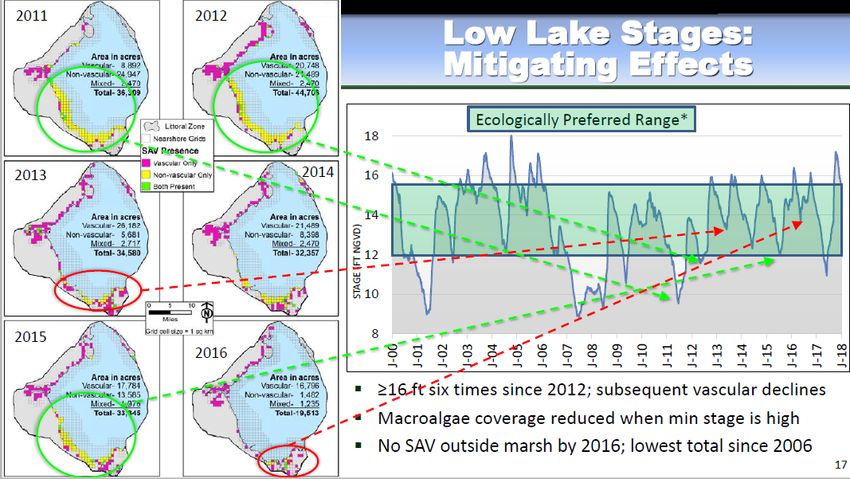
Alternative projects Lake Okeechobee to hit 17 feet just 4 times, one in 8 years (Fig. 1). For the 22-
    year warm/wet phase years from 1995-2016, the Lake hits 17 feet 6 times, a once in 3.7-year return
    interval. And while the exact cause of the wet/dry pattern has been debated (e.g., Qin et al. 2020),
    the existence of the pattern is agreed upon and shows prominently in the 52-year POR.

    Because the warm and cool phases of the AMO have statistically different lake inflows from each
    other, using averages of the full 52-year POR gives poor predictions of how selected alternatives will
    will perform. First, averaging a wet period with a dry period yields an “in between” number that
    does not reflect conditions in either period. Second, about 60% of the years from 1965 to 2016 POR
    are dry years, further “drying out” predictions for a future that as of now, is in the warm/wet phase
    of the AMO. In the following analyses, Audubon looks at the warm/wet phase for future predictions
    because that is the pattern Florida is in.

    As explained below, once Lake Okeechobee reaches 17 feet, substantial areas of plant communities
    are drowned, triggering cascading impacts on fisheries, water quality, and remaining marsh
    vegetation. Figure 1 assumes a “recovery interval” of about four years but considering the last 17-
    foot event on Okeechobee was Hurricane Irma, four years ago, and recovery remains marginal, four
    years is likely a shorter recovery period than reality.

      Fig 1. Each year that the Lake is projected to reach 17 feet is denoted by a vertical black bar. The preponderance of
      bars on the right side of the graph compared with the left is due to AMO patterns and with 4-year recovery periods
      in red, show the greater harm to the Lake. Specifically, in the AMO warm time frame, 22 years from 1995-2016,
      only 6 years might be considered non-impaired for SAV and fisheries.

    Submerged Aquatic Vegetation and Fisheries

    Reaching 17 feet is considered extremely damaging partly because it causes significant reductions
    in the ~40,000 acre submerged aquatic plant community (SAV, Fig. 2, Fig. 3), that can take years to
    recover (RECOVER 2020). The RECOVER 2016 goal for SAV in Lake Okeechobee was 50,000 acres of
    vascular and non-vascular plants in (RECOVER 2016). After Hurricane Irma, the total SAV acreage

4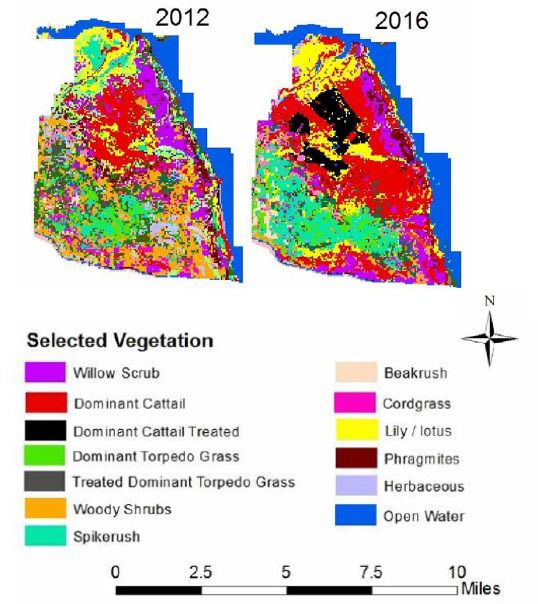
Figure 2. Three major commu-
                                                                 nities in Lake Okeechobee. The
                                                                 Nearshore community is where
                                                                 most submerged aquatic plants
                                                                 grow and has recently ranged
                                                                 from 46,000 acres of plants in
                                                                 2009 (Zhang and Scharfstein
                                                                 2012) to only about 5,000 acres
                                                                 in 2018, the year after Hurricane
                                                                 Irma filled the Lake to above 17
                                                                 feet.

acreage dropped to about 5,000 acres. The Lake
reached optimal drawdown levels near 11 feet
the two years after Irma, 2019 and 2020, yet SAV
levels had only reached 26,000 acres by 2020.
And hitting just 16.45 feet in 2020 caused another
loss of SAV, preliminarily estimated loss of about
12,000 acres, leaving about 14,000 acres in 2021
(Lawrence Glenn to Governing Board, August 12,
2021). Thus, four years after Hurricane Irma, the
Lake only has about 14,000 acres, about one-third
of the SAV goal.

              Fig 3. Eel grass (in foreground) is one species
             of submerged aquatic vegetation (SAV) in Lake
         Okeechobee that enhances water quality and is the
         heart of the world-renowned largemouth bass and
                                      black crappie fisheries.

                                                                                                 5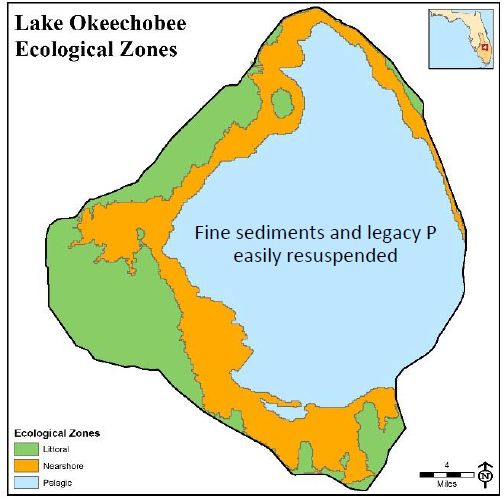
Figure 4. SAV and corresponding Hydrograph of Lake Okeechobee showing a steady decline in SAV acreage of Lake
Okeechobee when hitting 16 feet in consecutive years, from 44,700 acres in 2012 to 19,600 by 2016 (Welch 2018). The lack
of drawdowns to the 12-foot range also contributed to the inability of the SAV to bounce back.

    Lake levels do not need to reach 17 feet to create significant degradation. Lake levels above 15 feet
    begin causing harm to plant communities (SFWMD 2010, Table 1). LORS08 allowed the Lake to
    reach 16 feet or deeper for 6 consecutive years which lead to a steady erosion in acres of SAV in Lake
    Okeechobee. Specifically, SAV acres decreased from 44,000 acres to 19,000 acres between 2012-2016
    (Fig. 4, Welch 2018).

    The SAV plant community is critical to the largemouth bass fishery in the lake and when it has
    severe reductions, the bass fishery crashes too (Havens et al. 2005). Fig. 5 shows such a relationship
    between SAV coverage and bass numbers. Fig. 6 has more FWC data showing depressed fishery
    populations in Lake Okeechobee four years after Hurricane Irma.

6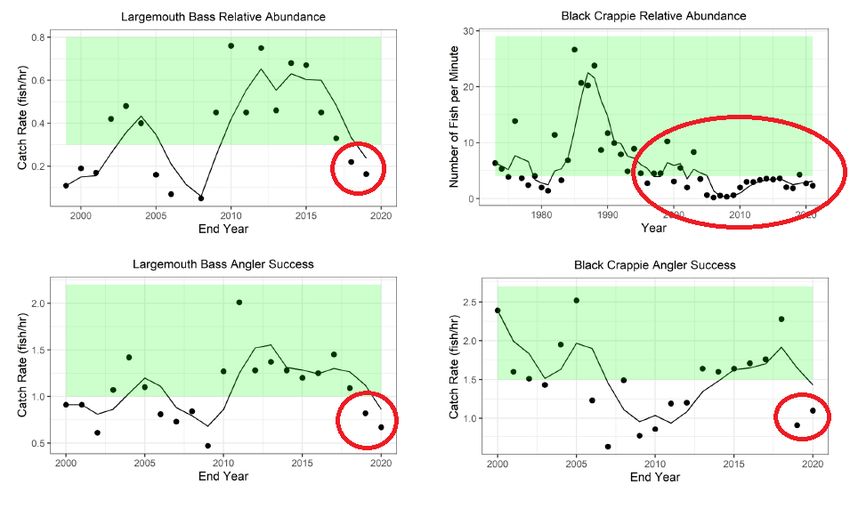
Fig. 5. Bass numbers in Lake Okeechobee increased in 2003 and 2004 as submerged (SAV) vegetation increased
until both crashed with the hurricanes of 2004-05 that took Okeechobee to 17+ foot levels. SAV acres increased
after the 2007-08 drought and bass did too, until a persistent decline in SAV, and bass, occurred as a result of Lake
Okeechobee hitting 16 feet every year from 2013-2017. The SAV plant community is critical to the largemouth bass
fishery in the lake and when it has severe reductions, the bass fishery crashes too (Havens et al. 2005, graph from
FWC 2021).

Figure 6. Largemouth bass and black crappie are the two most important recreational fisheries in Lake
Okeechobee and remain at extremely low levels (red circles; green shading is desirable) years after Hurricane
Irma in 2017 (FFWCC 2021). Red circles highlight recent low numbers. Black crappie had an apparent population
crash in the early 2000s (especially after 2004-05) and have yet to fully recover.                                      7

Deep Water, the Pelagic Algal Community, and Fisheries

    A deeper lake tends to have higher levels of turbidity and increased harmful algal blooms (Maceina
    1993, Havens et al. 1994, Havens et al. 2003). Green algae and diatoms are considered “beneficial”
    algae because they form a good food chain base and thrive in cleaner waters. With nutrient
    pollution and turbidity, “good” algae give way to cyanobacteria who feed on the nutrients and can
    float to the surface to obtain sunlight. Because cyanobacteria are toxin formers, they make a poorer
    base of the algal food chain and can harm fisheries. Both threadfin shad and gizzard shad are
    abundant in the pelagic zone and feed on algae. Shad in turn are key forage for the largemouth bass
    and black crappie fisheries in the Lake (Welch et al. 2021). Thus, having the Preferred Alternative
    keep Okeechobee deeper more often will tend to result in a less desirable algal community with
    trophic impacts to the most important bait and game fish in the Lake.

    SAV and Nutrient Effects in the Littoral Zone

    The littoral zone is where emergent aquatic vegetation dominates (EAVs—grasses, sedges, “flags,”
    and other plants growing out of the water). The littoral zone is buffered from the nutrient-enriched
    water of the pelagic zone by the SAV zone (see Fig. 2). Not only do the SAVs protect the EAV zone
    by cleaning the water in their zone, they physically stop wave and water flow penetration past the
    SAV zone. When the SAV zone is lost that protection is lost. During deep water events, nutrient-
    enriched pelagic water penetrates the EAV zone and contributes to the spread of cattail (Fig 7). This
    process not only degrades marsh habitat, it is unclear if the cattail encroachment is reversible even
    after SAVs recover.

    For perspective, Florida has spent hundreds
    of millions of dollars on STAs, human-built
    marshes that function like smaller scale Lake
    Okeechobee’s SAV zones to clean water. Lake
    Okeechobee can support a large-scale plant
    community and its water cleansing services
    for free, if we choose to sustain it.

      Figure 7. Deep Okeechobee levels (hitting the
      16 foot range from 2013 through 2016) caused a
      decline in the SAV zone and buffering capacity,
      contributing to massive cattail expansion (red) in
      the Moonshine Bay region of Lake Okeechobee
      (Welch 2018). It is unknown if such impacts are
      reversible.

8
Moist Soil and Wet Prairie Plant Communities
Lake Okeechobee was deeper and larger in its pristine state. It would increase in area in wet weather
and contract in dry, maintaining shallow edges and short hydroperiod wetlands in any pattern.
Construction of the Herbert Hoover Dike along the 15-foot (Merriam) meander line on the upstream
border of the Lake truncated the ability of the lake to spread out when getting deeper. Today, when
levels rise above 15 feet, the water “stacks up” along the dike and there is no shallow water in the
Lake.
Each wetland plant species has unique flooding requirements and grows along gradients of
hydroperiod (Van der Valk 1981). In a pristine Okeechobee, plant communities could move up and
down slope if hydroperiods changed over time. Today when Okeechobee rises above 15 feet, not
only does it stack water in the short hydroperiod habitats, it lengthens their hydroperiod and can
eliminate these habitat types altogether, including the species that depend upon them.
Short hydroperiod communities have a high percent of annual plants that need mudflats to
germinate and are invaluable to waterfowl, songbirds (moist soil produces large seed crops for
migratory seed-eating birds), rails, and other bird species (Fredrickson and Taylor 1982, Johnson and
Montalbano 1984). Thus, consideration of biodiversity of Lake Okeechobee requires consideration of
short hydroperiod habitats and the impacts that occur above 15-foot lake levels.
Specifically, the Preferred Alternative is projected to have the Lake above 14 feet about 40% of the
time, creating concerns about how many years this plant community will be able to complete its
“mudflat-dependent” life cycle. In 1978, when the Lake’s regulation schedule changed to one that set
15.5 feet as the lowest level, Sincock (1957) predicted it would greatly diminish the moist soil zone.
In 1981, just three years after the water level rise, Milleson (1987) compared vegetation community
changes before and reported that “The most apparent changes were elimination of the spikerush
Eleocharis cellulosa community, [and] expansion of the cattail Thypha domingensis zone…”.
Similarly, the Lake Okeechobee Littoral Zone Technical Group (LOTZAG 1988) concluded the high
water had induced changes including, “…loss of wading bird feeding habitat, decline in willow, and
loss of moist soil plant production” [emphasis ours]. The Preferred Alternative is not projected to
deep as the 1978 schedule was, but the Preferred Alternative’s projections for deeper water for longer
periods of time could create similar losses.
Bird Communities
Wading Birds
The Everglades are famous for wading birds and Lake
Okeechobee hosts large numbers of wintering and nesting
birds. During the period of 1957-1978, when water levels
were generally held below 15 feet, Okeechobee hosted an
average of 4,767 wading bird nests. From 1979-1988 when
levels were held generally above 15.5 feet, nesting dropped
to an average of 1,928. David (1994a and 1994b) attributed Snowy Egret. Photo: Paul Gray
the decline to deeper levels that reduced foraging areas and
degraded the willow heads that held nesting. Deeper water
near nests leads to longer foraging flights, which are increasingly energetically costly for nesting
birds (Smith 1995, Smith et al. 1995).
9The small Egretta species in south Florida (Snowy Egret, Little Blue Heron and Tricolored Heron)
have experienced “consistent and steep declines in nesting numbers over recent years” (Cook and
Baranaski 2020). Lake Okeechobee often hosts large percentages of their total nesting effort. In
2017, Lake Okeechobee held 54% of Tricolored Heron nests and 71% of Snowy Egret nests in the
Greater Everglades Ecosystem (Cook and Baranski 2018). Nesting conditions in south Florida change
annually but these numbers were not flukes, in 2018, the Lake Okeechobee held 40% of all Snowy
Egrets nests and in 2019, Okeechobee hosted 21% of all the Tricolor Heron nests (Cook and Baranski
2019, 2020).
Table 1. Acres of area with water levels six inch-
es or less in Okeechobee. Note that at 12.5 feet
there are 20,000 acres of available habitat for
wading birds and at 12 feet another 23,000 acres
is available. Reaching these levels in the spring
maximizes foraging opportunities for wading
birds in Okeechobee.
Part of the justification for the stage envelope being between 12-15 feet is its match with wading bird
nesting ecology (RECOVER 2020). Water depths below 6 inches are widely considered suitable for
most wading bird feeding and Table 1 shows the number of acres of water less than 6 inches deep at
different Lake elevations. Note that levels above 13 feet only make a cumulative total of about 38,000
acres available. Between 12-13 feet, another 43,000 acres of habitat become suitable, making this
depth range a sweet spot for habitat availability. Thus, it is very desirable to lower the lake to around
12 feet for optimal wading bird foraging opportunities over the nesting season. The Preferred
Alternative does not drop below 13 feet in 8 of 22 years in the AMO warm period (Table 2).
Table 2. The Preferred Alternative is projected
to reach a favorable drawdown level between 11-
13 feet in 9 years of the 22 year period of record.
In 8 years, the lake stays above 13 feet, and in 5
years drops below 11 feet--years that are too high
and low, respectively, for optimal wading bird
nesting opportunity.
10Waterfowl Florida hosts large numbers of migratory waterfowl during the winter from all over North America. Ring-necked Ducks are the most harvested duck in Florida and because they feed heavily on SAV (especially hydrilla), will fare poorly with projections of SAV loss. Most of the wintering waterfowl on the lake are dabbling ducks (Anatini) that generally require water 6 inches or less for foraging (White and James 1978, Johnson and Montalbano 1984). Like wading birds, waterfowl benefit from drawdowns across most of the marsh. The moist soil community is highly utilized by dabbling ducks (Fredrickson and Taylor 1982) and its protection is important to their use of the Lake. Eastern Black Rail: The Eastern Black Rail was listed as “threatened” in 2020 by the United States Fish and Wildlife Service 3 and is a species with “Greatest Conservation Need” for the Florida Fish and Wildlife Conservation Commission (FFWCC 2019). With recent population declines as high as 90%, it is thought that Florida may host most of the remaining population (Atlantic Coast Joint Venture 2020). This diminutive bird inhabits wetland areas less than one inch deep. As covered in the “moist soil” section of this document, the negative effects of deeper water on that community type and having the lake too deep 25% of the time (
for most vertebrate species that frequent the Okeechobee marshes, such as frogs, salamanders,
 snakes, round-tailed muskrats, and many birds. Plant diversity was similarly limited. Although
 the net results for Kites was good, this is a very poor result for Okeechobee marsh biodiversity and
 health, and not an acceptable goal for future marsh management.

 It remains uncertain how the Preferred Alternative will perform for Snail Kites. Water level
 recession rates during nesting will need special attention, as noted in the updated LORS08 biological
 opinion (USFWS 2018). And along with doubts about exotic snail reliability, native snails have not
 returned to Okeechobee in numbers that could support viable Kite nesting. Okeechobee’s wetland
 habitats will continue to need adaptive management to sustain Snail Kites.

 The Importance of Drawdowns

 Wetlands are characterized by being wet part of the time and dry the other. Unless the wetland is a
 peat-forming system, regular drawdowns are essential for marsh function. First, drawdowns allow
 decomposition of organic material4, either through oxidation or fires, processes that keep the bottom
 mostly mineral (sand/rock in Okeechobee). Many wetland plant seeds must germinate on mudflats
 and thrive with reflooding. Some plants, such as SAVs, will germinate underwater but need sunlight,
 which in a turbid lake like Okeechobee, requires a drawdown as was coordinated by the Corps in 2019
 to help SAV recover from Hurricane Irma. And as mentioned above, drawdowns also are essential for
 avian use of the marsh. In essence, drawdowns are necessary and are the antidote to harmfully high
 lake levels (Havens ad Gawlik 2005, RECOVER 2020). The Preferred Alternative allows more and
 better drawdowns than previous high schedules. However, the Zone F line, that would cut of flows
 to the Everglades and Caloosahatchee at 13 feet, also reduces drawdown effectiveness in the Lake,
 simultaneously harming all these systems. Audubon Florida previously recommended eliminating
 Zone F altogether (App. 1).

 Conclusions on Optimizing the Preferred Alternative for Lake Okeechobee

 This document traces trends in Lake Okeechobee as a result of varying water levels. Take away
 considerations for the ecology of Lake Okeechobee in the optimization of the Preferred Alternative
 include:

 • Stopping environmental releases at the 13-foot line of Zone F would hamper essential Lake-
 recovering drawdowns while harming downstream ecosystems, therefore Zone F should be removed.
 • The Zone A line already is very harmfully high and should not be raised.
 • Because of the AMO phenomena, the 52-year period of record may underestimate harmful high
 water events, underestimate harmful estuary releases, and overestimate water shortage cutback
 severity.
 • Because SAV recovery times take years, reaching 17 feet more than once every eight years should be
 eliminated from the Preferred Alternative if the worst impacts to Lake Okeechobee’s ecology are to
 be avoided.

 ________
 4       Plants will not completely decompose under water due to low oxygen levels (anaerobic). In
 wetlands that do not dry, organics build up as peat. Lake Okeechobee’s marshes were accumulating
 organic material during the high lake levels of the 1980s and 1990s and those sediments were par-
 tially bulldozed from the lake bottom in the 2001 drought due to their undesirability.
12
• Levels above 15 feet can be harmful in all seasons.
• Levels less than 15 feet can be harmful during the dry season, especially if they preclude
drawdowns that are essential for marsh community health and bird foraging.
• Harm to plant communities translates to animal communities.
• Harm to plant communities translates to water quality degradation.
• Deep water reduces avian use of the Lake: The lower the spring dry down, the more acres of avian
habitat become available.
• The Preferred Alternative will need flexibility in its water control manual to enable the Corps
to adapt to unpredictable but certain damaging future events and equitably manage for multiple
interests in ever-changing conditions and weather patterns.

Optimization is not just an exercise in equity, it is an investment in the resilience of the entire
Everglades system. Ensuring that the benefits and adversity of operations are shared equally will
ensure no one portion of the system and the organisms that rely on it, are harmed irreparably until
the promise of CERP is realized.

Literature Cited

Atlantic Coast Joint Venture. 2020. Eastern Black Rail Conservation Plan for the Atlantic Coast. ww.acjv.org.

Beck, T. 2020. Snail Kite update. Presentation to Snail Kite Coordinating Committee Fall meeting. Florida
Fish and Wildlife Conservation Commission.

Chastant, J. E., and D. E. Gawlik. 2018. Water level fluctuations influence wading bird prey availability and
nesting in a subtropical lake ecosystem. Waterbirds. 41:35-45.

Chastant, J.E., Petersen, M.L., Gawlik, D.E. 2017. Nesting substrate and water-level fluctuations influence
wading bird nesting patterns in a large shallow eutrophic lake. Hydrobiologia 788, 371–383.

Cook, M. I, and M. Baranski. Eds. 2018. South Florida Wading bird report. Vol. 23. South Florida Water
Management District. West Palm Beach, FL.

Cook, M. I, and M. Baranski. Eds. 2019. South Florida Wading bird report. Vol. 24. South Florida Water
Management District. West Palm Beach, FL.

Cook, M. I, and M. Baranski. Eds. 2020. South Florida Wading bird report. Vol. 25. South Florida Water
Management District. West Palm Beach, FL.

David, P. G. 1994a. Wading bird nesting at Lake Okeechobee, Florida: An historic perspective. Colonial
Waterbirds 17:69-77.

David, P. G. 1994b. Wading bird use of Lake Okeechobee relative to fluctuating water levels. Wilson Bull.
106:719-732.

Enfield, D. B., A. M. Mestas-Nunez, and P. J. Trimble. 2001. The Atlantic multi-decadal oscillation and its
relation to rainfall and river flows in the continental U.S. Geophysical Research Letters 28:2077-2080. doi:
10.1029/2000GL012745

Fletcher, R., E. Robertson, B. Jeffery, C. Poli, and S. Dudek. 2018. Snail Kite demography: 2018 report on
2017 breeding season. For the US Army Corps of Engineers, Jacksonville, FL.

                                                                                                                13
Fletcher, R., C. Poli, B. Jeffery, A. Gonzalez, J. Cullen and M. Beatty. 2021 Population trends in snail kites. Presentation to Snail Kite Coordinating Committee Spring meeting. University of Florida. Florida Fish and Wildlife Conservation Commission. 2019. Florida’s Wildlife Legacy Initiative: Florida’s State Wildlife Action Plan. Tallahassee, Florida. Florida Fish and Wildlife Conservatino Commission. 2021. Presentation to LOSOM PDT. July 7, 2021. Fredrickson, L. H., and T. S. Taylor. 1982. Management of seasonally flooded impoundments for wildlife. U.S. Fish and Wildl. Serv. Res. Publ. 148, Washington, D.C. Gray, P. N., B. Pranty, G. R. Schrott, and J. W. Tucker. 2009. Shorebird and larid use of mudflats at Lake Okeechobee, Florida, during drought conditions. Florida Field Naturalist 37:33-44. Havens, K. E. 2018. Managing high water levels in Florida’s largest lake: Lake Okeechobee. TP-232. Florida Sea Grant College Program, UF/IFAS Extension, Gainesville. Havens, K. E, and D. E. Gawlik. 2005. Lake Okeechobee conceptual ecological model. Wetlands 25: 908-925. Havens, K. E., D. Fox, S. Gornak, and C. Hanlon. 2005. Aquatic vegetation and largemouth bass population responses to water-level variations in Lake Okeechobee, Florida (USA). Hydrobiologia 539:225–237. Havens, K.E., Hanlon C, James RT, 1994. Seasonal and spatial variation in algal bloom frequencies in Lake Okeechobee, Florida, USA. Lake and Reservoir Management, v10, p139-14 Havens, K.E., James RT, East TL, Smith VH, 2003. N: P ratios, light limitation, and cyanobacterial dominance in a subtropical lake impacted by non-point source nutrient pollution. Environmental Pollution, v122, p379- 390 Johnson, F. A., and F. Montalbano. 1984. Selection of plant communities by wintering waterfowl on Lake Okeechobee, Florida. J. Wildl. Manage. 48:174-178. Johnson, K. A., M. S. Allen, and K. E. Havens. 2007. A review of littoral vegetation, fisheries and wildlife responses to hydrologic variation at Lake Okeechobee. Wetlands 27:110-126. Lake Okeechobee Littoral Zone Technical Group. 1988. Assessment of emergency conditions in Lake Okeechobee littoral zone: recommendations for interim management. SFWMD. West Palm Beach, FL. Maceina MJ, 1993. Summer Fluctuations in Planktonic Chlorophyll a Concentrations in Lake Okeechobee, Florida: The Influence of Lake Levels. Lake and Reservoir Management, v8, pg1-11, https://doi. org/10.1080/07438149309354453 Martin, J., W. Kitchens, and M. Speirs. 2003. Snail Kite demography annual report: 2003. United States Fish and Wildl. Serv., Vero Beach, FL. Milleson, J. F. 1987. Vegetation changes in the Lake Okeechobee littoral zone, 1972-1982. Technical Publication 87-3. South Florida Water Management District, West Palm Beach, FL. 33 pp. Pesnell, G. L. and R. T. Brown, III. 1976. The vegetation of Lake Okeechobee, Florida, Map, 3 pp. Central and Southern Florida Flood Control District, West Palm Beach, FL. Qin, M., A. Dai, and W. Hua. 2020. Aerosol-forced multidecadal variations across all ocean basin in models and observations since 1920. Science Advances. 6:eabb0425. 14
RECOVER. 2016. Lake Okeechobee Performance Measure: Nearshore region submerged aquatic vegetation
coverage. CERP System-wide Performance Measure.

RECOVER. 2020. Lake Okeechobee Performance Measure: Lake Stage. CERP System-wide Performance
Measure.

Sincock, J. L. 1957. A study of the vegetation on the northwest shore of Lake Okeechobee. Report, Florida
Game and Fresh Water Fish Commission, Tallahassee, FL.

Sincock, J. L., J. A. Powell, R. K. Hyde, and H. E. Wallace. 1957. The relationship of the wintering waterfowl
populations of the Kissimmee River Valley to the hydrology, topography, distribution of the vegetation and the
proposed hydrological regulations. Florida Game and Freshwater Fish Commission, Tallahassee.

Smith, J. P. 1995. Foraging flights and habitat use of nesting wading birds (Ciconiiformes) at Lake
Okeechobee, Florida. Colonial Waterbirds 18:139-158.

Smith, J. P., J.R. Richardson, and M. W. Collopy. 1995. Foraging habitat selection among wading birds
(Ciconiiformes) at Lake Okeechobee, Florida, in relation to hydrology and vegetative cover. Archiv fur
Hydrobiologie, Advances in Limnology 45:247-285.

SFWMD. 2010. Final adaptive protocols for Lake Okeechobee Operations. West Palm Beach.

United States Army Corps of Engineers. 2021. Lake Okeechobee System Operating Manual (LOSOM):
Preliminary preferred alternative. Presentation July 19 Web Meeting.

United States Fish and Wildlife Service. 2018. Biological Opinion: Lake Okeechobee Regulation Schedule.
Vero Beach, FL.

Van der Valk, A. G. 1981. Succession in wetlands: a Gleasonian approach. Ecology 62:688-696.

Watts, B. D. 2016. Status and distribution of the eastern black rail along the Atlantic and Gulf Coasts of North
America. The Center for Conservation Biology Technical Report Series, CCBTR-16-09. College of William and
Mary/Virginia Commonwealth University, Williamsburg, VA. 148 pp.

Welch, Z. 2018. Lake Okeechobee stage effects on Lake ecology. Presentation to Committee on Independent
Scientific Review of Everglades Restoration Progress. February, West Palm Beach.

Welch, Z., J. Zhang, D. Taylor, and S. Olson. 2021. Lake Okeechobee Watershed protection plan annual
progress report. South Florida Environmental Report. Chapter 8B. South Florida Water Management
District, West Palm Beach.

White, D. H., and D. James. 1978. Differential use of fresh water environments by wintering waterfowl of
coastal Texas. Wilson Bull. 90:99-111.

Zhang, D., and B. Sharfstein. 2012. Lake Okeechobee Protection Plan. Chapter 8. South Florida
Environmental Report. South Florida Water Management District, West Palm Beach.

Audubon Florida protects birds and the places they need, today and tomorrow. Audubon works throughout the
Americas using science, advocacy, education, and on-the-ground conservation. State programs, nature centers,
chapters, and partners give Audubon an unparalleled wingspan that reaches millions of people each year to in-
form, inspire, and unite diverse communities in conservation action. A nonprofit conservation organization since
1905, Audubon believes in a world in which people and wildlife thrive.

                                              Everglades Restoration Program | P. O. Box 707 |Lorida, FL 33857
                                              Fl.audubon.org
                                                                                                                 15
Appendix 1 August 6, 2021 Dear Col. Kelly and Staff: Thank you for taking time to discuss LOSOM and the tentatively selected Alternative CC with Audubon Florida. Army Corps staff have done an exemplary job working through the possibilities and breaking boundaries on how we look at managing the system. We are excited at the chance to improve upon old practices. The resources and issues are complex, and we will send more detailed comments soon, but for now we write to summarize some main thoughts. Below are specific optimization recommendations for Alternative CC: Eliminate Zone F: Sending as much water south in a beneficial manner is widely recognized as a priority. Toward that end, eliminating Zone F altogether and allowing Zone E to extend down to the Water Supply Management Line would allow greater beneficial releases to both the Everglades, and Caloosahatchee Estuary, and help fulfill the Congressionally authorized purpose of enhancing “environmental effects to fish and wildlife.” Equitably distribute protection from harmful lake releases to both Estuaries: The St. Lucie is projected to receive about 30 harmful 2-week flow events in the 52-year period of record. The Caloosahatchee is projected to receive 445 harmful 2-week periods (which averages about 4 months of harmful releases per year). CC also gives the Caloosahatchee the largest volumes and loads of (algal feeding) nutrients from Lake Okeechobee of any of the alternatives. We recommend you change the release guidance to the St. Lucie in Zones D and E from “0cfs” to a range of “0-X cfs.” The variable “X” would be optimized to allow equitable releases to both estuaries when regulatory releases are required. Measure Estuary releases from the terminal structure: For the estuaries, flows should be measured at the terminal structure of the respective canals, S-80, and S-79. This accounts for additive estuary impacts by including both Lake and C-43 and C-44 watershed releases. Reduce 17-foot events in Lake Okeechobee to no more than once per 8 years: Deep water has proven, time and again, to create significant and long-lasting damage to the biota of Lake Okeechobee. The consequences of a degraded lake also present threats to the estuaries during emergency releases. The last 17-foot event was Hurricane Irma, four years ago, and the SAV community remains below coverage goals and the fisheries remain significantly depressed. Due to this long recovery time, we recommend not allowing any alternative to allow the Lake to reach 17 feet more often than once every 8 years.
Atlantic Multidecadal Oscillation:
Florida weather changed from a drier pattern to a wetter pattern in about 1995. This pattern
yields noticeably different system responses in the CC modeling, namely that Lake Okeechobee
reaches 17 feet in about 1 in 8 years in the dry period and one in 3.5 years in the wet. There are
competing theories of the cause of the pattern1, but the authors all agree the pattern exists. In
addition to looking at the 52-year period of record, the Corps should examine the wet phase of
the AMO period (1995-2016) for another view of the possible behavior of CC in the near term.
Thank you for consideration of these ideas, as always, we look forward to discussing any of this
with you further.

Sincerely,

Julie Wraithmell
Executive Director
Audubon Florida
Julie.wraithmell@audubon.org
 (850) 339-5009 mobile

1   Enfield, D. B., A. M. Mestas-Nunez, and P. J. Trimble. 2001. The Atlantic multi-decadal oscillation and
           its relation to rainfall and river flows in the continental U.S. Geophysical Research Letters
           28:2077-2080. doi: 10.1029/2000GL012745

Qin, M., A. Dai, and W. Hua. 2020. Aerosol-forced multidecadal variations across all ocean basin in
        models and observations since 1920. Science Advances. 6: eabb0425.
You can also read