PROVIDER PAY AND THE PANDEMIC - MGMA DATADIVE PROVIDER COMPENSATION - MAY 2021 - Medical Group ...
←
→
Page content transcription
If your browser does not render page correctly, please read the page content below

M AY 2 0 2 1

                MGMA DATADIVE PROVIDER COMPENSATION

                   PROVIDER PAY
               AND THE PANDEMIC          A N M G M A DATA R E P O R T
Table of Contents
                                   Introduction....................................................................3
                                   Trends..............................................................................4
                                    • Physician productivity............................................4
                                    • Provider compensation.........................................6
                                    • APP compensation.................................................6
                                   6 keys to medical practices’
                                   recovery amid the pandemic...................................7
                                   Redefining fair market value under Stark Law....10
                                   By Joe Aguilar, MBA, MPH, MSN, CVA, partner, HMS Valuation Partners

                                   Additional resources...................................................13

       MGMA DATADIVE PROVIDER COMPENSATION
       Balance compensation with productivity with the most reliable data in the industry. MGMA DataDive Provider
       Compensation is your go-to resource for any physician or advanced practice provider (APP) compensation
       decisions. Use it to understand the unique differences among physician-owned, academic and hospital-owned
       practice benchmarks across multiple regions, practice sizes and provider experience levels. Benchmarks include:

       •   Compensation (including total pay, bonus/incentives, retirement)
       •   Productivity (work RVUs, total RVUs, professional collections and charges)
       •   Benefit metrics (hours worked per week/year and weeks of vacation)

       Explore even more of what MGMA DataDive Provider Compensation offers.

             ABOUT MGMA
             Founded in 1926, the Medical Group Management Association (MGMA) is the nation’s largest association
             focused on the business of medical practice management. MGMA consists of 15,000 group medical
             practices ranging from small, private medical practices to large national health systems, representing more
             than 350,000 physicians. MGMA helps nearly 60,000 medical practice leaders and the healthcare community
             solve the business challenges of running practices so that they can focus on providing outstanding patient
             care. Specifically, MGMA helps its members innovate and improve profitability and financial sustainability, and
             it provides the gold standard on industry benchmarks such as physician compensation. The association also
             advocates extensively on its members’ behalf on national regulatory and policy issues.

             mgma.com

©MGMA. All rights reserved.                                                         2
Introduction
It took a once-in-a-lifetime public health crisis
to slow down America’s physicians.

Even with the COVID-19 pandemic shuttering some practices and capping elective procedures for
significant portions of the past year, the 2021 MGMA Provider Compensation and Production report
— reflecting data from more than 185,000 providers across more than 6,700 organizations — finds
compensation for most physician specialties was either flat or increased slightly during 2020
versus 2019 levels.

 2.6           %
                                                        1.25%
                     Increase in primary                                       Increase in advanced
                     care physician total                                      practice provider (APP) total
                     compensation, 2019 to 2020                                compensation, 2019 to 2020

Those numbers may not immediately reflect the pain felt by practices that were forced to respond in
the face of crisis. Data from specialist physicians for the report point to what most of us already know:
2020 took a major toll on a broad range of healthcare providers whose deference to safety and
science in weeks (and sometimes months) of shutdown orders strained the ability to serve their
patients in an industry in which access was already a major concern:

      -1.91           %
     Change in median total
                                       -0.89
                                        Change in median total
                                                               %
                                                                               -1.29               %
                                                                               Change in median total
   compensation for specialist         compensation for surgical            compensation for nonsurgical
    physicians, 2019 to 2020           specialists, 2019 to 2020              specialists, 2019 to 2020

This report offers a closer look at the data within 2021 MGMA DataDive Provider Compensation,
so that we can learn more crucial lessons from 2020 and position today’s medical practices for
continued recovery and sustainable success.

                                          We know all too well that the pandemic isn’t over...
                                                       Visit the MGMA COVID-19 Recovery Center for the latest tools,
                                                      content and insights for leading throughout the coming months.

                                                  3                                         ©MGMA. All rights reserved.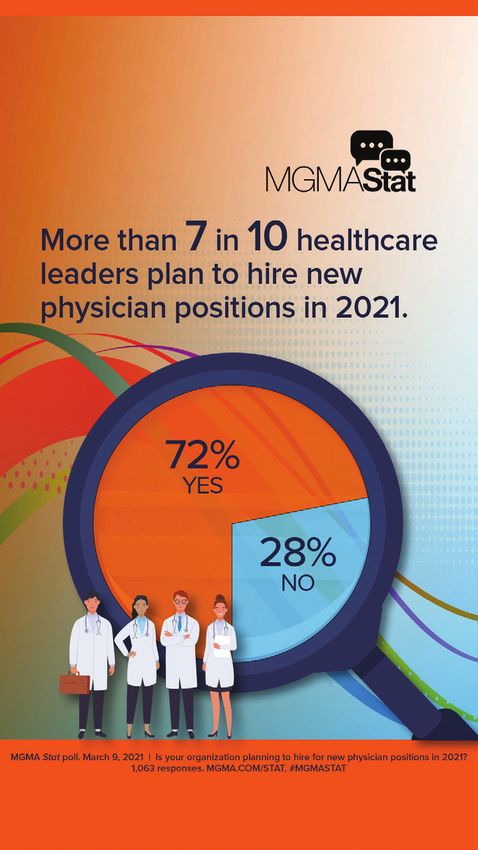
Trends
          PHYSICIAN PRODUCTIVITY
           KEY PRODUCTIVITY METRICS BY OWNERSHIP
                                                           Total encounters                                                  Work RVUs
                                          Physician owned             Hospital/IDS owned               Physician owned                 Hospital/IDS owned
           Primary care                           3,243                         2,653                          4,653                           4,280
           Surgical specialist                    1,801                         1,864                          7,914                           6,502
           Nonsurgical specialist                 3,451                         2,293                          6,297                           5,376

          Physician-owned practices report higher levels of productivity for many specialties in total encounters and
          work RVUs (wRVUs) in the 2021 MGMA Provider Compensation and Production report.

          Total encounters reflect the number of direct provider-to-patient interactions regardless of setting, including
          televisits and e-visits. The wRVUs also quantify productivity and take into account the complexity of the visits.

          WORK RVUs BY PRACTICE OWNERSHIP IN SELECTED SPECIALTIES

                                                                       Physician owned          Hospital/IDS owned

              12,000

              10,000

               8,000

               6,000

               4,000

               2,000

                   0
                          Cardiology       Dermatology      Gastroenterology   Hematology/         Neurology      Orthopedic surgery      Surgery           Surgery
                         (noninvasive)                                          Oncology                              (general)          (general)       (neurological)

                                                   Source: 2021 MGMA DataDive Provider Compensation (based on 2020 data)

          PRODUCTIVY BY PRACTICE OWNERSHIP, BY SPECIALTY GROUPING

              8,000

               7,000

              6,000                                                                                                                                   Primary care

              5,000                                                                                                                                  Surgical specialist

              4,000                                                                                                                                   Nonsurgical specialist

               3,000

              2,000
                                                                                                                                                 Source: 2021 MGMA
               1,000                                                                                                                             DataDive Provider
                                                                                                                                                 Compensation
                                                                                                                                                 (based on 2020 data)
                  0
                                Physician owned          Hospital/IDS owned          Physician owned           Hospital/IDS owned

                                         TOTAL ENCOUNTERS                                       WORK RVUs

©MGMA. All rights reserved.                                                              4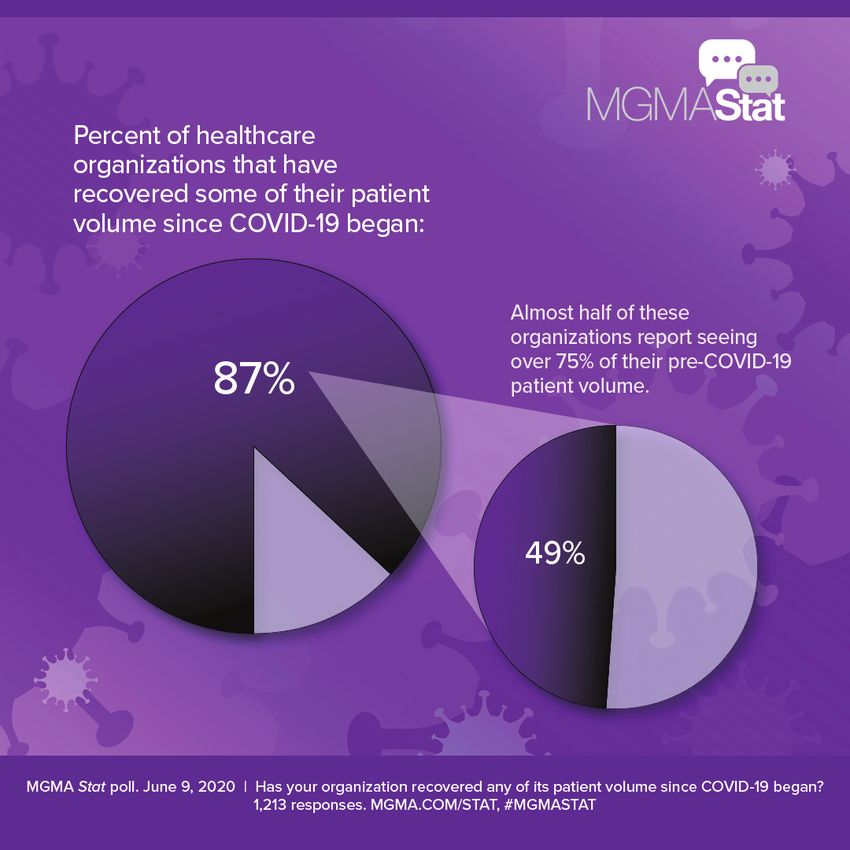
PRODUCTIVITY VARIATION BY OWNERSHIP: HOW
                                                    MUCH HIGHER/LOWER WERE KEY METRICS FOR
                                                    PHYSICIANS IN HOSPITAL-/IDS-OWNED PRACTICES
These findings give deeper insight into             VERSUS THOSE IN PHYSICIAN-OWNED PRACTICES?
similar findings derived from the 2020                                                               Total encounters            wRVUs
MGMA Monthly Survey launched in July                Cardiology: Invasive                                    +203                      +491
2020, which collected data at the provider          Cardiology (invasive-interventional)                     -200                 -3,431
level data and for the overall practice.            Cardiology (noninvasive)                                 -393                     -323
By June 2020, volumes began to rebound.             Dermatology                                             +366                      -1,137
The 2020 Monthly Survey data show                   Family medicine (without OB)                             -334                     -514

reported wRVUs stabilized after hitting             Gastroenterology                                        -1,066                     -69
                                                    Hematology/Oncology                                       -38                     -577
their lowest levels in April, with sizable
                                                    Hospitalist (internal medicine)                          +68                      +245
increases reported in May and June
                                                    Internal medicine (general)                              -592                     -197
2020 for all provider types. Nonsurgical
                                                    Neurology                                                -770                     -599
specialists reported the largest decrease
                                                    Obstetrics/Gynecology (general)                          -609                     -761
and increase respectively.
                                                    Orthopedic surgery (general)                             -749                     -556
                                                    Pediatrics (general)                                     -196                      -94
Whereas less than half (49%) of
                                                    Psychiatry (general)                                     -211                     -144
respondents to a June 2020 MGMA Stat                Pulmonary medicine (general)                            -1,250                     -5
poll saw patient volumes return to more             Surgery (general)                                        -481                     -660
than 75% of pre-pandemic levels, the                Surgery (neurological)                                   -201                 -2,636
2020 Monthly Survey data find wRVUs                 Urgent care                                              -284                     -793
after June 2020 being near or above                 Primary care                                             -590                     -373
reported levels for February and March              Surgical specialist                                      +63                  -1,412
2020.                                               Nonsurgical specialist                                  -1,158                    -921
                                                              Source: 2021 MGMA DataDive Provider Compensation (based on 2020 data)

2020 MONTHLY WORK RVUs FOR FULL-TIME, ACTIVELY EMPLOYED PHYSICIANS AND APPs

  800

  700

  600

  500

  400

  300

  200

   100

     0
            January   February   March     April   May     June       July    August    September October           November      December

           Primary care            Nonsurgical specialist                    Surgical specialist            Advanced practice provider

                                                   Source: 2020 MGMA Monthly Survey

                                                                  5                                                        ©MGMA. All rights reserved.
PROVIDER COMPENSATION                               INCREASE IN MEDIAN TOTAL COMPENSATION, 2016 TO 2020
                                                    $450,000                                                                 2016
Primary care physician total compensation           $400,000
                                                                                                                             2020
increased by 2.6% between 2019 and 2020.            $350,000
                                                    $300,000
Advanced practice providers (APPs) also             $250,000
                                                    $200,000                                                            Sources: 2017 and
experienced a slight increase (1.25%) in                                                                                2021 MGMA DataDive
                                                     $150,000
compensation during the same period.                $100,000                                                            Provider Compensation
                                                      $50,000                                                           (based on 2016
                                                                                                                        and 2020 data)
Over the past five years,
                                                           $0
                                                                  All primary care   All specialists       All APPs

total compensation for
                                                    TRENDS IN MEDIAN TOTAL COMPENSATION
physicians and APPs has                                                                                    Change,            Change,
increased at rates                                                                                        2019-2020          2018-2020
                                                    Primary care physicians                                    2.60%             5.27%
ranging from 3% to 10%.                             Surgical specialists                                       -0.89%           -4.81%
                                                    Nonsurgical specialists                                    -1.29%           -2.92%
Overall, compensation for most physician
                                                    APPs                                                       1.25%             3.41%
specialties remained flat or saw a moderate
increase between 2019 and 2020.
                                              COMPENSATION AND PRODUCTIVITY BY SPECIALTY
Most specialties experienced a
                                                                                          2019-2020 change               2019-2020
decrease in productivity in 2020.                          Specialty                       in median total                change in
                                                                                            compensation                median wRVUs
As reflected in MGMA’s recent
                                              Cardiology (invasive)                                    2.61%                 -5.45%
data report, Quantifying COVID-19:
                                              Family medicine (without OB)                             3.94%                 -11.10%
Measuring the Pandemic’s Impact on
                                              Gastroenterology                                         0.67%                 -13.70%
Medical Practices, specialist physicians
                                              Hospitalist (internal medicine)                          0.14%                  -6.79%
saw steep decrease in compensation
                                              Internal Medicine (general)                              2.73%                 -10.93%
during the onset of the pandemic and          Neurology                                                1.44%                 -11.68%
extending through summer 2020. The            Obstetrics/Gynecology (general)                          0.35%                  -7.24%
suspension of surgeries and elective          Orthopedic surgery (general)                             1.67%                 -11.65%
procedures, along with a decrease in          Pediatrics (general)                                     6.00%                 -11.76%
referrals, negatively impacted specialist     Surgery (general)                                        0.40%                 -11.19%
volumes and subsequent compensation.          Urology                                                  0.12%                 -11.89%

MGMA DATADIVE USERS ENJOY
                                              INCREASE IN MEDIAN TOTAL COMPENSATION, NP AND PA
EXCLUSIVE ACCESS TO THE
QUANTIFYING COVID-19 REPORT                                                                         2019-2020       2016-2020
                                                                                                  change (1 year) change (5 years)
                                              Nurse practitioner (NP)
APP COMPENSATION                                  NP (surgical)                                          1.00%                7.33%
                                                  NP (primary care)                                      1.66%                5.69%
Advanced practice provider
                                                  NP (nonsurgical/nonprimary care)                       1.88%                6.12%
compensation, for the most part, also
                                              Physician assistant (PA)
remained flat or saw a moderate
                                                  PA (surgical)                                         -4.26%                3.85%
increase between 2018 and 2019,
                                                  PA (primary care)                                      0.53%                3.33%
amounting to steady increases over
                                                  PA (nonsurgical/nonprimary care)                       1.39%               10.00%
the past 5 years.

                                                           6                                                             ©MGMA. All rights reserved.
6 keys to medical practices’
          recovery amid the pandemic

        D
                        uring an April 28 webinar, MGMA’s Andrew Swanson, MPA,                      Quantifying
                        CMPE, vice president of industry insights, and Meghan Wong,                 COVID-19
                                                                                                    Measuring the Pandemic’s
                                                                                                    Impact on Medical Practices
                        MS, director of data solutions, detailed the findings of                    2021 REPORT BASED
                                                                                                    2020 DATA
                                                                                                                        ON

                        MGMA’s monthly survey throughout 2020 and insights from
          interviews with practice leaders on how they responded and innovated
          to sustain financial viability and work back to pre-pandemic levels of
          volume and revenues. Here are 6 key takeaways from their presentation:

         1
               Patients came back for care in summer
               2020 after safety worries, deferred visits
               Despite the catastrophic drop in patient
          volumes and revenues in March and April 2020, the
          MGMA monthly survey found that many practices
          quickly restored productivity, with some reporting
          RVUs in July 2020 at the same level or even higher
          than January and February 2020 levels.
            The survey data help confirm a June 2020
          MGMA Stat poll that found 87% of healthcare
          leaders reported that their practices had
          recovered some patient volumes since the
          pandemic’s start, with nearly half of those
          recovering back to more than 75% of their
          pre-COVID-19 patient volume.
             However, a poll of the more than 100 webinar
          attendees of when their volumes returned to pre-pandemic levels found that practice leaders were somewhat
          split as to whether it was June (26%), July (21%), August (17%) or September (36%). “I think this data shows
          that, depending on where you are in the country, what type of practice you are operating … people had
          widely varying degrees of when volumes came back,” Swanson said.
            In some cases, this was a matter of restrictions on elective surgeries being removed in certain states before
          others; however, attendees noted that patients with high-acuity care needs returned with worsened conditions
          after delaying care.

          READ MORE ABOUT THE IMPACTS OF CANCELLED OR DELAYED CARE IN THE
          MGMA-HUMANA RESEARCH REPORT ON DEFERRED CARE, NO TIME TO WASTE..

©MGMA. All rights reserved.                                       7
2
       The recovery was short-lived due to the fall 2020 COVID-19 surge
       Despite the boost for many practices throughout the summer months, the resurgence in COVID-19
       infection rates in early fall 2020 took a toll on practices again, with surgical practices hit hard in
September and October, and a leveling off for recovery in gross charges toward the end of the calendar year.

    2020 monthly charges and collections per FTE physician, surgical specialty practices

 $160,000

 $140,000

 $120,000

 $100,000

  $80,000

  $60,000

  $40,000

  $20,000

        $0
             January   February   March   April   May     June       July   August   September October        November        December

                                    Professional gross charges                   Collections for professional charges
                                                  Source: 2020 MGMA Monthly Survey

3
       Telehealth surged, then ebbed, then grew again with new waves of COVID-19
       While MGMA data pointed to nearly all medical practices embracing some form of telehealth in the early
       months of the pandemic, the 2020 monthly survey report found that providers did not report the vast
majority of their wRVUs as coming from virtual care delivery.
  As Swanson noted, data on primary care, nonsurgical specialists, surgical specialists and APPs showed a
massive spike in telehealth wRVUs for March and April, but for some segments of the provider data, telehealth
as a percentage of all wRVUs never rose above 50% — only to plunge in the summer months.
  But toward the end of 2020, telehealth wRVUs began to pick up again as COVID-19 infection rates rose in many
areas of the country. “Perhaps what this tells us is that, as patients are coming through to the other side of the
pandemic and they’re reflecting on things they experienced, perhaps there is an ongoing place for telehealth
visit volume at a significant degree,” Swanson said.

4
       Slow periods for productivity were opportunities to catch up on collections
       With fewer patients coming through the doors in person or virtually, the significant drop in volumes
       and claims to submit in the first half of 2020 provided medical practice leaders an opportunity to focus
their staff members’ attention to work through accounts. Interviews done for the report found multiple MGMA
members reporting a redeployment of staff to do other tasks internally that might not have been done in busier
times, such as putting billing staff to work to look at back charges and addressing aging A/R to improve
collections and avoid bad debts, Swanson noted.
  MGMA’s survey data showed a decline in charge collections for primary care practices in August and September
— likely a product of the significant drop in professional gross charges in the spring months that preceded.

                                                                 8                                                      ©MGMA. All rights reserved.
5
Supply costs were up dramatically, but cuts elsewhere lowered overall spending
While the market for personal protective equipment (PPE) tightened dramatically throughout much of
2020 and prices for items such as masks, gloves, gowns and other protective gear surged, practice
leaders more than made up for those increased costs by trimming total costs in other areas.
A poll of webinar attendees found a majority (54%) had an overall decrease in operating costs for 2020, com-
pared to 23% whose costs rose and 23% whose costs stayed the same. For practices that accepted
Paycheck Protection Program (PPP) loans, the need to retain those employees kept those staffing expenses on
the books, whereas other practices that opted for furloughs and layoffs saw a lot of cost savings to account for
dramatic loss of revenue in early 2020.
“It might be a bit counterintuitive, thinking about groups trying their best to stay afloat — that operating
expenses would decrease and, in some instances, decrease significantly,” Swanson said, but as the report notes,
“decisions to cut spending elsewhere in the practice … likely mitigated the overall impact” of PPE price hikes.
6
Staffing struggles persist due to quarantine, childcare and a tight labor market
Practice leaders interviewed for the report all pointed to the need to update staffing models to ac-
commodate for potential employee quarantines if exposed to coronavirus, as well as updating staffing
schedules due to family care needs after schools and daycare facilities closed during the pandemic.
These factors — paired with a tightening market for physicians, various types of APPs and staff — speak to a need
for healthcare practice leaders, especially in human resource management, to rethink their long-term strategies.
With more than 70% of practice leaders planning to hire a new
physician position in 2021 after a rash of unexpected physician
retirements in 2020, “an already tight and already difficult
recruiting market is going to get even more tight,” Swanson noted.
To fill that gap, hiring APPs might be an alternative approach for
practices looking to add providers as recovery continues: A
November 2020 MGMA Stat poll found more than half of practice
leaders expect to add new APPs this year. “I think this really points
to [the need] to think more strategically about how to get ahead of
this,” Swanson added, such as getting workers performing tasks at
the top of their licensure and building out pipeline/feeder systems in
the community for bringing in new talent for certain clinical support
staff positions. “If your nursing staff is bouncing around practices
in town or between the hospital or hospital systems ... you’ve got
to have a feeder system,” Swanson implored.
Additionally, building more into the employee onboarding process
is a crucial way to lay the groundwork for better retention as com-
pensation and benefits become more competitive. Making those
early days and weeks “memorable and extremely positive” to leave
a lasting impact as a new employee integrates with your team might
make the difference in keeping that person when an offer for better pay comes along, Swanson said.
©MGMA. All rights reserved. 9Redefining fair market
value under Stark Law
IMPACTS ON PHYSICIAN PRACTICES BASED ON NEW RULES
P
AND THE 2021 MEDICARE PHYSICIAN FEE SCHEDULE
hysician practices face new compliance concerns
JOE AGUILAR
after the Centers for Medicare & Medicaid Services
(CMS) shared two major announcements in the
MBA, MPH, MSN, CVA
latter part of 2020: PARTNER,
1. The 2021 Medicare Physician Fee Schedule (PFS) HMS VALUATION PARTNERS
2. New final rules under the Physician Self-Referral “Stark”
Law and Anti-Kickback Statute (AKS).1
JOE.AGUILAR@HMSVALUE.COM
These recent changes will have a wide-ranging impact on General market value means:
physicians and their transactions in 2021 and beyond. It is 1. Assets. With respect to the purchase of an asset,
essential that the significance of these regulatory changes the price that an asset would bring on the date of
— a new definition of FMV, appropriate application of survey acquisition of the asset as the result of bona fide
data, and decoupling of the volume and value standard — bargaining between a well-informed buyer and seller
should not be overlooked. To complicate matters, the 2021 that are not otherwise in a position to generate
Medicare PFS will likewise refashion FMV for physician business for each other.
practices. 2. Compensation. With respect to compensation for
services, the compensation that would be paid at the
REDEFINING FMV time the parties enter into the service arrangement
Determining whether compensation under a specific as the result of bona fide bargaining between well-
arrangement is within FMV is a requirement for many of informed parties that are not otherwise in a position to
the exceptions or safe harbors that may be used under the generate business for each other.
Stark Law or AKS. Understanding how FMV is defined is of 3. Rental of equipment or office space. With respect
utmost importance. However, for many physicians, health- to the rental of equipment or the rental of office
care executives and healthcare valuators, the regulations space (not taking into account its intended use and
have historically generated ambiguity surrounding FMV. In without adjustment to reflect any additional value the
the new final rules, CMS has attempted to increase clarity prospective lessee or lessor would attribute to the
around the definition of FMV, its application to survey data, proximity to the lessor where the lessor is a potential
as well as its relationship to the volume or value standard. source of referrals to the lessee)4, the price that rental
property would bring at the time the parties enter
FMV: Clarifying the definition by subject transaction into the rental arrangement as the result of bona
To minimize confusion, CMS redefined FMV in the Stark fide bargaining between a well-informed lessor and
final rule2 to be the value in an arm’s-length transaction, lessee that are not otherwise in a position to generate
consistent with the general market value of the subject business for each other.5
transaction.3 Furthermore, general market value is now
defined in 42 C.F.R. § 411.351 to be specific to the type of the
transaction as follows:
10 ©MGMA. All rights reserved.FMV is not linked to a particular survey percentile
In redefining FMV, CMS provided some useful commentary
and insight into its thoughts on determining the FMV range
for a transaction. Specifically, CMS highlights the need to
evaluate general market value in the context of “the subject
transaction” and not solely depend on the utilization of
particular survey data or specific percentiles within the data
for the determination of FMV.
Using survey data continues to have utility when deter-
mining FMV; however, the end value needs to be nuanced
to the specific set of circumstances surrounding “the sub-
ject transaction.” CMS’ comments to this end, included the
following:
To address compensation terms between an entity
…We continue to believe the fair market value of a trans- furnishing designated health services (DHS) and a physician,
action — and particularly, compensation for physician with payments made either from a physician to the entity or to
services — may not always align with published valuation a physician from the entity, a two-part rule needs to be met:
data compilations, such as salary surveys. In other words, 1. When evaluating compensation from a physician
the rate of compensation set forth in a salary survey may (or immediate family member of the physician) to
not always be identical to the worth of a particular physi- an entity furnishing [DHS], does the compensation
cian’s services.6 formula vary by taking into account the volume or value
of referrals to the entity and/or other business generated
It is not CMS policy that salary surveys necessarily by the physician for the entity when calculating
provide an accurate determination of fair market value compensation?9
in all cases. … Consulting salary schedules or other 2. If referrals or other business generated by the physician
hypothetical data is an appropriate starting point in the is used in a compensation formula, does the physician’s
determination of fair market value, and in many cases, it compensation increase or decrease based on a negative
may be all that is required. … In our view, each compen- or positive correlate with the number or value of
sation arrangement is different and must be evaluated the physician’s referrals to the entity?10
based on its unique factors.7
Should the answer be “yes” for the questions above, then
As an example, CMS indicated that securing a sought-after the arrangement does not meet the volume or value stan-
physician with a unique skill set may warrant a compensation dard. In this instance, if the arrangement fails to meet the
level higher than typically expected for the specialty in the volume or value standard, then “that determination is final.”11
particular geographic area. On the flip side, hospitals that For more insight, CMS included some additional
may be in a more tenuous economic state need not feel commentary on meeting the volume or value standard:
compelled to pay higher than financially prudent simply
because salary surveys would suggest such a payment. With respect to employed physicians, a productivity
For these reasons, CMS declined to establish a bright line bonus will not take into account the volume or value of
rule based on a particular survey percentile. Specifically, the physician’s referrals solely because corresponding
CMS’ policy of determining appropriate compensation is not hospital services (that is, [DHS]) are billed each time the
based on salary data at or below the 75th percentile, nor employed physician personally performs a service.12
is it outside of FMV range for compensation set above the
75th percentile.8 Important for physician practices entering into
professional services agreements (PSAs), CMS’ guidance
Decoupling volume or value standard “extends to compensation arrangements that do not rely
Until now, the volume or value standard had not been on the exception for bona fide employment relationships
separately defined within the regulations but linked to the [e.g., PSA] … and under which a physician is paid using
determination of FMV. The final rule has now clarified that a unit-based compensation formula for his or her p
meeting the FMV requirement for an exception is separate ersonal performed services, provided that the com-
and distinct from meeting the volume or value standard. pensation meets the conditions in the special rule [on
In doing so, the rule has created a two-part mathematical unit-based compensation].”13
formula used to determine if the volume or value standard
has been met.
©MGMA. All rights reserved. 112021 MEDICARE PFS IMPACT ON FMV • Figure 1 illustrates the percentage change to wRVUs and
The new Stark final rules took effect Jan. 19, 2021, amidst Medicare reimbursement from 2020 Medicare PFS to
the backdrop of a significant PFS change first shared by 2021 Medicare PFS based on Medicare utilization data by
CMS on Dec. 2, 2020,14 and revised Dec. 27, 2020, by the CPT code, respectively for endocrinology, family medi-
Coronavirus Response and Relief Supplemental Appropri- cine, cardiology, orthopedic surgery and general surgery
ations Act 2021. Among the multiple changes under the specialties.15 In all specialty categories, the percentage
2021 Medicare PFS final rule, the following are some of the change to wRVU was greater than the percentage change
material ones that will have a potential impact on determin- to reimbursement. This variance could result in significant
ing FMV: changes to physician compensation. Practices need to
• wRVU values for office and other outpatient services perform financial scenario analyses and pro formas to help
E/M codes have increased by 7% to 13% amongst new them quantify the financial impact to the group as well as
patient office visit codes 99202-99205 and by 28% to physicians individually.
to 46% amongst established patient office visit codes • Utilizing national surveys to support compensation as
99212-99215. FMV will be more complicated in the coming years given
• Add-on codes for incremental time spent with a patient the impact from the pandemic along with recent CMS
based on their complexity have been introduced but not commentary in the final rules.
finalized to date. a. Current published 2020 surveys contain data from 2019,
• The Medicare conversion factor for 2021 is $34.89, which prior to the pandemic. Data from the pandemic will affect
reflects a 3.3% decrease from the 2020 conversion factor. surveys published in 2021. The pandemic has injected a
fair degree of variability into the data across regions as
A cursory review of the impact on physician wRVUs shows well as across specialties. Combining confounding factors
a potential significant increase for medical specialties and a with the 2021 Medicare PFS changes will make it more
potential decrease for procedure-based specialties. In terms difficult for benchmarking purposes and the assurance
of reimbursement, the 2021 Medicare PFS governs Medicare that one is comparing apples to apples. As a result, it is
as well as those Medicaid and commercial plans that rely on recommended that physician practices normalize their
the PFS for their own rates. Therefore, the reimbursement data for comparison purposes and utilize multiple analy-
impact from the 2021 PFS will be contingent on the practice’s ses to ensure all aspects have been considered.
payer mix and the extent to which the PFS is used to deter- b. CMS reiterated that there is no bright-line threshold
mine commercial and Medicaid rates. upon which practices may rely when determining FMV,
In light of the 2021 Medicare PFS, physician practices will both on the upper end of the range as well as the
need to consider the following: lower end of the range. Via the new FMV definition,
FIGURE 1. CHANGE TO wRVUs AND MEDICARE REIMBURSEMENT,
2020 MEDICARE PFS TO 2021 MEDICARE PFS
Reimbursement wRVUs
25%
20.11%
20% 18.05%
15% 12.9%
11.58%
10% 8.64%
4.63% 5.37%
5% 3.39%
1.88%
-0.2%
0%
Endocrinology Family practice Cardiology Orthopedic survery
General surgery
-5%
The new Stark Law rules also have impacts for distribution of Medicare ancillary revenues.
For MGMA Government Affairs’ analysis of this change, visit mgma.com/stark-ancillaries.
12 ©MGMA. All rights reserved.the final rule places increased importance on the spe- benchmarking analyses and will require normalization of
cific circumstances surrounding the subject transaction. the data to ensure the appropriate use of the surveys.
As a result, utilizing survey percentiles solely as the Physician practices need to engage this issue as they set
measure of FMV may result in compensation being compensation arrangements for 2021.
outside of FMV range.
• Contingent upon the economic impact from the 2021
Medicare PFS, physician practices must weigh their com- 1. Key to the final rules are new exemptions and safe harbors associated with
pensation arrangements in the context of their financial value-based care arrangements. However, given the scope of this article,
value-based care arrangements will be reserved for discussion in the series’
sustainability, compliance risk and need for provider final article.
retention. Open communication between practice leader- 2. It is important to note that AKS and other regulatory agencies are not bound
ship and the physician team will be crucial. The challenge to utilize the definitions put forth under the Stark Law final rules. However, the
rules do provide terminology and interpretive guidance.
will be to keep the conversation centered around the
3. 42 C.F.R. § 411.351.
practice’s ability to provide quality patient care, maintain
4. Ibid.
profitability and reward physicians accordingly.
5. Ibid.
6. FR Vol. 85, No. 232.
KEY TAKEAWAYS 7. Ibid.
Physician practices continue to operate in a complex 8. Ibid.
regulatory environment. Establishing FMV will continue to 9. 42 CFR § 411.354(d)(2); 42 CFR § 411.354(d)(3).
be a critical step in meeting exceptions and navigating safe 10. 42 CFR § 411.354(d)(2); 42 CFR § 411.354(d)(3).
harbors under Stark and AKS. Therefore, the attempt to 11. FR Vol. 85, No. 232.
increase clarity in this definition is a welcomed aspect of the 12. Ibid.
new final rules. However, it comes with the understanding that 13. Ibid.
FMV should be determined based on the specific circum- 14. CMS-1734-F.
stances surrounding the subject transaction and not solely 15. This figure was based on Medicare claims utilization across specialties. The
on survey data at specific percentiles. percentage change should not be used as a substitute for a specific physician
coding/reimbursement analysis as these changes are sensitive to the coding
Lastly, the change to the 2021 Medicare PFS poses an distribution, payer mix, and case mix for the practice. Contingent upon the relative
additional confounding factor when determining FMV. percentage use of outpatient E/M office visit codes, this impact could vary.
The significant changes to the wRVUs will complicate
ADDITIONAL RESOURCES
MGMA DataDive MGMA Consulting
Access industry-leading benchmarking data to Leverage the industry leader in creating meaningful
understand the past and present to propel your change in healthcare, one organization at a time.
practice into the future.
MGMA COVID-19 Podcasts
MGMA Stat COVID-19 polls Find all MGMA Insights and Executive Session
Find the latest, real-time data on how healthcare podcasts from our ongoing COVID-19 series.
leaders are responding to the pandemic, along with
expert insights and best practices. Save the date: Medical Practice
Excellence: Leaders Conference
MGMA COVID-19 Recovery Center Join us Oct. 24-27 in San Diego, Calif., or
Find MGMA’s latest operational resources, tools and Nov. 16-18 for our Digital Experience (DX).
stories of success from across the healthcare industry.
©MGMA. All rights reserved. 13mgma.com/data
©MGMA. All rights reserved.You can also read


