Q3:22 EARNINGS PRESENTATION - NYSE: NOG - cloudfront.net
←
→
Page content transcription
If your browser does not render page correctly, please read the page content below
NYSE: NOG

Q3:22 EARNINGS PRESENTATION

          NYSE: NOG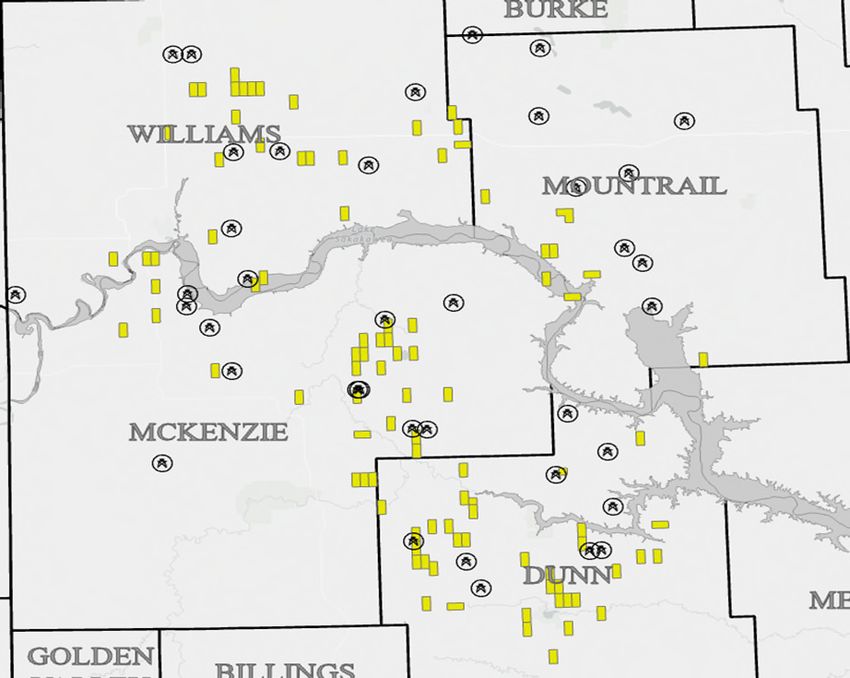
NYSE: NOG

I.   Q3 HIGHLIGHTS AND 2022 GUIDANCE
II. NOG VALUE PROPOSITION
III. APPENDIX: SUPPLEMENTAL INFO

                                                   2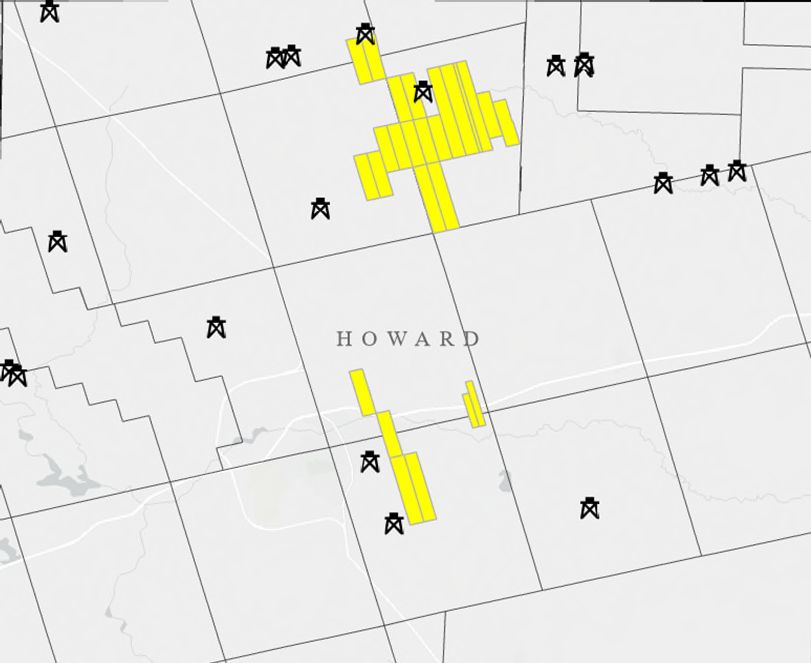
Q3:22 FINANCIAL & OPERATING HIGHLIGHTS
                                                                                                                                                                                                                                                           NYSE: NOG

                                                                                                                                     Q3:22 Earnings Highlights
                  Q3 Free Cash Flow(1)                                         Dividend Growth                                       •     Record EBITDA, Growth, Exceptional Returns
                                                                                                                                                      Record Adjusted EBITDA. $292.4MM in Q3, up 115% YoY
                 ~$110.6MM                                                         +20% Increase
                                                                                                                                               •
                                                                                                                                               •      Macro-Friendly Growth. Q3 net production +37% YoY
                 Third straight quarter of greater                                 Q4:22 dividend increased to                                 •      Standout margins and returns(1). NOG’s recycle ratio of 4.43 and adjusted
                 than $100mm of FCF                                                $0.30, +20% vs. Q3:22                                              ROCE of 34.3% highlight another quarter of stellar corporate returns
                                                                                                                                     •     Shareholder Returns Accelerating
                   Q3 Production                                                 Q3 Adjusted                 ROCE(1)                           •      $0.30 Q4 Dividend declared, 20% increase from Q3 ($0.25)

                  79.1Mboe/d                                                       34.3%                                                       •      $57.5MM of Preferred Stock retired YTD, 2.6MM common shares as-
                                                                                                                                                      converted; Preferred to be fully converted to common stock
                  +~8.9% QoQ                                                       Another stellar quarter                                     •      1.8 million shares of common stock repurchased YTD ($28.42 per sh.
                                                                                                                                                      average)
                                                                                                                                               •      $23.4MM Senior Notes repurchased YTD at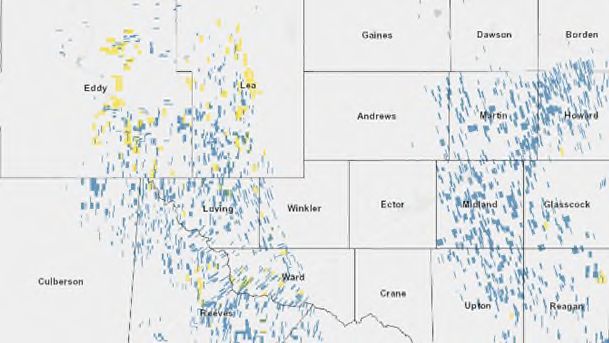
YTD FCF AND SHAREHOLDER RETURNS AT A GLANCE
NYSE: NOG
NOG Continues a Balanced Approach – Reduce Share Count, Debt, and Highest Cost of Capital Securities and Pay Rich Dividends
YTD Free Cash Flow ~$371 million
Over $175 million of debt reduction, net of corporate
acquisitions
$23.4 million Notes repurchased for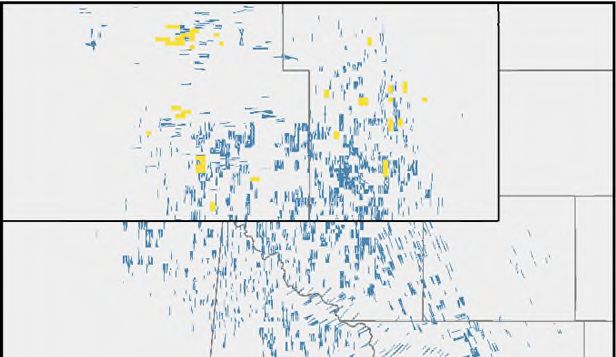
Q3:22 PRODUCTION & CAPEX BREAKDOWN
NYSE: NOG
NOG’s Commodity, Capital Expenditures and Production Mix Continue to Become More Diversified and Balanced
Q3 2022 – PRODUCTION BY REGION (Boe) Q3 2022 – PRODUCTION BY COMMODITY (Boe)
17%
Region Commodity Type
10% Williston Marcellus 43%
Oil Gas
26% 57% Permian 57%
Williston: 71% Oil; Permian: 64% Oil ; Marcellus: 100% Dry Gas
Permian production continued to grow as a portion of NOG’s production mix
Production continues to be balanced from a mix perspective
Williston production rebounded post-April storms to a quarterly BOE record for the Company
Oil cut expected to increase in Q4 due to Williston completion
Marcellus production was steady and 2022 pads outperforming materially
cadence
NOG is a ‘two-stream reporter,’ meaning its natural gas prices
include the revenues associated with NGLs, but it does not report
Q3 2022 – CAPEX BY REGION the volumes of the NGLs themselves
Both NOG’s production and liquids mix on a comparative reporting
20% 0% 1% basis with most other public companies would be significantly higher
10%
Category
46%
Williston Marcellus
Permian Other
53%
Williston was the leading basin as operations begin to ramp before the winter
Inflation has not been a material factor to NOG’s guidance due to conservative planning which assumed significant increases in costs
Increase to Q3:22 capital spending driven primarily by elective Ground Game success and organic pull-forwards 5
UPDATED 2022 GUIDANCE
NYSE: NOG
Annual Production Guidance Raised; Oil Pricing Differentials Improved; Activity Acceleration Pulling some 2023 CapEx into
Q3:22-Q4:22
Current Previous
Annual Production (2-stream, Boe per day) 74,500 - 78,000 73,000 - 77,000
(1)
December Exit Rate (PF for Full Month Alpha + Delaware Acq. Closings) 83,000+ 77,000+
Oil Weighting (as a % of Production) 59.5 – 60.5% 59.5 – 61.5%
Net Wells Turned-in-line (TILs) 57.0 – 59.0 52.5 - 56.5
Net Wells Spud in 2022 ~66 – 68 ~65
Total Budgeted Capital Expenditures ($MM) $460 - $510 $405 - $470
Production Expenses (per Boe) $9.00 - $9.25 $8.85 - $9.10
Cash G&A (ex transaction costs) (per Boe) $0.80 - $0.85 $0.80 - $0.85
Non-Cash G&A (per Boe) $0.20 - $0.30 $0.20 - $0.30
Production Taxes (as a % of Oil & Gas Sales) 8.0 – 9.0 % 8.0 – 9.0 %
Oil Differential to NYMEX WTI (per Bbl) ($3.00 - $4.00) ($4.50 - $5.25)
Gas Realization as a Percentage of Henry Hub (per MCF) 105% - 112.5% 102.5% - 112.5%
Increased turned-in-line wells (TILs) and strong well performance driving significant increase to 2022 Production guidance
Significant uptick and acceleration in both expected and realized TILs in Q3 and Q4 as well as significant increase in high return organic & Ground Game spuds driving strong exit
rate
Increase in Q3/Q4 spud count driving some increase to 2022 Capex, in addition to Ground Game Success in Q3, and pull-forward of activity
Williston-heavy completion schedule in Q4 will drive increase to oil as a percentage of total volumes; outperformance in Marcellus properties driving higher gas as a percentage
of total volumes
Oil pricing differentials continue to beat the Company’s projections, particularly in the Williston Basin, small impact to LOE for associated transport costs
Gas realizations will be modestly impacted by weaker Permian Waha pricing, but strong and stable in NOG’s other regions, allowing an increase to guidance for the year
Source: Company internal estimates and disclosures. Actual results may differ materially from projections.
(1) Updated exit rate guidance pro forma for a full month of pending Alpha Energy acquisition and pending Delaware Basin acquisition, expected to close in December 2022. Does not include pending MPDC acquisition, expected to close in January 2023.
6
UPDATED 2022 GUIDANCE: CAPEX DRIVER DETAIL
NYSE: NOG
Updated CapEx is Driven by Activity, Not Inflation, and is Expected to Translate into Higher Volumes and Future Cash Flows as
NOG Enters 2023
Increased TILs and strong well performance driving significant
increase to 2022 Production guidance
Significant uptick and acceleration in both expected and realized
TILs in Q3 and Q4 as well as significant increase in high return
organic & Ground Game spuds driving strong exit rate
Increase in Q3/Q4 spud count driving some increase to 2022
Capex, Ground Game Success in Q3, pull-forward of activity
Q4 activity pull-forward should serve to in-kind reduce 1H23
capital
7
EXECUTING A BALANCE SHEET SIMPLIFICATION
NYSE: NOG
NOG’s Convertible Preferred Stock will Convert to Common Stock on November 15, 2022
Q4 2021 Q3 2022
7% Capitalization Capitalization
Equity Preferred 27% Equity
Debt
10% Debt 10%
42% 51% ~88.3MM ~85.2MM
Diluted Shares Outstanding(1)
73% Diluted Shares Outstanding(1)
ACTIONS
LQA Adj. EBITDA ~$701 Million Q3 Production ~47% above 2021
~$1.2 Billion
average levels; ~23% above Q4:21
Aggressively repurchased common
Market Cap(1) ~$1.4 Billion and preferred stock at lower than ~$3.0 Billion
current price levels
Mandatory conversion of Preferred
Convertible $0
~$197 Million due to strong stock performance
Preferred(2) 20%
In Q4, issued $500 million of new
Sr Cvt Unsecured Debt with an all-
Net Debt(3) ~$1.2 Billion
10%
in cost of
NYSE: NOG

I.   Q3 HIGHLIGHTS AND 2022 GUIDANCE
II. NOG VALUE PROPOSITION
III. APPENDIX: SUPPLEMENTAL INFO

                                                   9
THE NOG INVESTMENT PROPOSITION
                                                                                                                         NYSE: NOG

                       National Non-Op Franchise – Principled ROCE(1) Leader (34.3% in Q3:22) Diversified by
                                                   Commodity and Geography

                                                  $500MM Free Cash Flow(1) Target for 2022 + Accelerating Growth

                       Return of Capital Commitment: Significant Dividend Growth and Equity Buybacks YTD

                                                                       Strong Balance Sheet with LQA Leverage of
A DIVERSIFIED HIGH RETURN NON-OP E&P FRANCHISE
NYSE: NOG
NOG’s acquisitions have created a high return national non-op franchise that is benefitting from economies of scale; ~8,000 net acres to be added to Permian footprint in 4Q22 & 1Q23
Going forward, NOG is positioned to continue to capitalize on increased non-operated opportunities present in the “Shale 3.0” era
Williston Basin : ~182,000 Net Acres Q3:22 Production by Region (Boe) Q3:22 Production by Commodity (Boe)
17%
Region Commodity Type
43%
26% 57% Williston Marcellus Oil Gas
57%
Permian
NOG
Wells In Progress
Wells Completed 2019 – 2021
2021YTD
Permian Basin: ~11,000 Net Acres Marcellus Acres: ~61,000 Net Acres
Armstrong
Gaines
Lea Indiana
Eddy
Allegheny Cambria
Andrews
Westmoreland
Washington
Loving Winkler Ector
Culberson Somerset
Reeves
Fayette
Northern
NOG Greene Northern
NOG
WellsCompleted
Wells Completed2019
2019––2021
2021YTD Ward WellsCompleted
Wells Completed2019
2019––2021
2021YTD
11A DIFFERENTIATED E&P GROWTH PLATFORM
NYSE: NOG
NOG continues to build scale as the largest dedicated public non-operated working interest company
PRODUCTION CONTINUES TO RAMP… …WHILE MAINTAINING PEER-LEADING LOW CASH G&A(1)
Material increases driven by organic growth + accretive M&A Reducing overhead unit cash G&A cost
79.1 $3.02
72.7
71.3
$2.71
64.2
57.6
54.6
43.943.7
40.8 $1.58 $1.61
38.4 $1.45
36.3 35.0 35.7 $1.15 $1.39
34.6 $1.28 $1.20
29.1 $1.13 $1.01
26.7 $1.01 $1.06 $0.95 $1.04 $0.93
23.8 $0.92 $0.91 $0.78
21.0 $0.77 $0.86 $0.82
18.0
16.7
13.815.3
Production (MBoe/d) Cash G&A per BOE- Adjusted
1. Adjusted Cash G&A is a non-GAAP financial measure. Please see the appendix for reconciliation to the most directly comparable GAAP Measure.
12CREATING VALUE WITH FREE CASH FLOW
NYSE: NOG
NOG is a Flexible Capital Allocation Machine Dedicated to Maximizing Total Return: Growth + Dividends + Buybacks
DIVIDENDS EQUITY BUYBACKS DEBT RETIREMENT
Q1: 22 Q2: 22 Q3: 22 Q4: 22 $109MM repurchased YTD $50MM Notes repurchase
authorization
(1)
Declared Dividend $ 0.14 $ 0.19 $ 0.25 $ 0.30
Initial Proposal (12/15/21) $ 0.12 $ 0.15 $ 0.18 $ 0.21
$150MM Common Stock repurchase
Increase to Forecast 16.7% 26.7% 38.9% 42.9% authorization $23.4MM executed YTD(2)
Implied Annualized Yield - $30 Price 1.9% 2.5% 3.3% 4.0%
Implied Annualized Yield - $35 Price 1.6% 2.2% 2.9% 3.4% $51.5MM executed YTD(2) $26.6MM remaining available
Implied Annualized Yield - $40 Price 1.4% 1.9% 2.5% 3.0%
Record Date 3/30/2022 6/29/2022 9/29/2022 12/30/2022
$98.5MM remaining available >$150MM of debt retired year-to-
Quarter over Quarter Growth 75% 36% 32% 20% $90MM Preferred repurchase date, excluding corporate acquisitions
Authorization
$57.5MM executed YTD
Preferred to be fully converted
into common stock on November
15, 2022
1. On November 3, 2022, NOG announced a $0.30 per share dividend for Q4:22.
2. Year-to-date common stock repurchases and note repurchases include October 2022.
13CLOSED: WILLISTON BASIN ACQUISITION
NYSE: NOG
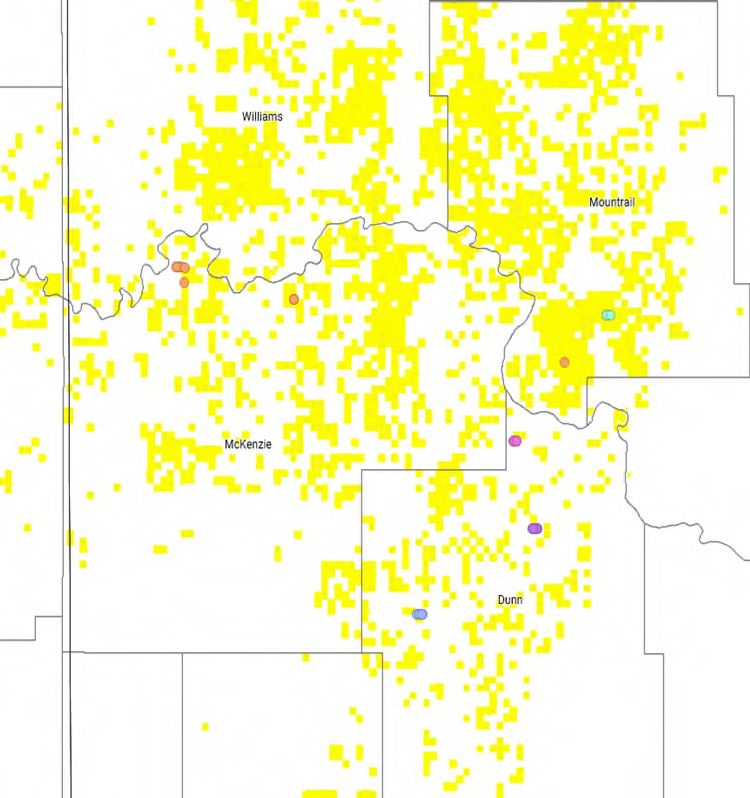
Williston Locator Map Key Statistics
Price: $170 million with $5 million earn-out potential(1)
NTM Production: ~2,500 Boepd (2-stream, 83% oil)
Net Acreage: ~3,500
Net Locations: 9.2 PDP/ 2.6 WIP / 14.9 Engineered Undeveloped
Closed in August 2022; Closing Settlement Price $158.0 million
Top Operators in the Core
Wells primarily operated by top Williston producers
NOG already has an interest in ~50% of acquired property value
Core of Dunn, McKenzie, and Williams Cos.
1. Initial price subject to typical closing adjustments. If on December 30, 2022, WTI active month contract exceeds $92.50, NOG will pay an additional $5.0 million in cash consideration to Seller in the first quarter of 2023.
14CLOSED: MIDLAND BASIN ACQUISITION
NYSE: NOG
Midland Basin Locator Map Key Statistics
Net Acreage: ~1,600
Current Production: >1,600 Boepd (87% oil)
NTM Expected Production: >1,800 Boepd (86% oil)
PDP (Net): 6.4
WIPs (Net): 1.6
Future Locations: ~8.0
NTM (10/1/22 – 9/30/23) Cash Flow from Ops: ~$48MM (2.3x)(1)
Closed in October 2022; Closing Settlement Price $110.1 million
Operator
Wells operated by SM Energy
Top 5 ranked in ESG by Enverus(2)
(1) Based on commodity pricing strips as of August 15, 2022.
(2) Source: Enverus “ESG Compass 3Q22” published August 8, 2022.
15PENDING: ALPHA DELAWARE BASIN ACQUISITION
NYSE: NOG
Delaware Basin Locator Map Key Statistics
2023 Expected Production: ~3,000-3,500 Boepd (68% oil, 2-stream)
2024 & 2025 Expected Production: >4,000 Boepd
Wells (Net): 9.6 PDP, 2.8 AFEs & WIPs, ~21.2 Future Locations
Net Acreage: ~2,800 in Lea and Eddy, NM and Loving, TX
2023 Expected Cash Flow from Ops: ~$46.5-$54.3MM(1)
Expected CapEx: ~$32MM annual average over next three years
Expected Closing Date: December 2022
Operators
Wells primarily operated by Mewbourne, Conoco and EOG
Purchase Price
$157.5 million cash at closing, subject to typical closing
adjustments
Sliding scale earnout – depends on average front month NYMEX
WTI pricing during the first six months of 2023:
$0 for average pricing below $75.00/bbl, up to a maximum of
$22.5 million for average pricing above $87.85/bbl
(1) Unhedged, based on commodity pricing strips as of September 28, 2022. 16PENDING: DELAWARE BASIN ACQUISITION
NYSE: NOG
Northern Delaware Basin Locator Map Key Statistics
Purchasing Northern Delaware Non-Operated Properties
Net Acreage: ~2,100
2023E Production: ~2,500 Boepd (68% oil)
Wells (Net): 5.3 PDP, 2.1 AFEs & WIPs, ~17.2 Future Locations
Additional Upside: Material upside in secondary zones across leases
2023E Cash Flow from Ops ($MM): ~$55 million (~2.4x) (1)
Expected CapEx: ~$25MM in 2023E
Expected Closing Date: December 2022
Operators
Wells operated primarily by Mewbourne Oil (>90%)
Additional operations from Coterra and Permian Resources
Purchase Price
$130.0 million cash at closing, subject to typical closing
adjustments
(1) Unhedged, based on commodity pricing strips as of October 10, 2022. 17PENDING: MPDC MASCOT PROJECT ACQUISITION
NYSE: NOG
Mascot Four Unit Project Details Key Statistics
Purchasing a 36.7% Non-Op Interest in the Mascot Project, Midland
County, TX for $330MM unadjusted cash purchase price
Acreage: Working interest in ~4,400 gross acre contiguous four units,
all depths owned, stacked pay 6-zone development project (100% HBP)
2023E Production: ~6,450 Boepd (2-stream, 80% oil)
2024E Production: ~10,000 Boepd (2-stream, 76% oil)
PDP (Net): 12.1
Future Locations/WIPs/PUDs (Net): 22.8/5.5/17.3
Additional Upside: Upside in deeper zones and from downspacing
2023E Cash Flow from Ops(1) (unhedged, $MM): ~$150MM (~2.2x)
2024E Cash Flow from Ops (1) (unhedged, $MM): ~$200MM (~1.65x)
Operator
Wells operated by Deep Rock Oil Company (a wholly owned
subsidiary of MPDC) (~55% remaining working interest)
NOG also purchasing an undivided interest in Collegiate Midstream
and associated infrastructure tied to the project
Source: NOG Management projections.
(1) Based on strip pricing as of October 13, 2022. 18BALANCE SHEET & LIQUIDITY ENHANCEMENT CONTINUES
NYSE: NOG
• Liquidity remains strong
• Company continues to generate substantial Free Cash Flow
• Revolving Credit Facility: NOG’s fall borrowing base redetermination will be completed in November 2022
• NOG seeking expansion of both elected commitment amount and borrowing base (currently $850MM/$1,300MM)
• October 2022 Financing (not reflected in table below):
• $500 million of 3.625% Convertible Senior Notes due 2029
• Created substantial additional liquidity under Revolving Credit Facility
$450MM of untapped Borrowing Helped by rising interest rates,
Base if needed for acquisitions or Company has repurchased ~$23.4
($ in millions) additional dry powder million of Notes atNYSE: NOG
I. Q3 HIGHLIGHTS AND 2022 GUIDANCE
II. NOG VALUE PROPOSITION
III. APPENDIX: SUPPLEMENTAL INFO
20BENEFITS OF NOG’S NON-OPERATED MODEL
NYSE: NOG
HIGH RETURN WAY TO PLAY E&P SPACE
Low cost structure & high corporate ROCE
Unit G&A costs less than operating peers
Scalable Model: NOG has just ~32 employees
SHALE 3.0 BENEFICIARY LEVERAGING EXPERIENCE
NOG is capitalizing on industry Proprietary database, built from
strategy shift has operators focusing participation in approximately 8,500
on free cash flow instead of growth. wells, including ~45% of all Bakken and
This has led to elevated level non-op Three Forks wells drilled in the Williston
“Ground Game” opportunities
CAPITAL ALLOCATION FLEXIBILITY
Ability to “Cherry-Pick” from nearly 100 operating partners across 1MM+ gross acres in 3 basins
Superior flexibility to manage capital allocation and to do so quickly
Costs limited to drilling, completion, and acreage
21GROUND GAME – A HIGH RETURN NOG EXCLUSIVE
NYSE: NOG
Another Year of Highly Accretive Full Cycle Return Opportunities
2022 Ground Game Wells in Process Acquisitions Free Cash Flow Derivation ($MM)
2022 2023 2024 2025
Net Wells Turned-in-Line 5.3 2.0 0.2 -
Forecasted Production (boe/d) 1,385 2,734 1,625 1,039
Cash Flow From Operation (millions)(1) $35.6 $61.4 $32.5 $19.1
Development Capital Expenditures (millions) $71.9 $15.0 $0.3 $0.0
Acquisition Cost (millions) (2) $26.9 $0.0 $0.0 $0.0
Expected ROCE(3) 27% 49% 29% 18%
Williston Ground Game Map Permian Ground Game Map
250+ ground game deals executed since 2018
Only targeting deals that keep our industry leading
ROCE intact
Barbell approach high-grading opportunity set
across the Bakken and Permian
Current environment is ripe for deals;
multiple deals evaluated daily
1) Oil/gas price assumptions were done at the 11/01/22 Strip
2) Excludes capex related to acreage acquisitions
22
3) Calculated at the asset levelESG IS FRONT AND CENTER WITH EVERYTHING WE DO
NYSE: NOG
NOG’s Current Top Ten Public Operators Represent a “Who’s Who” of ESG Stewardship
EQT CLR OVV CHRD COP EOG HES DVN ERF XOM
Dedicated ESG Section of Website
Board-Level Oversight of ESG
Formal ESG Policy
Provides ESG Report
Discloses and Tracks ESG-Related Targets
IPIECA, API, GRI, TCFD, IPIECA, TCFD, AXPC, SASB GRI, IPIECA, AXPC, SASB, IPIECA, API, OGMP 2.0, IPIECA, AXPC, CAPP, SDGs, IPIECA,
IOGP, TCFD DTF, AXPC, SASB SASB TCFD UNCGTP, API, IOGP, GRI, IPGA, API, CDP API
2017, SASB SASB TCFD, SASB, TCFD, SDGs, SASB
WEF - SCCM
ENVIRONMENTAL SOCIAL GOVERNANCE
• Operators are selected for environmental and • NOG employees provided free health care • Separate CEO and Chairman roles
safety records and paid family leave • Significant shareholder representation on Board
• NOG’s largest operator by volume, EQT, has • NOG has an employee-led Charity Committee
been a leader in Certified Natural Gas • NOG G&A per Boe is among the lowest in the industry
and donates to several organizations in its
environmental stewardship community • NOG CEO to Employee pay ratio 13:1, lowest in its
• ESG Report published in 3Q:22 • Continue to analyze carbon offset projects entire peer group
NOG demonstrates explicit board-level oversight of ESG and plans to track our public
operators’ ESG targets over time through Annual ESG Reports
23HEDGE PROFILE - SWAPS
NYSE: NOG
NOG continues to execute a strategy built around the safeguard of returns during a commodity down-cycle, while
retaining flexibility to capture the opportunistic upside
CRUDE OIL DERIVATIVE PRICE SWAPS - NYMEX NATURAL GAS DERIVATIVE PRICE SWAPS - NYMEX
Total
Contract Barrels Per Day Total Hedged Weighted Average Price Contract Million British Thermal Units Per Day Hedged Weighted Average Price
Period (Bbls/d) Volumes (Bbls) ($/Bbl) Period (mmbtu/d) Volumes ($/mmbtu)
(mmbtu)
2022(1): Q4 30,400 2,796,800 $64.17 Q4 99,891 9,190,000 $3.537
Avg./Total 30,400 2,796,800 $64.17 Avg./Total 99,891 9,190,000 $3.537
2023(1): Q1 20,700 1,863,000 $72.43 Q1 73,611 6,985,000 $4.071
Q2 22,000 2,002,000 $76.15 Q2 43,978 4,002,000 $4.481
Q3 17,625 1,621,500 $77.68 Q3 43,500 4,002,000 $4.525
Q4 17,000 1,564,000 $76.52 Q4 35,620 3,277,000 $4.579
Avg./Total 19,316 7,050,500 $75.60 Avg./Total 50,044 18,266,000 $4.351
2024(1): Q1 7,075 643,825 $78.10 Q1 25,055 2,280,000 $4.424
Q2 7,050 641,550 $77.04 Q2 22,242 2,024,000 $3.938
Q3 6,875 632,500 $75.34 Q3 22,000 2,024,000 $3.938
Q4 2,825 259,900 $69.63 Q4 11,272 1,037,000 $3.869
Avg./Total 5,950 2,177,775 $75.98 Avg./Total 20,123 7,365,000 $4.079
1. This table does not include volumes subject to swaptions, basis swaps, and call options, which could increase the amounts of volumes hedged at the option of NOG’s counterparties. For additional information, see Note 11 to our financial statements included in our Form 10-Q
filed with the SEC for the year ended September 30, 2022.
24HEDGE PROFILE – COLLARS
NYSE: NOG
NOG continues to execute a strategy built around the safeguard of returns during a commodity down-cycle, while
retaining flexibility to capture the opportunistic upside
CRUDE OIL DERIVATIVE COLLARS NATURAL GAS DERIVATIVE COLLARS
Contract Barrels Per Day Price Ceiling Price Floor Million British Thermal Units Price Ceiling Price Floor
Contract Period
Period (Bbls/d) ($/Bbl) ($/Bbl) Per Day (mmbtu/d) ($/mmbtu) ($/mmbtu)
2022(1): Q4 1,000 $100.00 $75.00 Q4 10,842 $7.741 $3.617
Avg./Total 1,000 $100.00 $75.00 Avg./Total 10,842 $7.741 $3.617
2023(1): Q1 8,075 $94.95 $78.54 Q1 35,000 $6.958 $4.143
Q2 6,250 $91.46 $76.00 Q2 52,500 $6.577 $4.190
Q3 7,250 $89.95 $75.17 Q3 55,000 $6.674 $4.182
Q4 8,250 $88.17 $74.55 Q4 68,315 $6.902 $4.134
Avg./Total 7,456 $91.06 $76.07 Avg./Total 52,801 $6.771 $4.162
2024(1): Q1 7,625 $85.62 $70.08 Q1 17,500 $7.917 $4.000
Q2 5,875 $85.62 $69.36 Q2 2,500 $8.700 $4.000
Q3 7,125 $83.43 $69.04 Q3 - - -
Q4 6,375 $84.16 $69.22 Q4 - - -
Avg./Total 6,750 $84.58 $69.44 Avg./Total 4,973 $8.015 $4.000
2025(1): Q1 1,500 $80.77 $70.00 Q1 - - -
Q2 1,500 $77.94 $70.00 Q2 - - -
Q3 1,250 $76.01 $70.00 Q3 - - -
Q4 1,000 $78.02 $70.00 Q4 - - -
Avg./Total 1,311 $78.62 $70.00 Avg./Total - - -
1. This table does not include volumes subject to swaptions, basis swaps, and call options, which could increase the amounts of volumes hedged at the option of NOG’s counterparties. For additional information, see Note 11 to our financial statements included in our Form 10-
Q filed with the SEC for the year ended September 30, 2022.
25HISTORICAL OPERATING & FINANCIAL INFORMATION
NYSE: NOG
Historical Operating Information Years Ended December 31,
2019 2020 2021 3Q21 3Q22
Production
Oil (MBbls) 11,325.4 9,361.1 12,288.4 3,131.2 4,149.8
Natural Gas and NGLs (Mmcf) 16,590.8 16,473.3 44,073.9 13,034.3 18,776.8
Total Production (Mboe) 14,090.5 12,106.7 19,634.1 5,303.6 7,279.3
Revenue
Realized Oil Price, including settled derivatives ($/bbl) $ 54.66 $ 52.69 $ 52.77 $ 52.39 $ 71.42
Realized Natural Gas and NGL Price, including settled derivatives ($/Mcf) $ 1.60 $ 1.14 $ 3.65 $ 3.02 $ 6.00
Total Oil & Gas Revenues, including settled derivatives (millions) $ 645.6 $ 512.3 $ 809.3 $ 131.5 $ 409.1
Adjusted EBITDA (millions) $ 454.2 $ 351.8 $ 543.0 $ 136.1 $ 292.4
Key Operating Statistics ($/Boe)
Average Realized Price $ 45.82 $ 42.32 $ 41.22 $ 38.34 $ 56.21
Production Expenses 8.44 9.61 8.70 8.15 9.41
Production Taxes 4.10 2.46 3.92 3.76 5.81
(2)
General & Administrative Expenses - Cash Adjusted 1.11 1.19 0.94 0.78 0.82
Total Cash Costs $ 13.65 $ 13.26 $ 13.56 $ 12.69 $ 16.04
Operating Margin ($/Boe) $ 32.17 $ 29.06 $ 27.66 $ 25.65 $ 40.17
Operating Margin % 70.2% 68.7% 67.1% 66.9% 71.5%
Historical Financial Information ($'s in millions) Years Ended December 31,
2019 2020 2021 3Q21 3Q22
Assets
Current Assets $ 133.0 $ 125.6 $ 215.3 $ 167.6 $ 376.7
Property and Equipment, net 1,748.6 735.2 1,253.3 1,064.5 2,015.1
Other Assets 23.8 11.3 54.3 12.0 79.7
Total Assets $ 1,905.4 $ 872.1 $ 1,522.9 $ 1,244.1 $ 2,471.5
Liabilities
Current Liabilities $ 203.5 $ 182.5 $ 327.6 $ 355.2 $ 381.7
Long-term Debt, net 1,118.2 879.8 803.4 858.4 1,169.2
Other Long-Term Liabilities 25.1 33.1 176.8 188.2 211.5
Stockholders' Equity (Deficit) 558.6 (223.3) 215.1 (157.7) 709.1
Total Liabilities & Stockholders' Equity (Deficit) $ 1,905.4 $ 872.1 $ 1,522.9 $ 1,244.1 $ 2,471.5
Credit Statistics
(1)
Adjusted EBITDA (Annual, Q3 2021/22 TTM) $ 454.2 $ 351.8 $ 543.0 $ 462.0 $ 996.8
Net Debt $ 1,111.7 $ 948.3 $ 795.5 $ 867.0 $ 1,161.5
Total Debt $ 1,127.7 $ 949.8 $ 805.0 $ 869.0 $ 1,170.6
(1)
Net Debt/Adjusted EBITDA 2.4x 2.7x 1.5x 1.9x 1.2x
(1)
Total Debt/Adjusted EBITDA 2.5x 2.7x 1.5x 1.9x 1.2x
1. Adjusted EBITDA is a non-GAAP measure. See reconciliation on the slide that follows.
2. Excludes certain acquisition related expenses
26NON-GAAP RECONCILIATIONS: ADJUSTED EBITDA & OTHER
NYSE: NOG
Adjusted EBITDA by Year (in thousands)
2019 2020 2021
Net Income (Loss) $ (76,318) $ (906,041) $ 6,361
Add:
Interest Expense 79,229 58,503 59,020
Income Tax Provision (Benefit) - (166) 233
Depreciation, Depletion, Amortization and Accretion 210,201 162,120 140,828
Impairment of Oil and Natural Gas Properties - 1,066,668 -
Impairment of Other Current Assets 6,398 - -
Non-Cash Share Based Compensation 7,954 4,119 3,621
Write-off of Debt Issuance Costs - 1,543 -
(Gain) Loss on the Extinguishment of Debt 23,187 3,718 13,087
Debt Exchange Derivative (Gain) Loss (1,390) - -
Contingent Consideration (Gain) Loss 29,512 169 292
Severance - Cash 759 - -
Acquisition Costs - - 8,190
Financing Expense 1,447 - -
(Gain) Loss on Unsettled Interest Rate Derivatives - 1,019 (1,043)
(Gain) Loss on Unsettled Commodity Derivatives 173,214 (39,878) 312,370
Adjusted EBITDA $ 454,193 $ 351,774 $ 542,959
Adjusted EBITDA by Quarter (in thousands)
1Q21 2Q21 3Q21 4Q21 1Q22 2Q22 3Q22
Net Income (Loss) $ (90,357) $ (90,563) $ 12,553 $ 174,727 $ (206,560) $ 251,264 $ 583,465
Add:
Interest Expense 13,510 15,024 14,586 15,899 17,978 18,410 20,135
Income Tax Provision (Benefit) - - - 233 789 1,006 1,333
Depreciation, Depletion, Amortization and Accretion 31,221 30,908 35,885 42,814 53,185 54,796 65,975
Non-Cash Share Based Compensation 768 779 699 1,374 1,447 1,421 1,341
(Gain) Loss on the Extinguishment of Debt 12,594 494 - - - (236) (339)
Contingent Consideration (Gain) Loss 125 250 (82) - - - -
Acquisition Transaction Costs 2,511 3,016 677 1,986 6,848 514 2,932
(Gain) Loss on Unsettled Interest Rate Derivatives (240) (121) (92) (589) (1,290) (524) 42
(Gain) Loss on Unsettled Commodity Derivatives 128,638 173,057 71,845 (61,170) 384,227 (54,117) (382,500)
Adjusted EBITDA $ 98,770 $ 132,844 $ 136,071 $ 175,274 $ 256,623 $ 272,534 $ 292,384
Other Non-GAAP Metrics by Quareter (in thousands)
1Q21 2Q21 3Q21 4Q21 1Q22 2Q22 3Q22
Total General and Adminstrative Expense $ 6,783 $ 7,605 $ 5,490 $ 10,463 $ 13,813 $ 8,065 $ 10,277
Non-cash General and Adminstrative Expense 769 779 699 1,374 1,447 1,421 1,341
Total General and Adminstrative Expense - Cash 6,014 6,826 4,791 9,089 12,366 6,644 8,936
Less: Acquisition Costs - Cash (2,511) (3,016) (677) (1,986) (6,848) (514) (2,932)
Total General and Adminstrative Expense - Cash Adjusted $ 3,503 $ 3,810 $ 4,114 $ 7,103 $ 5,518 $ 6,130 $ 6,004
Total Principal Balance on Debt $ 828,669 $ 813,000 $ 869,000 $ 805,000 $ 1,121,000 $ 1,103,625 $ 1,170,555
Less: Cash and Cash Equivalents (2,729) (4,843) (2,006) (9,519) (3,335) (1,471) (9,129)
Net Debt $ 825,940 $ 808,157 $ 866,994 $ 795,481 $ 1,117,665 $ 1,102,154 $ 1,161,426
Note: Adjusted EBITDA is a non-GAAP measure
27NON-GAAP RECONCILIATIONS: ROCE & RECYCLE RATIO
NYSE: NOG
Q3:22 Return on Capital Employed (ROCE)
• EBIT: $905.6MM (Q3:22 annualized)
• + Adj. EBITDA: $292.4MM
• - DD&A: $66.0MM
Capital
EBIT ÷ Employed
= 60.8% • Capital Employed: $1,489.3MM (Avg. of Q3:21/22)
• + Total Assets: $1,857.8MM (Avg.)
• - Current Liabilities: $368.5MM (Avg.)
Q3:22 Return on Capital Employed (ROCE) - Adjusted to exclude impairment charges post Q2:20
• EBIT: $827.1MM (Q3:22 annualized)
• + Adj. EBITDA: $292.4MM
Capital - DD&A: $85.6MM
÷ =
•
EBIT 34.3%
Employed • Capital Employed: $2,410.0MM (Avg. of Q3:21/22)
• + Total Assets: $2,778.5MM (Avg.)
• - Current Liabilities: $368.5MM (Avg.)
Q3:22 Recycle Ratio
• Cash Margin: $40.17/boe
• + Realized avg. commodity price: $56.21/boe
Cash Margin ÷ DD&A = 4.43x • - Cash Costs: $16.04/boe(1)
• DD&A Rate: $9.06/boe
1. Incorporates Adjusted Cash G&A of $0.82/boe, which excludes certain acquisition related expenses
Note: Adjusted EBITDA is a non-GAAP measure. Numbers may be off due to rounding.
28NON-GAAP RECONCILIATIONS: FREE CASH FLOW
NYSE: NOG
Free Cash Flow (FCF)
(in thousands) 1Q21 2Q21 3Q21 4Q21 1Q22 2Q22 3Q22
Net Cash Provided by Operating Activities $ 62,766 $ 106,186 $ 94,413 $ 133,102 $ 154,034 $ 210,239 $ 276,766
Exclude: Changes in Working Capital and Other Items 20,814 12,204 27,888 24,906 80,985 41,948 (7,505)
(1)
Less: Capital Expenditures (38,085) (68,445) (63,278) (83,671) (86,020) (135,055) (156,095)
Less: Series A Preferred Dividends (3,830) (3,719) (3,605) (3,605) (3,016) (2,810) (2,610)
Free Cash Flow $ 41,665 $ 46,226 $ 55,418 $ 70,732 $ 145,983 $ 114,322 $ 110,556
(1)
Capital Expenditures are calculated as follows:
Cash Paid for Capital Expenditures $ 52,672 $ 169,679 $ 163,120 $ 228,751 $ 417,482 $ 106,740 $ 301,240
Less: Non-Budgeted Acquisitions (17,500) (119,207) (106,197) (146,753) (344,264) 3,288 (151,303)
Plus: Change in Accrued Capital Expenditures and Other 2,913 17,973 6,355 1,673 12,802 25,027 6,158
Capital Expenditures $ 38,085 $ 68,445 $ 63,278 $ 83,671 $ 86,020 $ 135,055 $ 156,095
29DISCLAIMER
NYSE: NOG
Forward Looking Statements
This presentation contains forward-looking statements regarding future events and future results that are subject to the safe harbors created under the Securities Act
of 1933, as amended (the “Securities Act”) and the Securities Exchange Act of 1934, as amended (the “Exchange Act”). All statements other than statements of
historical facts included in this presentation regarding Northern Oil and Gas, Inc.’s (“NOG,” “we,” “us” or “our”) dividend plans and practices, financial position,
operating and financial performance, business strategy, plans and objectives of management for future operations, industry conditions, indebtedness covenant
compliance, capital expenditures, production, and cash flow are forward-looking statements. When used in this presentation, forward-looking statements are
generally accompanied by terms or phrases such as “estimate,” “project,” “predict,” “believe,” “expect,” “continue,” “anticipate,” “target,” “could,” “plan,” “intend,”
“seek,” “goal,” “will,” “should,” “may” or other words and similar expressions that convey the uncertainty of future events or outcomes. Items contemplating or
making assumptions about actual or potential future sales, market size, collaborations, and trends or operating results also constitute such forward-looking
statements.
Forward-looking statements involve inherent risks and uncertainties, and important factors (many of which are beyond our company’s control) that could cause
actual results to differ materially from those set forth in the forward-looking statements, including the following: changes in NOG’s capitalization; changes in crude oil
and natural gas prices; the pace of drilling and completions activity on NOG’s properties; NOG’s ability to acquire additional development opportunities; the
projected capital efficiency savings and other operating efficiencies and synergies resulting from NOG’s acquisition transactions; integration and benefits of property
acquisitions, or the effects of such acquisitions on NOG’s cash position and levels of indebtedness; changes in NOG’s reserves estimates or the value thereof;
infrastructure constraints and related factors affecting NOG’s properties; cost inflation or supply chain disruption; ongoing legal disputes over and potential shutdown
of the Dakota Access Pipeline; the COVID-19 pandemic and its related economic repercussions and effect on the oil and natural gas industry; general economic or
industry conditions, nationally and/or in the communities in which NOG conducts business; changes in the interest rate environment, legislation or regulatory
requirements; conditions of the securities markets; NOG’s ability to raise or access capital; cyber-related risks; changes in accounting principles, policies or guidelines;
and financial or political instability, health-related epidemics, acts of war or terrorism, and other economic, competitive, governmental, regulatory and technical
factors affecting NOG’s operations, products and prices. Additional information concerning potential factors that could affect future results is included in the section
entitled “Item 1A. Risk Factors” and other sections of NOG’s most recent Annual Report on Form 10-K and subsequent Quarterly Reports on Form 10-Q, as updated
from time to time in amendments and subsequent reports filed with the SEC, which describe factors that could cause NOG’s actual results to differ from those set
forth in the forward-looking statements.
NOG has based these forward-looking statements on its current expectations and assumptions about future events. While management considers these expectations
and assumptions to be reasonable, they are inherently subject to significant business, economic, competitive, regulatory and other risks, contingencies and
uncertainties, most of which are difficult to predict and many of which are beyond NOG’s control. NOG does not undertake any duty to update or revise any forward-
looking statements, except as may be required by the federal securities laws.
30DISCLAIMER (Cont.)
NYSE: NOG
Industry and Marketing Data
Although all information and opinions expressed in this presentation, including market data and other statistical information (including estimates and projections
relating to addressable markets), were obtained from sources believed to be reliable and are included in good faith, NOG has not independently verified the
information and makes no representation or warranty, express or implied, as to its accuracy or completeness. Some data is also based on the good faith estimates of
NOG, which are derived from its review of internal sources as well as the independent sources described above. This presentation contains preliminary information
only, is subject to change at any time and, is not, and should not be assumed to be, complete or to constitute all the information necessary to adequately make an
informed decision regarding your engagement with NOG. While NOG is not aware of any misstatements regarding the industry and market data presented in this
presentation, such data involve risks and uncertainties and are subject to change based on various factors, including those factors discussed under “Forward Looking
Statements” above. NOG has no intention and undertakes no obligation to update or revise any such information or data, whether as a result of new information,
future events or otherwise, except as required by law.
Non-GAAP
This presentation includes certain financial measures that are not calculated in accordance with U.S. generally accepted accounting principles (“GAAP”). These
measures include (i) EBITDA, (ii) Adjusted EBITDA, (iii) Net Debt, (iv) Return on Capital Employed (“ROCE”), (v) Recycle Ratio and (iv) Free Cash Flow. These non-GAAP
financial measures are not measures of financial performance prepared or presented in accordance with GAAP and may exclude items that are significant in
understanding and assessing our financial results. Therefore, these measures should not be considered in isolation, and users of any such information should not
place undue reliance thereon. Please refer to the slides titled “Non-GAAP Reconciliations: Adjusted EBITDA & Other,” “Non-GAAP Reconciliations: ROCE & Recycle
Ratio,” “Non-GAAP Reconciliations: Free Cash Flow” under the Appendix to this presentation for a reconciliation of these measures to the most directly comparable
GAAP measures and NOG’s definitions (which may be materially different than similarly titled measures used by other companies) of these measures as well as
certain additional information regarding these measures. NOG believes the presentation of these metrics may be useful to investors because it supplements
investors’ understanding of its operating performance by providing information regarding its ongoing performance that excludes items it believes do not directly
affect its core operations. From time to time NOG provides forward-looking Free Cash Flow estimates or targets; however, NOG is unable to provide a quantitative
reconciliation of the forward looking non-GAAP measure to its most directly comparable forward-looking GAAP measure because management cannot reliably
quantify certain of the necessary components of such forward-looking GAAP measure. The reconciling items in future periods could be significant.
31You can also read