DRIVEN BY POSSIBILITY FEBRUARY 2022
←
→
Page content transcription
If your browser does not render page correctly, please read the page content below
DRIVEN BY POSSIBILITY                                   FEBRUARY 2022

Confidential information. Use and disclosure limited for Gates business purposes only. © 2022 Gates. All rights reserved.
LEGAL DISCLAIMERS                                                                                                                                                                      2

FORWARD-LOOKING STATEMENTS
This presentation contains, and management may make on our call today, forward-looking statements within the meaning of Section 27A of the Securities Act of 1933, as amended, and Section 21E of the Securities
Exchange Act of 1934, as amended. In some cases, you can identify these forward-looking statements by the use of words such as "outlook," "believes," "expects," "potential," "continues," "may," "will," "should,"
"could," "seeks," "predicts," "intends,“ “trends,” "plans," "estimates," "anticipates" or the negative version of these words or other comparable words. These statements include, but are not limited to, statements
related to expectations regarding the performance of the Company’s business and financial results (including organic and inorganic growth, cash flow generation and margin improvement), expectations regarding
margin headwinds (including inflation, supply chain, logistical and labor challenges, and operational inefficiencies) and the success of related pricing actions, the robust demand environment (including strong order
intake trends and growing pipeline of opportunities), liquidity and capital resources including deleveraging providing capital allocation flexibility, M&A as a growth accelerator, productivity and product innovation and
initiatives, sustainability initiatives, portfolio optimization including the continuing shift towards higher-growth markets, and statements regarding the impact of and the recovery from the COVID-19 pandemic and the
Company’s target growth model, mid-term targets and outlook for 2022. Such forward-looking statements are subject to various risks and uncertainties, including, among others, the volatility and uncertainties
relating to the impact of the COVID-19 pandemic and associated governmental measures on the Company’s business, operations, employees, financial condition and results of operations, risks inherent to the
manufacturing industry, macroeconomic factors beyond the Company’s control (including material and logistics availability, inflation, supply chain and labor challenges and end-market recovery), continued operation
of our manufacturing facilities, our ability to forecast and meet demand, market acceptance of new products, and the significant influence of the Company’s majority shareholders, investment funds affiliated with
Blackstone Inc. Additional factors that could cause the Company’s results to differ materially from those described in the forward-looking statements can be found under the section entitled "Risk Factors" of the
Company’s Annual Report on Form 10-K for the fiscal year ended January 1, 2022, filed with the Securities and Exchange Commission ("SEC"), as such factors may be further updated from time to time in the
Company’s periodic filings with the SEC, which are accessible on the SEC’s website at www.sec.gov. Accordingly, there are or will be important factors that could cause actual outcomes or results to differ materially
from those indicated in these statements. These factors should not be construed as exhaustive and should be read in conjunction with the other cautionary statements that are included in the Company’s filings with
the SEC. The Company undertakes no obligation to publicly update or review any forward-looking statement, whether as a result of new information, future developments or otherwise, except as required by law.

NON-GAAP FINANCIAL INFORMATION
This presentation includes certain non-GAAP financial measures, which management believes are useful to investors. Non-GAAP financial measures should be considered only as supplemental to, and not as superior
to, financial measures prepared in accordance with GAAP. Please refer to the Appendix of this presentation and our earnings release filed with the SEC and posted on our website at investors.gates.com for a
reconciliation of historical non-GAAP financial measures to the most directly comparable financial measures prepared in accordance with GAAP.

Because GAAP financial measures on a forward-looking basis are not accessible, and reconciling information is not available without unreasonable effort, we have not provided reconciliations for forward-looking non-
GAAP measures. For the same reasons, we are unable to address the probable significance of the unavailable information, which could be material to future results.

ROUNDING ADJUSTMENTS
Certain monetary amounts, percentages and other figures included in this presentation have been subject to rounding adjustments. Accordingly, figures shown as totals in certain tables or charts may not be the
arithmetic aggregation of the figures that precede them, and figures expressed as percentages in the text may not total 100% or, as applicable, when aggregated, may not be the arithmetic aggregation of the
percentages that precede them.

Confidential information. Use and disclosure limited for Gates business purposes only. © 2022 Gates. All rights reserved.
INVESTMENT HIGHLIGHTS                                                                      3

▪ Organic Initiatives Delivering Strong Growth

▪ Innovation Opening New Market Opportunities

▪ Driving Sustainability across the Enterprise

▪ Increasing Profitability through GPS & Innovation

▪ Strong Free Cash Flow Generation

▪ Improved Net Leverage Provides Capital Allocation Flexibility

▪ M&A as a Growth Accelerator

Confidential information. Use and disclosure limited for Gates business purposes only. © 2022 Gates. All rights reserved.

GATES VISION                                                                               4

                             ACHIEVE GLOBAL PRODUCT INNOVATION LEADERSHIP
              AND EXPAND OUR PREMIER POSITION IN OUR CORE POWER
                                               TRANSMISSION AND FLUID POWER MARKETS,

                                               WHILE DELIVERING ABOVE-MARKET GROWTH,
 SUPERIOR PROFITABILITY AND STRONG CASH FLOW GENERATION
                    TO PROVIDE SHAREHOLDERS WITH ATTRACTIVE RETURNS

Confidential information. Use and disclosure limited for Gates business purposes only. © 2022 Gates. All rights reserved.
POWER TRANSMISSION – SEGMENT OVERVIEW                                                                                                                                                                    5

   2021 REVENUE: $2.2B                                                                                                                       SUMMARY
                                                                                                                                             ▪   Leading global belt provider
            BY REGION                                                                   BY CHANNEL                                           ▪   Broadest catalog of mission-critical components
    EA&I
                                                           FIRST-FIT                                                         REPLACEMENT     ▪   Replacement market focus                     IR
                14%                        NA              • Diversified                                                     • Automotive    ▪   Diverse customers, applications and end markets
CHINA                           35%                          Industrial                                                      • Diversified
                                                                                        37%
         16%                                               • On-Highway                                                        Industrial    ▪   Global footprint and channel coverage
                                                           • Off-Highway                                         63%         • On-Highway    ▪   Unique belt drive system value propositions
                                                                                                                                                                                     IFF
                                                           • Automotive                                                      • Energy
                  31%                   4%
  EMEA
                                        SA
                                                                                                                             • Off-Highway
                                                                                                                                             MARKET OPPORTUNITY
                                                                                                                                             ▪ One of few scaled players in large, fragmented $36B
   PRODUCT PORTFOLIO                                                                                                                           addressable market1
                                                                                                                                                                     Gates

        Micro-V                          Timing                     Engine Metal                  Mechanical Water                   Kits
         Belts                            Belts                     Components                        Pumps
                                                                                                                                                        $36B

             Industrial                          Industrial                            Industrial                 Industrial Metal
         Synchronous Belts                   Asynchronous Belts                        TPU Belts                    Components                   Total Addressable Market

                                                                                          SIGNIFICANT GROWTH OPPORTUNITIES IN EXISTING MARKETS
                                                                                                                                                             1. Market sizes referred to throughout this presentation are based on management estimates
        Confidential information. Use and disclosure limited for Gates business purposes only. © 2022 Gates. All rights reserved.
FLUID POWER – SEGMENT OVERVIEW                                                                                                                                                                                  6

  2021 REVENUE: $1.3B                                                                                                                            SUMMARY
                                                                                                                                                 ▪ Mission-critical components for hydraulic and fluid
                                                                                    BY CHANNEL                                                     conveyance applications
     EA&I
         7%                                                                                                              REPLACEMENT             ▪ Core market with several avenues for growth
                                                                                                                                                                                             IR
  CHINA                           NA                    FIRST-FIT
        5%                                              • Off-Highway                                             • Diversified                  ▪ Favorable replacement dynamics
                                                                                                                    Industrial
EMEA 20%
                                                        • On-Highway               35%                            • Off-Highway
                                                                                                                                                 ▪ Heritage of product innovation
                                                        • Diversified
                             64%                          Industrial                                          65% • Energy                       ▪ Extending premium product line within existing
                                                                                                                  • Automotive                     applications
    4%                                                                                                            • On-Highway                                                            IFF
  SA                                                                                                                                                                                                                     AR
                                                                                                                                                MARKET OPPORTUNITY
  PRODUCT PORTFOLIO                                                                                                                             ▪ One of few scaled players in large, fragmented $29B
                                                                                                                                                  addressable market1
                                                                                                                                                                       Gates

                                                                                                                                                           $29B
  Hydraulic Hose                        Hydraulic                      Industrial Hose                   Thermal                 Oil & Gas
  and Couplings                          Tubing                         and Couplings                  Management               Drilling Hose
                                                                                                      Hose / Electric
                                                                                                       Water Pumps
                                                                                                                                                    Total Addressable Market

      LEADER IN A HIGHLY FRAGMENTED MARKET WITH OPPORTUNITY TO GROW ACROSS PRODUCT LINES, REGIONS AND END MARKETS
                                                                                                                                                                1. Market sizes referred to throughout this presentation are based on management estimates
    Confidential information. Use and disclosure limited for Gates business purposes only. © 2022 Gates. All rights reserved.
HISTORY OF TRANSFORMATION                                                                                                                                       7

                            2015-2017 STABILIZE                                                                                2018-2020 INVEST                       2021+ INFLECT
                        ▪      Deployed Gates Production                                                       ▪       3 New Factories Online                ▪     Outgrow the Market Organically
                               System                                                                          ▪       Footprint Optimization
                        ▪      Established Global HSE, Quality &                                               ▪       Globalized and Standardized Key       ▪     Expand Earnings
OPERATIONS                     Sourcing functions                                                                      Production Processes                  ▪     De-Lever the Balance Sheet
                      ▪      Invested in Materials Science,                                                    ▪       30+ New Product Platform Launches     ▪     Accelerate M&A
                             Product & Process R&D Capability                                                  ▪       Start-Up of Proprietary
                                                                                                                       Manufacturing Processes               ▪     Transform the Portfolio
INNOVATION                                                                                                     ▪       Built R&D COEs in EMEA and India

                      ▪      Strengthened IT Systems                                                           ▪       Application and Infrastructure             MID-TERM TARGETS
                                                                                                                       Investments
                                                                                                                                                                 REVENUE                      $4B+
                                                                                                               ▪       Launched IoT Platform, Mobile Apps,
 DIGITAL                                                                                                               Customer Portal and eCommerce             ADJ. EBITDA %               24%+
                      ▪      Rebuilt Leadership Team                                                           ▪       Accelerated Restructuring                 ROIC                        20%+
                      ▪      Realigned around Product                                                          ▪       Implemented Shared Service Centers
                             Segments                                                                                  for Customer Service, Marketing,
                                                                                                                                                                 CASH FLOW CONV.             100%+
  TEAM                                                                                                                 Finance, HR and IT                        NET LEVERAGE                 ~2x

                              DRIVING SHAREHOLDER VALUE BY TRANSFORMING GATES INTO A LEADING PREMIUM INDUSTRIAL COMPANY
   Confidential information. Use and disclosure limited for Gates business purposes only. © 2022 Gates. All rights reserved.
END MARKETS – 2021 NET SALES 8
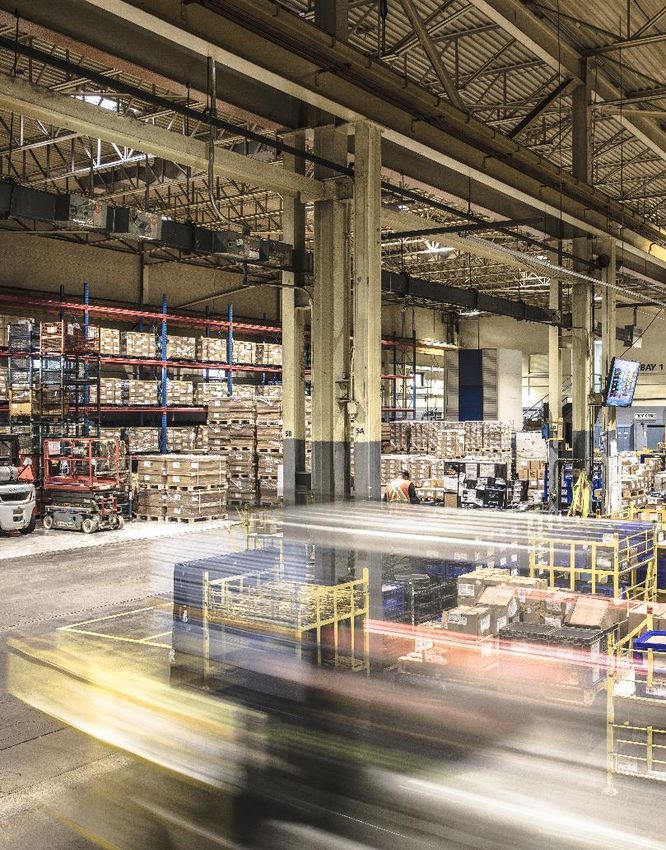
DIVERSIFIED INDUSTRIAL
▪ General/Light Mfg. ▪ Industrial Automation ▪ Forestry, Packaging & Paper
▪ Pharma & Healthcare ▪ Warehousing ▪ Lawn, Garden & Landscaping
▪ Process Industries ▪ Logistics ▪ Consumer & Office Products
▪ Food & Beverage ▪ Building Products ▪ HVAC & Building Automation
ENERGY & 21% MOBILITY &
5%
RESOURCES 4% RECREATION
▪ O&G ▪ Bikes, Motorcycles, Scooters
▪ Mining ▪ Powersports Vehicles
▪ Renewables 20% ▪ Fitness Equipment
INDUSTRIAL 31%
OFF-HIGHWAY 9%
AUTO
▪
▪
Ag
Construction 10%
REPLACEMENT
▪ Independent Repair Shops
▪ eCommerce
INDUSTRIAL ▪ Dealer Service
ON-HIGHWAY AUTO OEM
▪ Heavy-Duty Truck ▪ Passenger Vehicles
▪ Bus ▪ Light Commercial Vehicles
ATTRACTIVE AND DIVERSE SET OF END MARKETS
WITH STRONG SECULAR TRENDS SUCH AS ENVIRONMENTAL SUSTAINABILITY, INDUSTRIAL AUTOMATION AND ELECTRIFICATION
Confidential information. Use and disclosure limited for Gates business purposes only. © 2022 Gates. All rights reserved.
ECO-INNOVATION DRIVING SUSTAINABILITY AND GROWTH                                                                                                                                                                                     9

 GATES INNOVATION SYSTEM                                                                                                    SUSTAINABLE OPERATIONS
                                  MATERIALS
                                   SCIENCE

                                                                                                                                -23%                                               -28%                                                -12%
                                                                                                                                   GHG                                               Water                                               Energy
    PRODUCT                                                  PROCESS                                                             Emissions
                                                                                                                                          1
                                                                                                                                                                                  Consumption
                                                                                                                                                                                              2
                                                                                                                                                                                                                                      Consumption
                                                                                                                                                                                                                                                  3

  ENGINEERING                                              ENGINEERING
                                                                                                                            ▪ Operational improvements 2015 to 2020, despite COVID-19 challenges in 2020

 SUSTAINABLE PRODUCTS                                                                                                       SUSTAINABLE APPLICATION BENEFITS
      ▪      New products use less material to
             achieve better performance
      ▪      Shifting towards more                                                                                          Lightweight                           Efficient                                 Safe                                  Clean
             environmentally friendly compounds

                   Gates Sustainability Reports                                                                              Reliable                            Leak Free                            Lubricant Free                              Quiet

                            ECO-INNOVATION DRIVING SUSTAINABILITY – ENABLING ENTRY INTO NEW END MARKETS AND APPLICATIONS
                                                                                                                                1. Metric tons of CO2 equivalent
                                                                                                                                2. Cubic meters of water
Confidential information. Use and disclosure limited for Gates business purposes only. © 2022 Gates. All rights reserved.       3. Kilowatt hours
                                                                                                                                All metrics are indexed by Net Sales in Gates Operations and compare 2020 vs. 2015, in accordance with 2020 Sustainability Report protocols
GATES PRODUCTION SYSTEM (GPS)                                                                                                                               10

  COMMON ATTRIBUTES OF                                                                                                           INNOVATION DIFFERENTIATES THE
  INDUSTRIAL BUSINESS SYSTEMS                                                                                                    GATES PRODUCTION SYSTEM
           -25%                                                                   -36%                                               PRODUCT                                      PROCESS
                 Safety                                                                 Safety                                      INNOVATION                                   INNOVATION
Total Case Incident Rate (TCIR)                                   Lost-Time Incident Rate (LTIR)                                   ▪   Less Material                       ▪     Higher Throughput
                                                                                                                                   ▪   Lighter Weight                      ▪     Increased Capacity

           -57%                                                                  Net Price
                                                                                  Offsets
                                                                                                                                   ▪
                                                                                                                                   ▪
                                                                                                                                   ▪
                                                                                                                                       More Flexible
                                                                                                                                       Higher Efficiency
                                                                                                                                       Higher Performance
                                                                                                                                                                           ▪
                                                                                                                                                                           ▪
                                                                                                                                                                           ▪
                                                                                                                                                                                 Reduced Scrap
                                                                                                                                                                                 Improved Quality
                                                                                                                                                                                 Less Energy and Water
                Quality
   Customer Defects (PPM)                                                        Inflation                                         ▪   Eco-Friendly Materials                    Usage

        +33%                                                                     +60%
        Throughput/Unit                                                          Throughput/Unit
                                                                                                                                 MXT Hydraulic   High-Efficiency      GT4              V-Force Xtreme
         Footprint (FP)                                                           Footprint (PT)
                                                                                                                                    Hose            Micro-V        Sync. Belts             V-Belts

     Note: Figures represent Gates 2017 to 2020 improvements

                                          GATES IS DELIVERING WORLD-CLASS OPERATING PERFORMANCE ENABLED BY GPS AND INNOVATION
     Confidential information. Use and disclosure limited for Gates business purposes only. © 2022 Gates. All rights reserved.
DIGITAL TRANSFORMATION 11
CUSTOMER EXPERIENCE & MARKETING E-COMMERCE
▪ Ease of doing business, demand generation & sales effectiveness ▪ Enabling channel partner eCommerce and touchless transactions
CRM & Marketing Gates.com GatesConnect.com EDI Integration with GatesConnect.com A+ Content Enables
Automation Global Website Customer Service Portal Key Customers Channel Partner eCommerce Channel Partner
& Order Management eCommerce
MOBILE APPS INTERNET OF THINGS
▪ Delivering the right content to the right locations at the right time ▪ Digitalizing our customer interface in the field
Increased sales, does not
Ease of Use require skilled labor
Onboard Training and GC20 users consume
Marketing Content more new products
Updated Crimp Ensures high-quality
Carbon Global eCrimp Hydraulic GC20 Connected hose/coupling assemblies
Specifications
Drive Catalog Crimp Specs Crimper in the field
SIGNIFICANT INVESTMENT UNDERWAY TO DIGITALIZE THE BUSINESS AND DELIVER WORLD-CLASS CUSTOMER EXPERIENCES
Confidential information. Use and disclosure limited for Gates business purposes only. © 2022 Gates. All rights reserved.TARGET GROWTH MODEL 12
MARKET GROWTH INITIATIVE GROWTH M&A GROWTH
▪ Large, Fragmented & ▪ New Product Innovation ▪ Diverse Landscape
Diversified Industrial
End Markets ▪ Geographic Expansion ▪ Investments in Place to
Support Synergies
▪ Secular Tailwinds ▪ Large Organic Initiatives
INDUSTRIAL
MARKET 2-3% 3-5%
TARGET 5-8% REVENUE
GROWTH ABOVE MARKET
1
GATES COMPARES FAVORABLY TO PREMIUM INDUSTRIAL PEERS OVER THE PAST SEVERAL INDUSTRIAL CYCLES & HAS
INVESTMENTS IN PLACE TO DRIVE CONTINUED ORGANIC GROWTH; STRENGTHENING BALANCE SHEET SUPPORTS M&A OPTIONALITY
1. Mean Core Growth of Premium Industrial Peers including EMR, ETN, GDI, GGG, IEX, ITW, MMM, PH, ROK, DCI and NDSN. Data based on information in
Confidential information. Use and disclosure limited for Gates business purposes only. © 2022 Gates. All rights reserved. publicly available company filings and presentations, including data aggregated by third-party source FactSetMOBILITY & RECREATION 13
DD GROWTH OPPORTUNITY
MARKET DYNAMICS GATES CONTENT OPPORTUNITIES
BICYCLE, SCOOTER, MOTORCYCLE & POWERSPORTS MOTORCYCLES,
250 VEHICLES BY PROPULSION TYPE1 40%
FITNESS SCOOTERS &
% Electrification
200 30%
30% BIKE/E-BIKE EQUIPMENT POWERSPORTS
150
Units (M)
20%
100 23%
Sprockets CVT Belt (ICE)
50 16% 10% Micro-V Tensioner
Belt
0 0%
2020 2025 2030 Pulley
Hub
ICE/Standard Electric EV %
Sync Belt Crankset Crankset Sprockets (EV) Sync Belt (EV)
GATES MOBILITY & RECREATION
300 NET REVENUE2
$250M+
$100-$200 $5-$100 $10-$150
250
200
$ (M)
150
100
100+% YoY
~2x Content 3
50 eBike Content 2x, Fitness Equipment
1-2x Auto ICE PT Content
0
2020A 2021A Mid-Term Target
SIGNIFICANT GROWTH OPPORTUNITY DRIVEN BY UNIQUE VALUE PROPOSITIONS FOR ELECTRIC MOBILITY AND HOME FITNESS
APPLICATIONS: CLEAN, QUIET, LIGHT, EFFICIENT & RELIABLE
1. bike-eu.com, South China Morning Post, businessinsider.com, alliedmarketresearch.com, inkwoodresearch.com and Management Estimates 2021
Confidential information. Use and disclosure limited for Gates business purposes only. © 2022 Gates. All rights reserved. 2. Revenue and outlook as of February 7, 2022
3. Management Estimates 2021DIVERSIFIED INDUSTRIAL 14
HSD GROWTH OPPORTUNITY
RECENT DESIGN WINS GATES OPPORTUNITIES
Unique value propositions across diverse applications
Energy Efficient CHAIN-TO-BELT BELT-TO-BELT
(C2B) (B2B)
Lightweight
Textile Manufacturing Machine Tools (FP) Robotics (C2B)
Clean, Quiet & Safe
Equipment (C2B) India Japan
India Maintenance Free
Reliable Converting Innovation-Driven Enabling Industrial
Industrial Chain Gains in Core Automation &
to Belt Drives Markets Logistics
Leak Free GEOGRAPHIC PREMIUM APPLICATION
Construction Equipment (FP) Landscaping Equipment (B2B) Packaging Equipment (C2B) EXPANSION PERFORMANCE COVERAGE
Canada Europe China Lightweight
Multi-Application
$200M+ GROWTH
Flexible
Clean & Safe Accelerating Extending Broadening Product
Penetration in Large Performance Portfolio to Enter
Focused initiatives driving above-market growth to achieve
International Differentiation New Markets
$200M target in the mid-term Markets through Innovation
ABOVE-MARKET GROWTH OPPORTUNITIES COMING FROM NEW PRODUCTS AND COMMERCIAL FOCUS
Confidential information. Use and disclosure limited for Gates business purposes only. © 2022 Gates. All rights reserved.AUTOMOTIVE ELECTRIFICATION 15
LSD/MSD GROWTH OPPORTUNITY
2
MARKET DYNAMICS ADRESSABLE CONTENT PER VEHICLE
150 AUTOMOTIVE PRODUCTION
1 INTERNAL COMBUSTION ENGINE (ICE)
BY PROPULSION TYPE • Accessory and Timing Drive Systems
Vehicles (M)
100 •
•
Electric Power Steering & Braking System
Thermal Management (Hose & Mechanical Water Pump)
$125
EV
• Other Engine Hose (Turbo, Fuel Line, SCR)
Hybrid
50 ICE
DECREMENTAL ELECTRIC VEHICLE (EV) CONTENT
0 - Accessory and Timing Drive Systems
2020 2025 2030 - Mechanical Water Pump – $100
- Other Engine Hose (Turbo, Fuel Line, SCR)
2,000 AUTOMOTIVE VEHICLES IN OPERATION
1
BY PROPULSION TYPE
1,500 INCREMENTAL EV CONTENT
Vehicles (M)
EV + Electric Water Pumps (Inverter)
1,000 + Electric Water Pumps (Battery) + $275
Hybrid + Increased Thermal Management Hose
500 ICE
0
NET ADDRESSABLE
2020 2025 2030 CONTENT PER VEHICLE = $300
ELECTRIFICATION-DRIVEN PROPULSION MIX SHIFT CREATES LONG-TERM GROWTH OPPORTUNITY FOR GATES
CONTENT PER VEHICLE INCREASES SIGNIFICANTLY
Confidential information. Use and disclosure limited for Gates business purposes only. © 2022 Gates. All rights reserved. 1. IHS Markit 2021
2. Management Estimates based on representative vehicle contentTHERMAL MANAGEMENT CONTENT: ICE VS. EV 16
INTERNAL COMBUSTION (ICE) FULL ELECTRIC (EV)
3 5
3
1
2
4
1 2 3 4 5
Mechanical Water Pump Molded Electric Water Pumps – Electric Water Pumps – Modular/Branched
Engine Block Coolant Hoses Auxiliary Applications (100W) Hose Assemblies
$8-$15 $15-$28 $30-$65 $75-$135 $110-$230
Estimates for Typical Content Based on Vehicles Observed
FAVORABLE THERMAL MANAGEMENT CONTENT OPPORTUNITY AS PROPULSION MIX EVOLVES FROM ICE TO FULL ELECTRIC –
INCREASED COMPONENT COMPLEXITY LEADS TO INCREASED AVERAGE UNIT SALES PRICE
Confidential information. Use and disclosure limited for Gates business purposes only. © 2022 Gates. All rights reserved.2021 – FINANCIAL PERFORMANCE 17
▪ Growth initiatives targeting end markets with secular
$3.5B 22% core growth ▪
tailwinds performed well
High-20’s core growth in industrial end markets, led by
Mobility & Recreation, Diversified Industrial and Off-Highway
Net Sales
▪ Mid-teens growth in automotive replacement channel
$736M
▪ Margin expansion of 310 basis points
45% growth ▪ Volume, pricing, restructuring benefits and productivity initiatives
(1)
offset inflation and costs related to supply chain and labor
Adjusted EBITDA challenges
$1.37 (2)
Increase of 96%
▪ Growth driven by higher operating income and lower interest
expense
Adjusted Earnings per Share
STRONG REVENUE AND EARNINGS GROWTH WHILE MANAGING THROUGH OPERATIONAL COMPLEXITIES
(1) Adjusted EBITDA and Adjusted EBITDA Margin are non-GAAP measures. See appendix for reconciliations
Confidential information. Use and disclosure limited for Gates business purposes only. © 2022 Gates. All rights reserved. (2)
Adjusted Net Income per diluted share. Adjusted earnings per share is a non-GAAP measure. See appendix for reconciliation2021 – CAPITAL EFFICIENCY & CASH FLOW 18
$295M
LTM Free Cash Flow
Year-over-year growth of 22%
▪
▪
Solid Free Cash Flow conversion while investing to support
significant growth
Year-over-year improvement of 270 bps in trade working
capital as a percentage of LTM sales
2.6x
Net Leverage
Net Leverage within targeted mid-term
range of 2.0x - 3.0x
▪
▪
Adjusted EBITDA growth and cash generation driving
continued reduction in Net Leverage
Year-over-year improvement of 1.7x
22.4%
ROIC
ROIC improving towards mid-20% range
▪
▪
Increase of 720 bps
Driven primarily by higher operating income
STRONG FREE CASH FLOW CONVERSION AND RETURN ON INVESTED CAPITAL
Notes: LTM Free Cash Flow: Net Cash Provided by Operations minus capital expenditures for the last twelve months; Free Cash Flow Conversion shown as % of Adjusted Net Income
Net Leverage: Net Debt (defined as the principal amount of our debt less the carrying amount of cash and cash equivalents) divided by LTM Adjusted EBITDA
ROIC: Tax-effected LTM Adjusted EBIT divided by total assets minus cash, accounts payable, income tax-related assets and intangibles related to 2014 acquisition of Gates
Confidential information. Use and disclosure limited for Gates business purposes only. © 2022 Gates. All rights reserved.OUTLOOK 19
FULL YEAR 20221
CORE FREE CASH
REVENUE ADJUSTED CAPITAL FLOW
GROWTH EBITDA ADJUSTED EPS EXPENDITURES CONVERSION
5% – 9% $755M – $805M $1.20 – $1.30 $100M – $120M > 90%
▪ Outlook accounts for continuing material availability challenges and COVID labor disruptions
▪ Full-year Adjusted EPS includes operating improvement of $0.15 offset by $0.27 of tax and other
headwinds at midpoint, primarily due to benefit from discrete tax items in 2021
Confidential information. Use and disclosure limited for Gates business purposes only. © 2022 Gates. All rights reserved.
1. Outlook as of February 7, 2022CORE GROWTH PERFORMANCE 20
TRACK RECORD MID-TERM TARGETS
▪ Core growth in 2017 and 2018 led by industrial end markets ▪ Consistent above-market growth
▪ 2019 impacted by trade uncertainty and resulting destocking ▪ Maintain >60% replacement channel mix
▪ Significant rebound in H2 2020 from COVID-19 impact ▪ Continued growth in larger industrial end
▪ Delivered substantial above-market core growth in 2021, markets
driven by growth initiatives and new products
REVENUE KEY INITIATIVES
▪ Chain-to-belt
$3,348M $3,474M
$3,042M $3,087M
$2,793M
• Industrial chain-to-belt conversion
+5.0% • Focused execution of thermoplastic
+9.0% +5.9% (5.7)% 21.7% to polyurethane (TPU) commercial strategy
(8.4)% +9.0%
• Mobility & recreation market penetration
1 ▪ Hydraulics expansion
2017 2018 2019 2020 2021 2022E
▪ Emerging markets
MAINTAIN SUSTAINABLE AND PROFITABLE LONG-TERM GROWTH PROFILE
Confidential information. Use and disclosure limited for Gates business purposes only. © 2022 Gates. All rights reserved. 1. Outlook as of February 7, 2022HISTORY OF MARGIN EXPANSION 21
TRACK RECORD MID-TERM TARGETS
▪ Demonstrated ability to expand margins ▪ 24%+ Adjusted EBITDA margin
▪ 2019 headwinds from destocking and lower volume, as well as
addition of new manufacturing facilities
▪ Solid decremental margins in 2020 despite large volume decline
▪ Supported significant increase in volume in 2021 while
delivering strong incremental margins
ADJUSTED EBITDA KEY INITIATIVES
▪ VA/VE initiatives to optimize performance and cost
$756M $780M
$736M
$669M ▪ New products with more efficient manufacturing
22.6% $611M 21.2%
22.0% $507M
processes
19.8%
18.1% ▪ Pricing actions to offset inflation
▪ Capitalize on operating leverage
▪ GPS drives continuous improvement in
2017 2018 2019 2020 2021
1
2022E manufacturing
MAINTAIN SUSTAINABLE AND PROFITABLE LONG-TERM GROWTH PROFILE
Confidential information. Use and disclosure limited for Gates business purposes only. © 2022 Gates. All rights reserved. 1. Outlook as of February 7, 2022ADJUSTED EBITDA – MARGIN EXPANSION OPPORTUNITY 22
▪ Growth initiatives primarily focused on higher-margin products
▪ Investments in new products and process innovation driving cost and throughput improvements
▪ GPS initiatives embedded in culture of continuous improvement
~100 bps
~50 bps
~75 bps
~50 bps
24%+
21.2%
20211 Base Business Initiative New Product Restructuring Mid-Term
Volume Volume & Process & GPS Target
SIGNIFICANT RUNWAY FOR MARGIN EXPANSION OVER THE MID-TERM
Confidential information. Use and disclosure limited for Gates business purposes only. © 2022 Gates. All rights reserved.INVESTING IN ORGANIC GROWTH WITH ATTRACTIVE RETURNS 23
TRACK RECORD MID-TERM TARGETS
▪ Maintenance capex historically ~1.5% of sales, growth ▪ Prioritization of investment in largest end markets
capex ~1.5% of sales ▪ ROIC consistently > 20%
▪ Large investment in new capacity behind us – elevated
capex in 2017 & 2018 reflects construction of new plants KEY INITIATIVES
▪ Returns on invested capital typically > 20% ▪ Support rollout of new technologies
▪ Upgrading manufacturing processes
CAPEX New Plant Other Growth Maintenance
▪ Digital capabilities to support growth
5.5%
ROIC2
3.6% 3.0%
25.2% 25.4%
0.8% 22.4%
2.7% 2.5% 19.2%
2.4%
1.3% 15.2%
1.0% 1.2% 0.9% 1.0%
~$110
1.5% 1.5% 1.5% 1.5% 1.5% ~1.5%
2017 2018 2019 2020 2021 2022E1 2017 2018 2019 2020 2021
REINVESTING IN DIVERSE SET OF INITIATIVES TO DRIVE ORGANIC GROWTH
1. Outlook as of February 7, 2022
Confidential information. Use and disclosure limited for Gates business purposes only. © 2022 Gates. All rights reserved. 2. ROIC: Tax-effected LTM Adjusted EBIT divided by total assets minus cash, accounts payable, income tax-related assets and intangibles related to
2014 acquisition of Gates, see appendix for reconciliationSTRONG CASH GENERATION 24
TRACK RECORD MID-TERM TARGETS
▪ Significant Free Cash Flow generation ▪ Consistent 100% Free Cash Flow conversion
▪ Demonstrated through periods of significant growth, ▪ Continued working capital improvement
as well as downturns
KEY INITIATIVES
FREE CASH FLOW 1
FCF New Capacity Capex
▪ Operating efficiency to reduce working
capital requirements
$295M
$278M ▪ Tax efficiency
100% $242M 72%
$234M $230M
112% 118% > 90%
61%
CASH
$266M CONV
$209M 95%
100% $131M
35%
2017 2018 2019 2020 2021 2022E2
CHARACTERISTICS OF BUSINESS RESULT IN STRONG THROUGH-THE-CYCLE CASH GENERATION
1. Free Cash Flow: Net Cash Provided by Operations minus capital expenditures; Free Cash Flow Conversion
Confidential information. Use and disclosure limited for Gates business purposes only. © 2022 Gates. All rights reserved. shown as % of Adjusted Net Income. These are non-GAAP measures, see appendix for reconciliation
2. Outlook as of February 7, 2022CAPEX AND CASH FLOW 25
CAPEX & RESTRUCTURING FREE CASH FLOW 1
▪ Major growth capacity investments already in place ▪ Adjusted EBITDA margin expansion
▪ Accelerated restructuring in 2020 ▪ Interest expense reduction
▪ Expect to operate at normalized capex run-rate of ~3% ▪ No major cash outlays expected in mid-term
Growth Initiatives & Capacity Capex
Restructuring Cash Flows
$195M Maintenance Capex $295M
$266M
$242M
>100%
$92M $95M $95M
$131M 72%
95% 118%
35%
2018 2019 2020 2021 2018 2021 Margin Interest TWC Mid-Term
2019 2020
Expansion Reduction Efficiency Target
MAJOR GROWTH INVESTMENTS IN PLACE – STRONG CASH FLOW GENERATION THROUGH THE CYCLE
1. Free Cash Flow: Net Cash Provided by Operations minus capital expenditures; Free Cash Flow Conversion shown as % of Adjusted Net Income.
Confidential information. Use and disclosure limited for Gates business purposes only. © 2022 Gates. All rights reserved.
These are non-GAAP measures, see appendix for reconciliationCAPITAL STRUCTURE AND LEVERAGE 26
DELEVERING THE BUSINESS CAPITAL DEPLOYMENT OPTIONS
▪ Adjusted EBITDA margin expansion
ORGANIC GROWTH
▪ Strong liquidity & cash generation enabling debt
▪ Continued investment in long-term growth
reduction
▪ Prioritize capital projects with high return on
▪ Net leverage approaching 2.5x
invested capital
1
NET LEVERAGE
M&A GROWTH
▪ Large, fragmented markets
▪ Add technology, product lines or regional scale
▪ Foundation in place to generate synergies
2.6x ~2.5x
~2.0x
RETURN CAPITAL TO SHAREHOLDERS
▪ Opportunistic share buybacks
2021 Short-Term Mid-Term
Target Target
REDUCED NET LEVERAGE PROVIDES ADDITIONAL BALANCE SHEET OPTIONALITY
Confidential information. Use and disclosure limited for Gates business purposes only. © 2022 Gates. All rights reserved. 1. Net leverage calculated as principal value of debt less the carrying amount of cash and cash equivalents, divided by LTM Adjusted EBITDA.INVESTMENT SUMMARY 27
▪ Large, Fragmented Markets, with Secular Tailwinds
ATTRACTIVE MARKET
▪ Electrification, Industrial Automation, Logistics, eCommerce,
OPPORTUNITY Infrastructure Build-Out, Mobility, Sustainability & Efficiency
▪ Investments in Place – Innovation Creating New Market Opportunities
WELL-POSITIONED TO ▪ Initiatives Delivering Above-Market Growth
DRIVE GROWTH ▪ M&A as a Growth Accelerator
▪ Leader with Globally Recognized Brand across Diverse End Markets
DIFFERENTIATED ▪ Highly Engineered Products with Natural Product Replacement Cycles
BUSINESS MODEL ▪ In-Region/For-Region Presence – Well-Established Global Channels
▪ Growing Top Line and Expanding Margins
ATTRACTIVE FINANCIAL ▪ Generating Strong Free Cash Flow
PROFILE ▪ Strengthened Balance Sheet Provides Optionality
Confidential information. Use and disclosure limited for Gates business purposes only. © 2022 Gates. All rights reserved.APPENDIX Confidential information. Use and disclosure limited for Gates business purposes only. © 2022 Gates. All rights reserved.
RECONCILIATIONS – CORE REVENUE GROWTH                                                                                                                                                                                    29

(USD in millions)                                                                              FY 2021
Reconciliation of Core Revenue Growth
Net sales for the year ended January 1, 2022 (1)                                         $          3,474.4
Impact on net sales of movements in currency rates                                                     (76.3)
Core revenue for the year ended January 1, 2022                                          $          3,398.1

Net sales for the year ended January 2, 2021                                                        2,793.0
Increase in net sales on a core basis (core revenue)                                     $            605.1

Core revenue growth                                                                                     21.7%

Confidential information. Use and disclosure limited for Gates business purposes only. © 2022 Gates. All rights reserved.   (1) Throughout this document the terms "net sales" and "revenue" are used interchangeably in reference to the GAAP measure "net sales."
RECONCILIATIONS – ADJUSTED EBITDA AND NET LEVERAGE                                                                                                                                                                              30

(USD in millions)                                                                                     FY 2021                   FY 2020               FY 2019               FY 2018                FY 2017
Reconciliation to Adjusted EBITDA
Net Income from Continuing Operations                                                           $            331.3          $         90.3        $        694.7        $         271.7        $        182.0
Adjusted for:
   Income tax expense (benefit)                                                                               18.4                    (19.3)               (495.9)                 31.8                  (72.5)
   Net interest and other expenses                                                                           134.4                   140.1                  148.0                 193.3                 293.4
   Depreciation and amortization                                                                             222.6                   218.6                  222.2                 218.5                 212.2
   Transaction-related expenses                                                                                 3.7                      5.2                  2.6                   6.7                   18.1
   Asset impairments                                                                                            0.6                      5.2                  0.7                   0.6                    2.8
   Restructuring expenses                                                                                       7.4                    37.3                   6.0                   6.4                   17.4
   Share-based compensation expense                                                                           24.6                     19.8                  15.0                   6.0                    5.4
   Sponsor fees (included in other operating expenses)                                                             -                     1.9                  6.5                   8.0                    6.7
   Inventory impairments and adjustments (included in cost of sales)                                            1.4                      1.4                  1.2                   1.5                    3.2
   Duplicate expenses incurred on facility relocation                                                              -                        -                    -                  5.2                       -
   Severance expenses (included in cost of sales)                                                                  -                     1.0                  4.0                   1.7                       -
   Other primarily severance expenses (included in SG&A)                                                        0.5                      8.0                  3.4                   4.4                       -
                                                                            (1)                                (9.1)                    (2.9)                 2.6                      -                   0.4
  Other items not directly related to current operations
Adjusted EBITDA                                                                                 $            735.8          $        506.6        $        611.0        $         755.8        $        669.1

Adjusted EBITDA margin
  Net Sales                                                                                     $         3,474.4           $      2,793.0        $      3,087.1        $       3,347.6        $      3,041.7
  Adjusted EBITDA                                                                               $           735.8           $        506.6        $        611.0        $         755.8        $        669.1
Adjusted EBITDA margin                                                                                      21.2%                    18.1%                 19.8%                  22.6%                 22.0%

Reconciliation to Net Leverage
  Total principal amount of debt                                                                $         2,579.2           $      2,720.8
  Less: Cash and cash equivalents                                                                          (658.2)                  (521.4)
Net debt                                                                                        $         1,921.0           $      2,199.4

Net Leverage (Net Debt divided by LTM Adjusted EBITDA)                                                         2.6 x                   4.3 x

Confidential information. Use and disclosure limited for Gates business purposes only. © 2022 Gates. All rights reserved.
                                                                                                                            (1) During the year ended January 1, 2022, other items not directly related to current operations included a $9.3 million net gain on the sale of a
                                                                                                                            purchase option on a building that we lease in Europe.
RECONCILIATIONS – ADJUSTED NET INCOME 31
(USD in millions, except share numbers and per share amounts) FY 2021 FY 2020 FY2019 FY 2018 FY 2017
Reconciliation to Adjusted Net Income
Net Income Attributable to Shareholders $ 297.1 $ 79.4 $ 690.1 $ 245.3 $ 151.3
Adjusted for:
Loss (gain) on disposal of discontinued operations - 0.3 0.6 0.6 (0.7)
Amortization of intangible assets arising from the 2014 acquisition of Gates 120.3 117.5 118.2 120.3 124.2
Transaction-related expenses 3.7 5.2 2.6 6.7 18.1
Asset impairments 0.6 5.2 0.7 0.6 2.8
Restructuring expenses 7.4 37.3 6.0 6.4 17.4
Share-based compensation expense 24.6 19.8 15.0 6.0 5.4
Sponsor fees (included in other operating expenses) - 1.9 6.5 8.0 6.7
Inventory impairments and adjustments (included in cost of sales) 1.4 1.4 1.2 1.5 3.2
Adjustments relating to post-retirement benefits (4.6) (4.5) (3.2) 3.1 2.5
Premium on redemption of long-term debt - - - 27.0 -
Financing-related FX losses (gains) 7.6 (5.3) (0.8) (8.8) 61.2
One-time deferred tax benefit from U.S. tax reform - - - - (118.2)
One-time net tax benefit - - (513.0) - -
One-time non-controlling interest adjustment - - (15.0) - -
Other adjustments (1) (18.4) (11.5) 1.6 0.8 (10.5)
Estimated tax effect of the above adjustments (31.6) (42.2) (31.2) (38.3) (53.9)
Adjusted Net Income $ 408.1 $ 204.5 $ 279.3 $ 379.2 $ 209.5
Diluted weighted average number of shares outstanding 297,294,075 292,115,964 291,627,461 291,698,273 250,490,828
Adjusted Net Income per diluted share $ 1.37 $ 0.70 $ 0.96 $ 1.30 $ 0.84
(1) During the year ended January 1, 2022, other adjustments included a $9.3 million net gain on the sale of a purchase option on a building that
we lease in Europe. During the year ended January 2, 2021, other adjustments included $17.7 million in relation to the non-controlling interest
Confidential information. Use and disclosure limited for Gates business purposes only. © 2022 Gates. All rights reserved.
share of the adjustments above, primarily restructuring expenses incurred in relation to the closure of our manufacturing facility in Korea.RECONCILIATIONS – FREE CASH FLOW AND FREE CASH 32
FLOW CONVERSION
(USD in millions) FY 2021 FY 2020 FY 2019 FY 2018 FY 2017
Reconciliation of Free Cash Flow
Net Cash Provided By Operating Activities $ 382.4 $ 309.0 $ 348.9 $ 313.5 $ 319.9
Capital Expenditures (1) (87.0) (67.4) (83.1) (182.7) (111.1)
Free Cash Flow $ 295.4 $ 241.6 $ 265.8 $ 130.8 $ 208.8
(USD in millions) FY 2021 FY 2020 FY 2019 FY 2018 FY 2017
Reconciliation of Free Cash Flow Conversion
Free Cash Flow $ 295.4 $ 241.6 $ 265.8 $ 130.8 $ 208.8
Adjusted Net Income $ 408.1 $ 204.5 $ 279.3 $ 379.2 $ 209.5
Free Cash Flow Conversion 72.4% 118.1% 95.2% 34.5% 99.7%
Confidential information. Use and disclosure limited for Gates business purposes only. © 2022 Gates. All rights reserved. (1) Capital expenditures represent purchases of property, plant and equipment and purchases of intangible assets.RECONCILIATIONS – RETURN ON INVESTED CAPITAL (ROIC) 33 (USD in millions) FY 2021 FY 2020 FY 2019 FY 2018 FY 2017 Return On Invested Capital (ROIC) LTM Adjusted EBITDA $ 735.8 $ 506.6 $ 611.0 $ 755.8 $ 669.1 LTM Total depreciation and amortization (222.6) (218.6) (222.2) (218.5) (212.2) LTM Amortization of intangible assets arising from the 2014 acquisition of Gates 120.3 117.5 118.2 120.3 124.2 LTM Adjusted EBIT 633.5 405.5 507.0 657.6 581.1 Notional tax at 25% (158.4) (101.4) (126.8) (164.4) (145.3) LTM Tax-effected Adjusted EBIT $ 475.1 $ 304.1 $ 380.2 $ 493.2 $ 435.8 Total Assets $ 7,533.0 $ 7,426.3 $ 7,411.3 $ 6,722.6 $ 6,853.7 Adjusted for: Cash (658.2) (521.4) (635.3) (423.4) (564.4) Taxes receivable (34.8) (55.1) (45.1) (35.1) (46.8) Deferred tax assets (639.4) (672.6) (587.1) (5.1) (5.8) Prepaid taxes (13.4) (4.7) (21.2) (18.3) (17.5) Accounts payable (506.6) (417.4) (374.7) (424.0) (392.0) Intangibles arising from the acquisition of Gates (3,557.7) (3,755.7) (3,788.8) (3,890.4) (4,114.5) Invested Capital $ 2,122.9 $ 1,999.4 $ 1,959.1 $ 1,926.3 $ 1,712.7 Return On Invested Capital 22.4% 15.2% 19.4% 25.6% 25.4% Confidential information. Use and disclosure limited for Gates business purposes only. © 2022 Gates. All rights reserved.
You can also read