KITCHENER-WATERLOO-CAMBRIDGE-GUELPH REGION INTEGRATED REGIONAL RESOURCE PLAN - APPENDICES - April 28, 2015 - Hydro One
←
→
Page content transcription
If your browser does not render page correctly, please read the page content below
KITCHENER-WATERLOO-
CAMBRIDGE-GUELPH REGION
INTEGRATED REGIONAL
RESOURCE PLAN - APPENDICES
April 28, 2015
Kitchener-Waterloo-Cambridge-Guelph IRRP

Appendix A: Demand Forecasting – Methodology and
Assumptions
Appendix A: Demand Forecasting – Methodology and
                  Assumptions

A.1        Gross Demand Forecast
Table A-1 shows the gross demand forecast developed based on information provided by the
LDCs in the KWCG Region. The gross demand forecast reflects the regional coincident peak
demand under weather-normal conditions and is developed based on customer connection
requests and the growth projections in regional and municipal plans. Appendices A.1.1
through A.1.5 describe the LDCs’ gross demand forecasting methodologies and assumptions.
The gross demand also includes expected peak demand consumption from three transmission-
connected customers in the KWCG Region (5 MW in Cambridge/North Dumfries and 7 MW in
Guelph).

                                                                   Appendix A - Page 1 of 21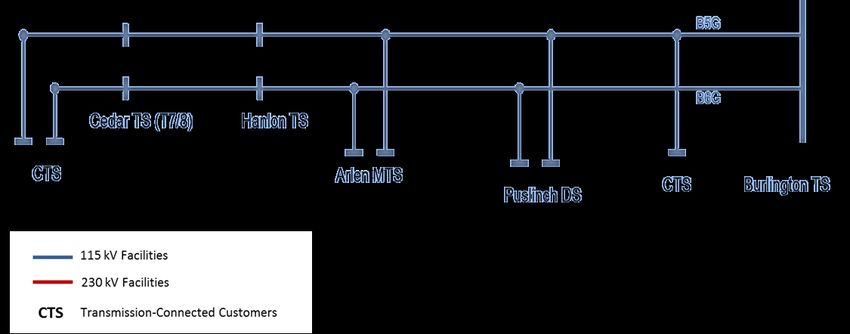
Table A-1: Gross Demand Forecast 2014-2033 – KWCG Region

                                                                 Gross Demand Forecast (MW)

         Municipalities            2014 2015 2016 2017 2018 2019 2020 2021 2022 2023 2024 2025 2026 2027 2028 2029 2030 2031 2032 2033

       Guelph & Rockwood           284   296   310   319   329   338   350   360   371   382   394   405   418   429   444   457   471   471   471   471

 Waterloo, Wellesley, & Woolwich   300   310   321   331   347   363   370   380   388   399   408   419   433   445   456   468   478   490   502   514

   Cambridge & North Dumfries      294   306   312   319   327   337   349   356   366   376   387   396   407   417   430   440   453   465   478   488

       Kitchener & Wilmot          402   408   415   426   433   439   446   453   460   467   474   480   487   494   501   508   515   523   530   538

       Wellington County &
       Blandford-Blenheim          166   168   170   172   173   175   177   179   181   183   185   187   190   193   196   198   201   201   203   206
         (Oxford County)
             Total                 1445 1488 1528 1566 1609 1653 1693 1728 1766 1807 1848 1888 1936 1978 2027 2071 2118 2150 2185 2217

                                                                                                                  Appendix A - Page 2 of 21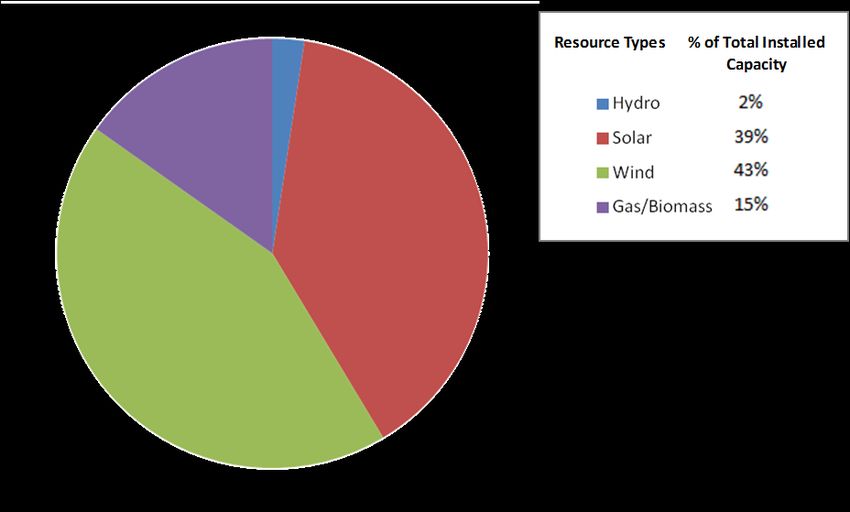
A.1.1      Cambridge and North Dumfries Hydro: Gross Forecast Methodology
           and Assumptions

Cambridge and North Dumfries Hydro Inc. (“Cambridge and North Dumfries Hydro”)
provides service to the City of Cambridge and the Township of North Dumfries along with a
number of customers along its boundary in the County of Brant, the Township of Blanford-
Blenheim and the City of Hamilton. Cambridge and North Dumfries Hydro has recently
acquired Brant County Power (“BCP”). Brant County Power’s distribution system is electrically
separate from Cambridge North Dumfries Hydro’s distribution system so BCP information is
not included as part of this study area.

Cambridge and North Dumfries Hydro distributes electricity to approximately
53,000 customers, of which 89% are residential, 10.4% are commercial, and 0.05% are industrial.
The remaining customers are embedded LDC’s, generators, street lighting and unmetered
scattered load.

Cambridge North Dumfries Hydro’s service area covers 306 square kilometres. Cambridge and
North Dumfries Hydro receives power from Hydro One Networks and delivers power to its
customers via four high voltage transformer stations, one of which is owned by Cambridge and
North Dumfries Hydro and the others are owned by Hydro One. Cambridge North Dumfries
Hydro’s principal primary distribution voltage is 27.6 kV.

Factors that Affect Electricity Demand

The City of Cambridge and the Township of North Dumfries are located in the Region of
Waterloo. The Region of Waterloo is included in the Province of Ontario’s Places to Grow Act,
2005. Using the Region of Waterloo published population numbers, the City of Cambridge is
expected to grow from its 2013 year-end population of 132,700 to 173,000 by 2029. The
Township of North Dumfries is expected to grow from its current population of 9,640 to 16,000
by 2029.

The Cambridge area is experiencing increased density in the form of high rise
apartment/condominium residential buildings and re-use of decommissioned industrial land
for new residential development in built-up areas.

Much of the current residential growth is coming from the South East Galt area bounded by
Franklin Boulevard, Main Street, Dundas Street and the east limit of the city boundary.
Residential growth is also coming from multiple residential sites throughout the city.

                                                                      Appendix A - Page 3 of 21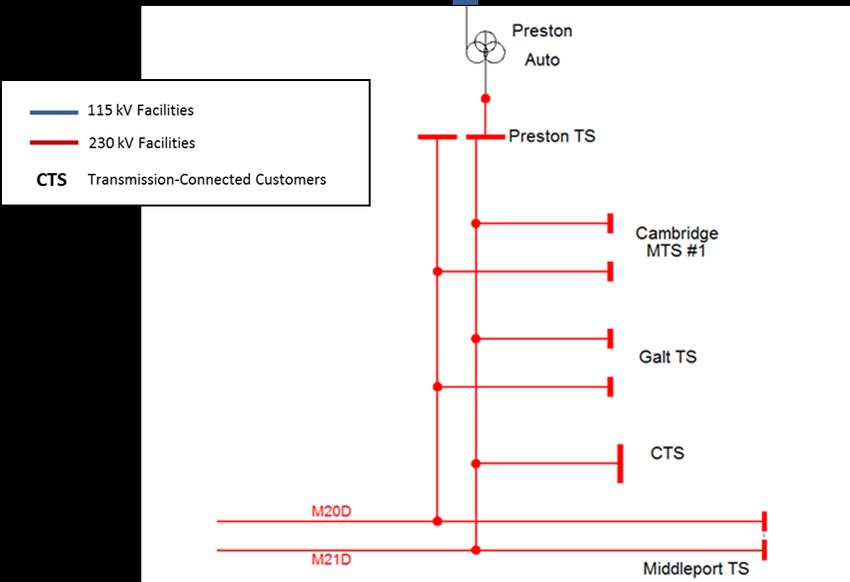
Significant future residential growth is expected to come from planned subdivisions located on
the east side of Speedsville Road North of Highway 401. The level of residential building
permit activity in recent years has been low as compared to historical norms. The activity level
began to recover in 2014 and additional recovery is expected as the local economy improves and
as new housing developments become available.

The City of Cambridge’s current report of “Industrial Sites and Buildings” states the following:

   “Cambridge is an “Industrial City” with a history rich in industrial development dating
   back to the 1800’s. Planned industrial building lots were marketed as early as the mid
   1800’s and established the cornerstone for the momentum in industrial development
   that exists today. Cambridge now has 4,315 acres of land zoned for industrial use.”

There were 110 acres of new, serviced industrial land developed by the City of Cambridge in
the “Boxwood Industrial Subdivision” which came onto the market in late 2013, and 741 net
acres of industrial land are planned for the “East Side Lands” located partly in Cambridge and
partly in the Township of Woolwich. The first development of these lands is scheduled to begin
in 2015.

Conservation programs continue to have a positive effect by reducing peak demand.
Cambridge and North Dumfries Hydro was the first electric utility in Ontario to offer a
$200 incentive towards a “Nest Learning Thermostat” TM if a customer signed up for the Nest
Rush Hour Rewards program. The ongoing microFit/FIT programs add new renewable
generation each year which reduces peak demand. The FIT generation reduced Cambridge
North Dumfries Hydro’s annual peak demand by 2.6 MW in 2014.

Cogeneration projects will reduce the demand for electricity. One large cogeneration project is
underway in Cambridge North Dumfries Hydro’s service area.

The level of Gross Domestic Product (“GDP”) growth is a significant driver of peak demand.
The GDP growth has been relatively low in recent years. Cambridge and North Dumfries
Hydro also lost significant industrial load as a result of the 2008/2009 recession. As well, local
export industries faced challenges with the relatively high value of the Canadian dollar.
Greater economic growth and the lower Canadian dollar should boost local industrial activity
and result in increased electrical demand.

                                                                         Appendix A - Page 4 of 21
Summer temperatures and humidity levels are a significant driver for peak demand.
Cambridge North Dumfries Hydro’s peak load can rise 50% on a hot summer day versus a day
in the spring or summer with average temperatures. Air conditioning has a large impact.
Looking forward, greater adoption of electric vehicles could have a substantial impact on local
electricity demand.
Forecast Methodology and Assumptions
The load forecast supplied by Cambridge and North Dumfries Hydro covers the electrical loads
in the City of Cambridge and the Township of North Dumfries excluding one large industrial
load that is directly connected to the 230 kV transmission system.
In 2012, Cambridge and North Dumfries Hydro developed the reference level forecast growth
rate by looking at historical actual system peak load data for each year going back to 1978, then
averaging the annual percentage change in summer peak load. The long-term annual
percentage change was approximately 3%. However, Cambridge North Dumfries Hydro’s
long-term average summer peak growth rate going back to 1978 is now at 2.4%, and the trend
has been down. As a result, Cambridge and North Dumfries Hydro has lowered its expected
long-term growth rate going forward from 3% to 2%. Cambridge and North Dumfries Hydro
expects growth to return, since the Cambridge area is designated in the provincial Places to
Grow Act and there is available industrial and residential land for development.
The forecast could change significantly. It is important to be in a position to respond quickly, if
needed, to accommodate the significant growth that could occur. The basic elements are in
place. At the same time, it is important not to invest prematurely in facilities that could be
underutilized. The plan going forward must be flexible.
A.1.2 Guelph Hydro: Gross Forecast Methodology and Assumptions
Guelph Hydro Electric Systems Inc. (“Guelph Hydro”) owns and operates the electricity
distribution system in its licensed service area in the City of Guelph and the Village of
Rockwood serving approximately 52,000 customers. Guelph Hydro’s customer base is
represented by a mixture of residential customers (91% by customer count, 22% by load) and
Commercial/Industrial /Institutional customers (9% by customer count and 78% by load).
Guelph Hydro services five Large Use rate customers represented by a university and
industrial/manufacturing facilities.
Appendix A - Page 5 of 21Guelph Hydro is supplied through the Hydro One transmission system at primary voltages of
115 kV and 230 kV within the City of Guelph. Electricity is then distributed through Guelph
Hydro’s service territory by three Hydro One owned transformer stations, Campbell TS, Cedar
TS and Hanlon TS and the Guelph Hydro owned Arlen Municipal Transformer Station
(“MTS”). The Guelph Hydro distribution system in the City of Guelph is serviced at 13.8 kV.
The Village of Rockwood is supplied through the Hydro One distribution system at a primary
voltage of 44 kV. Electricity is then distributed through the Village of Rockwood by two
Guelph Hydro owned MTSs, and one Hydro One distribution station. Guelph Hydro’s
distribution system in the Village of Rockwood is serviced at 8.32 kV.
Factors that Affect Electricity Demand
The major variables affecting electricity demand within Guelph Hydro’s service territory in the
City of Guelph are related to population growth rate associated with the provincial places to
grow targets as well as economic development within both the current
industrial/manufacturing rate class sector and future development and use of industrial parks.
The rate and level of future demand increases are highly dependent on the each one of these
factors.
The City of Guelph has been designated as one of 25 municipalities listed in the Growth Plan as
an Urban Growth Centre. The city is directed to increase its population to 175,000, which is an
increase of over 50,000 people.
Another significant factor in the demand of electricity is linked to economic development
within both our current and future customer base. A significant portion of the electricity
demand within Guelph Hydro’s service territory is associated with the manufacturing sector.
Economic development as it relates to future utilization of industrial park land represents a
large portion of future increase to electricity demand within the city. The most significant
development is the Hanlon Creek Business Park located in the south end of Guelph Hydro’s
service territory and represents a total land mass of over 370 acres. Approximately 8% of the
land within the business park has been consumed to date and reflective in the current electricity
demand with the remaining accounted for in the forecast.
Conservation and DG efforts have made an impact to the average system growth rate within the
Guelph service territory since being initiated in 2002 with a net reduction of approximately
1.25% towards the overall average growth rate between 2004 and 2013.
Appendix A - Page 6 of 21Forecast Methodology and Assumptions
Guelph Hydro’s methodology for developing the base load forecast consisted of a number of
elements including historical loading trends, local knowledge of planned development and City
of Guelph development planning information. Planning information from the City of Guelph
was the starting point to formulate a maximum development forecast in order to set the
parameters of the long-range load forecast for its service territory given the study period. Using
this information along with 30+years of historic peak loading information, local knowledge and
information regarding transformer stations service areas within Guelph Hydro’s service
territory, the load forecast was created for each delivery point location.
A.1.3 Kitchener-Wilmot Hydro: Gross Forecast Methodology and
Assumptions
Kitchener-Wilmot Hydro owns and operates the electricity distribution system in its licensed
service area in the City of Kitchener and the Township of Wilmot, serving approximately
91,500 Residential, General Service, Large Use, Street Light, Unmetered Scattered Load and
Embedded Distributor rate customers.
Kitchener-Wilmot Hydro is supplied through the Hydro One transmission system at primary
voltages of 115 kV and 230 kV. Electricity is then distributed through Kitchener-Wilmot
Hydro’s service area (411 square kilometers) by eight MTSs (27.6 kV and 13.8 kV) and seven
municipal distribution stations (8.32 kV).
Factors that Affect Electricity Demand
There are multiple factors affecting electricity demand within the Kitchener-Wilmot Hydro
service area.
The first factor driving electricity demand is population growth. In response to the Ontario’s
Place to Grow plan, the Region of Waterloo has published its Official Plan with forecast
population growth. In Kitchener-Wilmot Hydro’s service area, it is estimated that the
population will increase from 232,200 in 2006 to 341,500 in 2029, and the employment will
increase from 106,100 in 2006 to 139,700 in 2029. The growth in population and employment
will drive the electricity demand for the next 20 years.
The second factor impacting the electricity demand is the change in the industrial sector. The
City of Kitchener is experiencing a conversion from being a manufacturing-oriented economy to
Appendix A - Page 7 of 21a more diversified and balanced economy. Kitchener-Wilmot Hydro has lost its top three load
customers in the past 10 years. In the meantime, more customers with smaller demand emerge
in the industrial and commercial sectors.
The third factor impacting electricity demand growth is the Region of Waterloo’s Regional
Official Plan. To support the provincial policy in the Places to Grow Act, as well as the city’s
efforts to intensify the Kitchener downtown area, the Region of Waterloo is installing a light rail
transit (“LRT”) system that will ultimately connect the three local cities: Waterloo, Kitchener,
and Cambridge. The electrical load required to drive the trains within the Kitchener-Wilmot
Hydro’s service territory is expected to be in excess of 3.5 MW (or approximately 1% of the
system peak) and come on line in 2017. The installation of the LRT is further expected to spur
development along the train route in both the residential and commercial sectors.
The fourth factor impacting the electricity demand is the rising awareness of renewable energy
generation development and CDM. Ontario’s Green Energy Act, 2009 established a new
framework for electricity in the province. As directed by the OEB, Kitchener-Wilmot Hydro is
currently participating in multiple provincial renewable energy programs and CDM programs,
which help control and reduce the electricity demand. Time-of-Use (“TOU”) is also shifting
demand and conserving energy as the customers manage their electricity use and control their
hydro costs.
Forecast Methodology and Assumptions
In developing the reference forecast, Kitchener-Wilmot Hydro uses trend analysis (trending) to
extend past growth rates of electricity demand into the future. A linear-trend method that uses
the historical data of demand growth to forecast future growth has been applied. The
coincident peak data (July 7th, 2010 at hour 16) has been used as the base for load forecast. A
long-term 6.86 MW annual gross demand growth from 2011 to 2030 has been projected, with
60% of the annual load growth (4.12 MW) attributable to residential customers, and 40%
(2.74 MW) attributable to commercial and industrial customers. The annual demand growth
has been allocated to each transformer station based on the municipal development plan,
available vacant lands and other local knowledge.
This annual demand growth rate covers both load additions of new customers and load
maturation of the existing customers. The projected long-term annual demand growth is
derived from the average load growth for the observed summer peaks from 1993 to 2006. The
more recent data of 2007-2013 were biased and ignored due to multiple factors, like loss of the
Appendix A - Page 8 of 21largest load customers, conservation and DG, TOU pricing, and the economic downturn after
the credit crisis.
In order to reflect some one-time new large load additions that are not covered by the historical
trend (e.g., the Kitchener Waste Water Treatment Plant expansion, and the proposed regional
LRT stations), additional loads (6.5 MW in total between 2011-2017) have been added to the
near-term forecast on top of the long-term annual demand growth rate.
A.1.4 Waterloo North Hydro: Gross Forecast Methodology and
Assumptions
Waterloo North Hydro Inc. (“Waterloo North Hydro”) owns and operates the electricity
distribution system in its licensed service area in the City of Waterloo and the Townships of
Woolwich and Wellesley, serving approximately 55,000 customers. Waterloo North Hydro’s
customer base is comprised of primarily residential (89% by customer count) and
commercial/institutional loads (10% by customer count). Waterloo North Hydro’s largest loads
include universities, high-tech companies and financial institutions. A small component of the
Waterloo North Hydro load base comes from the industrial/manufacturing sector (1% by
customer count).
Waterloo North Hydro is supplied through the Hydro One transmission system at primary
voltages of 115 kV and 230 kV. Electricity is then distributed through Waterloo North Hydro’s
service area by three MTSs and 13 municipal distribution stations. Waterloo North Hydro’s
distribution system is divided into the 13.8 kV system servicing the core of the City of Waterloo,
and the 27.6 kV system servicing the outskirts of the City of Waterloo as well as the township
areas. Waterloo North Hydro also has some 8.32 kV distribution throughout its rural service
territory and a small amount of 4.16 kV distribution in the core of the City of Waterloo and in
the Town of Elmira.
Factors that Affect Electricity Demand
There are two major factors affecting electricity demand within Waterloo North Hydro’s service
territory and both are municipally driven; one by the City of Waterloo, and one by the Region of
Waterloo.
As a result of recessions in the late 1980’s and early 1990’s, the City of Waterloo formulated a
strategic plan to capitalize on the two very reputable local universities (University of Waterloo
and Wilfrid Laurier University) and create conditions for students who attend the local
Appendix A - Page 9 of 21universities to start new business and remain in this area. The City of Waterloo became a leader
in fostering high-tech industry start-ups and full businesses, with Blackberry being an example
of its global business successes as a direct result. Demand in the housing market was very
strong resulting in the City of Waterloo developing to the limits of its boundaries and running
out of greenfield developable land. This resulted in the city setting a new strategy of
brownfield re-development, which started a few years ago and continues to grow. Most of the
brownfield re-development is in the area abutting the two local universities as well as the
uptown core of the City of Waterloo. In most cases, the re-development consists of the
demolition of a few single dwelling residential units being replaced with multi-unit residential
complexes. It is very common to see the footprint of four houses being developed into high rise
apartments with 100 dwelling units.
The second driving factor for electricity demand growth in Waterloo North Hydro’s service
territory is the Region of Waterloo’s strategy in support the provincial Places to Grow policy.
The Region of Waterloo has limited urban sprawl by setting hard boundaries for greenfield
development to coincide with existing city limits. To support the provincial policy as well as
the city’s efforts to intensify the uptown and university neighbourhoods, the Region of
Waterloo is installing an LRT system that will ultimately connect the three local cities: Waterloo,
Kitchener, and Cambridge. The electrical load required to drive the trains is substantial, and
within the Waterloo North Hydro service territory alone is expected to be in excess of 6 MW (or
approximately 2% of the system peak). A portion of the LRT load in Waterloo will come on line
in 2016 for initial train testing with the balance of this load arriving in 2017 when the full LRT
system goes into service.
The regional plan also sets new areas of greenfield development, labeled as East Side Lands, to
be just outside of Kitchener along Highway 7 leading toward Guelph, and extending south into
Cambridge and North Dumfries Hydro’s service territory all the way to Highway 401. The
planned land uses involve residential, commercial, and industrial sectors and is located along a
railway route identified by MetroLinx as their next major growth potential location. Electrical
demand in this area is expected to be at higher densities due to the industrial component of
land use as well as high-tech data centre applications of the commercial space.
Over the last couple of years, Waterloo North Hydro has also observed the peak demand
impact by the development of DG and conservation efforts.
Appendix A - Page 10 of 21Forecast Methodology and Assumptions
In developing the load forecasts, Waterloo North Hydro gathers development projection data
from the local municipalities and developers to determine areas and timing of planned
development as well as land uses. This information is then converted to electrical demand
quantities and analyzed against past trends. A forecast is developed for each TS that is
consistent with load growth potential within the service area of that station and overall system
growth. Waterloo North Hydro uses geometric growth trend methodology (trending) to extend
past growth rates of electricity demand into the future.
The coincident peak data (July 7th, 2010 at hour 16) has been used as the base for the load
forecast. The gross load forecast has been prepared such that by the end of the study period in
2033, the geometric growth rate is consistent with past trends and long-term development
potential. Year-to-year load projections were adjusted in terms of timing and location (station)
based on knowledge with respect to local development conditions. This resulted in an overall
geometric system growth rate of 3.3% up to year 2018 and 2.5% thereafter. This represents an
addition of, on average, 10.3 MW of load per year over the study period.
A.1.5 Hydro One Distribution: Gross Forecast Methodology and
Assumptions
Hydro One Distribution provides service to counties and townships surrounding the Region of
Waterloo and Guelph area (Wellington County, and Oxford County - Blandford-Blenheim
Township). Three step-down stations supply the area from the transmission system as follows:
• 230/44 kV Fergus TS supplied by 230 kV circuits D6V and D7V
• 115/27.6 kV Puslinch DS supplied by 115 kV circuits B5G and B6G
• 115/27.6 kV Wolverton DS supplied by 115 kV circuit D7F
There are about 14,000 Hydro One Distribution retail customers directly connected to Hydro
One’s distribution system. There are embedded LDCs connected to Hydro One’s distribution
system.
Factors that Affect Electricity Demand
Hydro One Distribution serves mostly the rural areas outside the major cities such as Kitchener,
Waterloo, Guelph and Cambridge. The demand growth in the Hydro One distribution service
area is largely driven by the economic activities in these large communities and is expected to
be modest as the population moves from the urban centers to the rural areas.
Appendix A - Page 11 of 21Some of the smaller communities such as Elora, Fergus and Rockwood are in the embedded
LDCs to Hydro One Distribution. The load growth in these communities is therefore factored
in the Hydro One Distribution load forecast.
Forecast Methodology and Assumptions
The reference level forecast is developed using macro-economic analysis, which takes into
account the growth of demographic and economic factors. The forecast corresponds to the
expected weather impact on peak load under average weather conditions, known as weather-
normality. Furthermore, the forecast is unbiased such that there is an equal chance of the actual
peak load being above or below the forecast. In addition, local knowledge, information
regarding the loading in the area within the next two to three years, is utilized to make minor
adjustments to the forecast.
Hydro One Distribution conducts distribution area studies to examine the adequacy of the
existing local supply network in the next 10 to 15 years and determine when new stations need
to be built. These studies are performed on a needs basis, such as:
• Load approaching the planned capacity
• Issues identified by the field and customer
• Issues discovered during our 6-year cycle studies
• Additional supply required for large-step load connections
• Poor asset condition
A.2 Estimated Peak Demand Savings from Provincial Energy
Conservation Targets
Table A-2 shows the estimated peak demand savings from provincial conservation energy
targets in the KWCG Region. These estimates were developed using the methodology
described in Appendix A.2.1 below, and were considered in the development of near- and
medium-term planning forecast and the high-growth long-term demand scenario. Estimated
peak demand savings from provincial energy conservation targets were not applied to the low-
growth scenario since the scenario already accounts for the anticipated impact of the 2032
conservation targets in its overall growth rate assumptions.
Appendix A - Page 12 of 21Table A-2: Estimated Peak Demand Savings from Provincial Energy Targets in the KWCG Region - 2014-2033
Estimated Peak Demand Savings from Provinicial Energy Conservation Target (MW)
Municipalities 2014 2015 2016 2017 2018 2019 2020 2021 2022 2023 2024 2025 2026 2027 2028 2029 2030 2031 2032 2033
Guelph & Rockwood 5 6 8 10 12 17 20 24 27 30 35 38 42 46 52 55 60 64 67 67
Waterloo, Wellesley, & Woolwich 5 7 9 10 13 18 22 26 29 32 37 40 44 49 54 58 62 67 73 74
Cambridge & North Dumfries 5 7 9 10 12 17 20 24 27 30 35 37 41 45 50 54 58 63 68 70
Kitchener & Wilmot 7 9 12 13 16 22 26 31 34 37 43 46 50 54 59 63 67 72 77 78
Wellington County &
Blandford-Blenheim 3 4 5 5 6 9 10 12 13 15 17 18 19 21 23 24 26 28 29 30
(Oxford County)
Total 24 33 42 47 58 82 99 116 129 144 166 179 196 215 239 254 273 294 314 319
Appendix A - Page 13 of 21A.2.1 Methodology to Estimate Peak Demand Savings from Provincial
Energy Targets
The estimated peak demand savings assumptions considered in the planning forecast were
derived from the provincial conservation forecast, which aligns with the conservation targets
described in the 2013 LTEP: “Achieving Balance: Ontario’s Long-Term Energy Plan”. The LTEP
set an electrical energy conservation target of 30 TWh in 2032, with about 10 TWh of the energy
savings coming from codes and standards (“C&S”), and the remaining 20 TWh from energy
efficiency (EE) programs. The 30 TWh energy savings target will also lead to associated peak
demand savings. It is important to note that the TOU rates and demand response (DR)
resources focus on peak demand reduction rather than energy savings and, as such, are not
reflected in the 30 TWh energy target. Therefore the savings from potential DR resources and
TOU are not included in the forecast and are instead considered possible solutions to identified
needs.
To assess the peak demand savings from the provincial conservation targets, two provincial
demand forecasts are developed. A gross demand forecast is produced that represents the
anticipated electricity needs of the province based on growth projections, for each hour of the
year. This forecast is based on a model that calculates future gross annual energy consumption
by sector and end use. Hourly load shape profiles are applied to develop province-wide gross
hourly demand forecasts. Natural conservation impacts are included in the provincial gross
demand forecast, however the effects of the planned conservation are not included. A net
hourly demand forecast is also produced, reflecting the electricity demand reduction impacts of
C&S, EE programs, and TOU. The gross and net forecasts were then compared in each year to
derive the peak demand savings. In other words, the difference between the gross and net peak
demand forecasts is equal to the demand impacts of conservation at the provincial level.
The above methodology was used to derive the combined peak demand savings from three
categories: (1) TOU rates, (2) C&S and (3) EE programs. Peak demand savings associated with
load shifting in response to TOU rates were estimated using an econometric model based on
customers’ elasticity of substitution and the TOU price ratio. The remaining peak savings were
allocated between C&S and EE programs based on their energy saving projections, with about
1/3 attributed to C&S and 2/3 to EE programs.
The resulting peak demand savings in each year are represented as a percentage of total
provincial peak demand shown in Table A-3, using 2013 as a base year.
Appendix A - Page 14 of 21Table A-3: Estimated Peak Demand Savings from Provincial Energy Conservation Targets
(percent of gross load)
2013 2014 2015 2016 2017 2018 2019 2020 2021 2022 2023 2024 2025 2026 2027 2028 2029 2030 2031 2032 2033
C&S 0.1% 0.2% 0.3% 0.7% 0.8% 1.2% 1.7% 2.1% 2.5% 2.7% 2.7% 2.9% 3.1% 3.3% 3.8% 4.2% 4.5% 4.9% 5.2% 5.5% 5.5%
TOU 0.2% 0.4% 0.5% 0.6% 0.6% 0.6% 0.6% 0.6% 0.6% 0.6% 0.6% 0.6% 0.6% 0.6% 0.6% 0.6% 0.6% 0.6% 0.6% 0.6% 0.6%
EE programs 0.6% 1.1% 1.4% 1.5% 1.7% 1.8% 2.7% 3.6% 3.7% 4.1% 4.7% 5.5% 5.9% 6.3% 6.6% 7.0% 7.2% 7.4% 7.9% 8.3% 8.3%
Total 0.9% 1.7% 2.2% 2.8% 3.1% 3.6% 5.0% 6.3% 6.8% 7.4% 8.0% 9.0% 9.5% 10.2% 10.9% 11.9% 12.3% 13.0% 13.7% 14.4% 14.4%
These percentages were applied to the gross demand forecasts at the TS level to determine the
peak demand savings assumed in the planning forecast. This allocation methodology relies on
the assumption that the peak demand savings from provincial conservation will be realized
uniformly across the province. Actions recommended in the KWCG IRRP to monitor actual
demand savings, and to assess conservation potential in the Region, will assist in developing
region-specific conservation assumptions going forward.
A.3 Expected Peak Demand Contribution of Contracted Distributed
Generation
The installed capacity of contracted DG is adjusted to reflect the expected power output at the
time of local area peak, based on resource-specific peak capacity contribution value (solar,
biomass/gas, wind, and hydro generation) obtained from IESO’s 2014 “Methodology to Perform
Long Term Assessments” (see Appendix A.3.2). Table A-4 shows the estimated peak demand
contribution of contracted DG in the KWCG Region, as of December 2014. These estimates
were considered in the development of near- and medium-term planning forecast and long-
term demand scenarios, and considers the higher-growth forecast in the Places to Grow growth
plan, and a lower-growth forecast of the 2013 LTEP. The total installed capacity of contracted
DG in the KWCG Region can be found in Appendix A.3.1. Future DG uptake was not included
due to difficulties forecasting uptake and the potential to consider this as an option for meeting
identified needs.
Appendix A - Page 15 of 21Table A-4: Expected Peak Demand Contribution of Contracted Distributed Generation1
Expected Peak Demand Contribution of Contracted Distributed Generation (MW)
Municipalities 2014 2015 2016 2017 2018 2019 2020 2021 2022 2023 2024 2025 2026 2027 2028 2029 2030 2031 2032 2033
Guelph & Rockwood 5 5 5 5 5 15 15 15 15 15 15 15 15 15 15 15 15 15 15 15
Waterloo, Wellesley, & Woolwich 4 5 5 5 5 5 5 5 5 5 5 5 5 5 5 5 5 5 5 5
Cambridge & North Dumfries 2 4 4 4 4 4 4 4 4 4 4 4 4 4 4 4 4 4 4 4
Kitchener & Wilmot 2 2 2 2 2 2 2 2 2 2 2 2 2 2 2 2 2 2 2 2
Wellington County &
Blandford-Blenheim 6 8 8 8 8 9 9 9 9 9 9 9 9 9 9 9 9 9 9 9
(Oxford County)
Total 20 24 25 25 25 35 35 35 35 35 35 35 35 35 35 35 35 35 35 35
1Distributed generation that came into commercial operation prior to 2010 was not explicitly considered in the development of planning forecast. The expected
peak demand contribution of this DG (in-service prior 2010) was accounted for in the gross demand forecast assumptions.
Appendix A - Page 16 of 21A.3.1 Installed Capacity of Contracted Distributed Generation in the KWCG Region
Table A-5 shows the installed capacity of contracted DG in the KWCG Region, which was active as of December 2014.
Table A-5: Installed Peak Demand Contribution of Contracted Distributed Generation 2
Installed Capacity of Contracted Distributed Generation (MW)
Municipalities 2014 2015 2016 2017 2018 2019 2020 2021 2022 2023 2024 2025 2026 2027 2028 2029 2030 2031 2032 2033
Guelph & Rockwood 11 11 11 11 11 21 21 21 21 21 21 21 21 21 21 21 21 21 21 21
Waterloo, Wellesley, & Woolwich 7 9 9 9 9 9 9 9 9 9 9 9 9 9 9 9 9 9 9 9
Cambridge & North Dumfries 6 11 11 11 11 11 11 11 11 11 11 11 11 11 11 11 11 11 11 11
Kitchener & Wilmot 6 8 8 8 8 8 8 8 8 8 8 8 8 8 8 8 8 8 8 8
Wellington County &
Blandford-Blenheim 37 46 47 47 47 48 48 48 48 48 48 48 48 48 48 48 48 48 48 48
(Oxford County)
Total 67 85 86 86 86 98 98 98 98 98 98 98 98 98 98 98 98 98 98 98
2Distributed generation that came into commercial operation prior to 2010 was not explicitly considered in the development of planning forecast. The expected
peak demand contribution of DG that came in-service prior 2010 was accounted for in the gross demand forecast assumptions.
Appendix A - Page 17 of 21Figure A-1 below shows the breakdown the installed capacity of contracted DG in the KWCG
Region by resource type.
Installed capacity of contracted DG in the KWCG Region by resource type.
Figure A-1: Installed Capacity of Contracted Distributed Generation in the KWCG Region
by Resource Type
A.3.2 Peak Capacity Contribution Assumptions
The peak capacity contribution of wind, solar, biomass, wind, and hydro generation obtained
from the IESO’s 2014 “Methodology to Perform Long Term Assessments” 3 is shown in
Table A-6 below. The peak capacity contribution values are applied to installed capacity to
reflect the expected power output from DG at the time of local area peak.
3 http://www.ieso.ca/Documents/marketReports/Methodology_RTAA_2014feb.pdf
Appendix A - Page 18 of 21Table A-6: Peak Capacity Contribution Assumptions
Peak Capacity Contribution
Resource Type
(% of installed capacity)
Biomass/Gas 98%
Hydro 71%
Solar 30%
Wind 14%
A.4 Planning Demand Forecast and Scenarios
A.4.1 Near- and Medium-Term Planning Forecast 2014-2023
Table A-7: Near- and Medium-Term Planning Forecast 2014-2023 – KWCG Region
Near-and Medium-Term Planning Forecast (MW)
Municipalities 2014 2015 2016 2017 2018 2019 2020 2021 2022 2023
Guelph & Rockwood 291 301 314 322 331 325 334 341 349 357
Waterloo, Wellesley, & Woolwich 308 316 326 335 349 361 364 371 376 384
Cambridge & North Dumfries 304 313 318 324 330 336 345 348 356 363
Kitchener & Wilmot 417 421 425 435 439 440 443 445 449 453
Wellington County &
Blandford-Blenheim 166 166 166 168 169 168 168 168 169 170
(Oxford County)
Total 1486 1517 1549 1584 1619 1629 1653 1673 1699 1727
Appendix A - Page 19 of 21A.4.2 Long-Term Planning Forecast Scenarios
High-Growth Scenario
The high-growth scenario is developed based on gross demand forecast by LDCs within their
service territories. It was then adjusted by the IESO to account for the anticipated peak demand
impacts of provincial conservation energy targets, the effect of contracted DG, and the effect of
extreme summer temperature conditions. The underlying growth projection of the higher-
growth forecast is provided by LDCs relying on their own local growth plans, which were
heavily influenced by Places to Grow Growth Plan for the Greater Golden Horseshoe (2013
consolidation). 4 This scenario is an extension of the near- and medium-term forecast and
assumes use 2023 peak demand value as a starting point.
Table A-8: High-Growth Scenario Planning Forecast 2023-2033 – KWCG Region
High-Growth Scenario Planning Forecast 2024-2033 (MW)
Municipalities 2024 2025 2026 2027 2028 2029 2030 2031 2032 2033
Guelph & Rockwood 365 373 383 390 400 410 420 416 413 413
Waterloo, Wellesley, & Woolwich 388 397 407 415 421 430 436 443 450 461
Cambridge & North Dumfries 370 376 384 390 399 406 415 422 430 440
Kitchener & Wilmot 454 458 462 464 466 470 473 475 479 486
Wellington County &
Blandford-Blenheim 170 171 172 173 174 175 177 175 175 177
(Oxford County)
Total 1747 1775 1808 1833 1859 1891 1920 1932 1947 1976
4 https://www.placestogrow.ca/index.php?option=com_content&task=view&id=359&Itemid=12
Appendix A - Page 20 of 21Low-Growth Scenario
The low-growth scenario assumes that KWCG Region grows at annual rate of 0.2 % beyond
2023. This assumption aligns with growth rate forecast for the IESO southwest zone in the 2013
LTEP and assumes significant peak demand savings from future conservation efforts and peak
demand contribution of DG. This scenario is an extension of the near- and medium-term
forecast and assumes 2023 peak demand value as a starting point.
Table A-9: Low-Growth Scenario Planning Forecast 2023-2033 – KWCG Region
Low-Growth Scenario Planning Forecast 2024-2033 (MW)
Regional Subsystems 2024 2025 2026 2027 2028 2029 2030 2031 2032 2033
Guelph & Rockwood 358 359 360 361 361 362 363 364 365 365
Waterloo, Wellesley, & Woolwich 385 386 387 388 388 389 390 391 392 393
Cambridge & North Dumfries 364 365 366 367 367 368 369 370 371 372
Kitchener & Wilmot 454 455 456 457 458 459 460 461 462 463
Wellington County &
Blandford-Blenheim 170 170 171 171 172 172 172 173 173 174
(Oxford County)
Total 1731 1735 1739 1743 1747 1751 1755 1759 1763 1767
Appendix A - Page 21 of 21Kitchener-Waterloo-Cambridge-Guelph IRRP Appendix B: Needs Assessment
Appendix B: Needs Assessment

B.1          Application of Ontario Resource and Transmission Assessment
             Criteria (ORTAC)
In accordance with Ontario Resource and Transmission Assessment Criteria (“ORTAC”), the
system must be designed to provide continuous supply to a local area, under specific
transmission and generation outage scenarios summarized in Table B-1. Voltage and thermal
limitations should be respected under these outage conditions.

Table B-1: ORTAC Criteria – Transmission and Generation Outage Scenarios

                                                                                                   Maximum
             Pre-contingency                      Contingency¹          Thermal Rating            Permissible
                                                                                                Load Rejection
                                                        N-0                Continuous                 None
                        Local generation
                                                        N-1                  LTE²                     None
 All transmission          in-service
                                                        N-2                  LTE²                   150 MW
       elements                                         N-0                Continuous                 None
       in-service       Local generation                N-1                  LTE²                   150 MW³
                         out-of-service                                                            >150 MW³
                                                        N-2                    LTE²
                                                                                                (600 MW total)
 1. N-0 refers to all elements in-service; N-1 refers to one element (a circuit or transformer ) out of service;
 N-2 refers to two elements out of service (for example, loss of two adjacent circuits on same tower, breaker failure
 or overlapping transformer outage); N-G refers to local generation not available (for example, out of service due to
 planned maintenance).
 2. LTE: Long-term emergency rating (50-hr rating for circuits, 10-day rating for transformers).
 3. Only to account for the capacity of the local generating unit out of service.

ORTAC Load Security and Restoration

With respect to supply interruptions, ORTAC requires that the transmission system be designed
to minimize the impact to customers of major outages, such as a contingency on a double-circuit
tower line resulting in the loss of both circuits, in two ways: by limiting the amount of customer
load affected; and by restoring power to those affected within a reasonable timeframe.

Specifically, ORTAC requires that no more than 600 MW of load be interrupted in the event of a
major outage involving two elements. Further, load lost during a major outage is to be restored
within the following timeframes:

   •     All load lost in excess of 250 MW must be restored within 30 minutes;
   •     All load lost in excess of 150 MW must be restored within four hours; and

                                                                                       Appendix B - Page 1 of 8
• All load lost must be restored within eight hours.
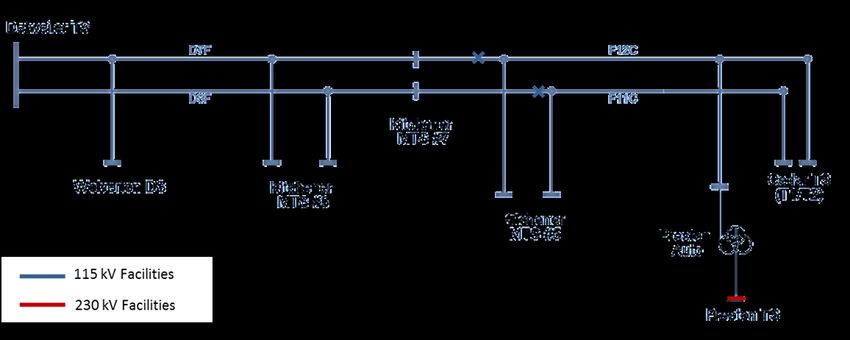
B.2 Study Assumptions
Planning criteria was applied to assess supply capacity and reliability needs of the KWCG
transmission system, shown in Figure B-1.
Figure B-1: KWCG Transmission System
There is no major generation station in the KWCG Region. The majority of supply to the load is
provided by a number of 500 kV to 230 kV and 230 kV to 115 kV auto-transformers as follows:
• Two 500/230 kV auto-transformers at Middleport TS
• Four 230/115 kV auto-transformers at Burlington TS
• Three 230/115 kV auto-transformers at Detweiler TS
• Two 230/115 kV auto-transformers at Cedar TS
• One 230/115 kV auto-transformers at Preston TS
A number of existing voltage support facilities are installed on the transmission and
distribution system and are assumed to be available as part of the needs analysis.
Appendix B - Page 2 of 8PSS/E Base case and Bulk System Conditions
The KWCG transmission system was assessed using PSS/E Power System Simulation software.
The PSS/E base case for the KWCG Region regional planning study was adapted from the 2015
base case that was produced by the IESO for the 2010 Northeast Power Coordinating Council
(“NPCC”) review.
The following bulk system conditions were assumed for purpose of the power flow simulation
studies:
• All eight Bruce units and the new 500 kV double-circuit line between the Bruce Complex
and Milton SS. All units at Darlington are assumed to be in-service, and all of the units
at Pickering GS are assumed to be unavailable.
• Renewable generation in the Bruce and other parts of southwestern Ontario will have an
impact on the bulk system flows into the KWCG Region. About 1,800 MW of wind
output in the Bruce area and about 400 MW of renewable output from southwestern
Ontario (Buchanan, Chatham and Sarnia).
Equipment Rating
For transmission facilities, continuous and limited time ratings based on an ambient
temperature of 35°C for summer and a wind speed of 4 km/hour were respected.
Demand Forecast
The KWCG transmission system is assessed under the near- and medium-term planning
forecast (2014-2023) and longer-term planning forecast scenarios (2024-2033), provided in
Appendix A.4.
B.3 Load Meeting Capability (LMC) of the Existing KWCG
Transmission System
Supply capacity describes the electricity system’s ability to provide continuous supply to a local
area. This is limited by the load meeting capability (“LMC”). The LMC of transmission or sub-
system is defined the maximum demand that can be supplied on a transmission line or sub-
system under applicable transmission and generation outage scenarios as prescribed by
ORTAC.
Appendix B - Page 3 of 8B.3.1 South Central Guelph 115 kV Sub-system: LMC and Supply Capacity
Needs
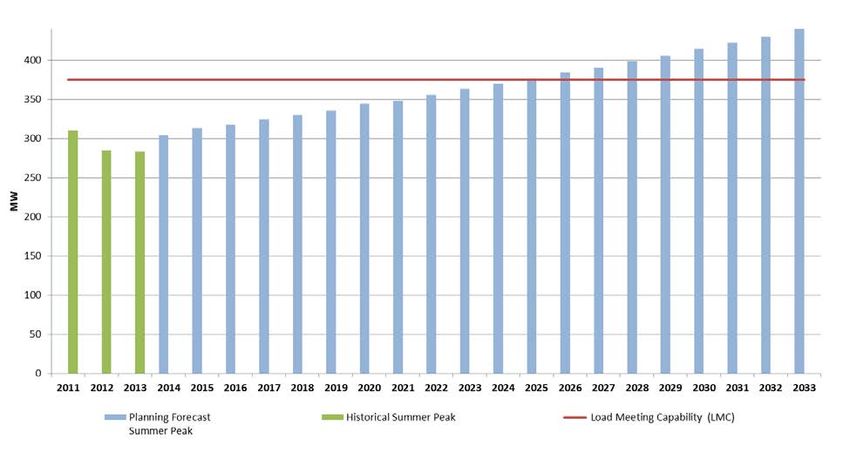
The South-Central Guelph 115 kV sub-system (B5/6G) is a double circuit 115 kV transmission
line supplying Cedar TS (T7/8), Hanlon TS, Arlen MTS, Puslinch DS and two transmission-
connected customers, as shown in Figure B-2.
Figure B-2: South-Central Guelph 115 kV Sub-system
Based on the application of ORTAC criteria, this system has an LMC of 100 MW. This limit is
based on the voltage limitations of the B5G circuit, assuming the B6G is out-of-service.
As shown in Figure B-3, the summer peak demand in the South-Central Guelph area has
already exceeded the 100 MW LMC limit of the South-Central Guelph 115 kV system over the
last couple of years. The existing South-Central Guelph 115 kV system does not meet the
ORTAC supply capacity criteria.
Appendix B - Page 4 of 8Figure B-3: Summer Peak Demand on South-Central Guelph 115 kV Sub-system
B.3.2 Kitchener-Guelph 115 kV Sub-system: LMC and Supply Capacity
Needs
The Kitchener-Guelph 115 kV sub-system (D7/9F and F11/12C) is a double circuit 115 kV
transmission line supplying Cedar TS (T1/T2), Kitchener MTS #5, Kitchener MTS #7, Kitchener
MTS #3, and Wolverton DS, as shown in Figure B-4.
Figure B-4: Kitchener-Guelph 115 kV Sub-system
Based on the application of ORTAC criteria, this system has a LMC of 260 MW. This limit is
based on the thermal overloading of the D7F circuit, assuming the D9F circuit is out-of-service.
Appendix B - Page 5 of 8Figure B-6: Cambridge 230 kV Sub-system
Based on the application of ORTAC criteria, this system has a LMC of 375 MW. This limit is
based on the thermal overloading of the M20D circuit, assuming the M21D circuit is out-of-
service.
Under the high-growth scenario (Figure B-7), the summer peak demand on the Cambridge
230 kV sub-system will exceed the 375 MW LMC limit in the summer of 2026 and will not meet
the ORTAC supply capacity criteria.
Appendix B - Page 6 of 8Figure B-7: Summer Peak Demand on Cambridge 230 kV Sub-system
Over the longer term, future electricity demand growth in Cambridge can be supplied on the
Kitchener-Guelph 115 kV sub-system. Once the GATR project comes into service around 2016,
there will be sufficient capacity on the Kitchener-Guelph 115 kV system to supply up to
100 MW of peak demand growth in the Cambridge area. Therefore, there are no supply
capacity needs identified in the Cambridge area beyond 2023.
Appendix B - Page 7 of 8As shown in Figure B-5, the summer peak demand in the Kitchener and Guelph area exceeded
the 260 MW LMC limit of the Kitchener-Guelph 115 kV system in the summer of 2014. Given
the forecast near- and medium-term summer peak demand growth, the existing Kitchener-
Guelph 115 kV system does not meet the ORTAC supply capacity criteria.
Figure B-5: Summer Peak Demand on Kitchener-Guelph 115 kV Sub-system
B.3.3 Cambridge 230 kV Sub-system: LMC and Supply Capacity Needs
The Cambridge 230 kV sub-system (M20/21D) is a double circuit 230 kV transmission line
supplying Preston TS, Cambridge MTS #1, Galt TS and a transmission-connected customer, as
shown in Figure B-6 below. Today, this 230 kV transmission is the main source of supply to
customers in the Cambridge area.
Appendix B - Page 8 of 8Kitchener-Waterloo-Cambridge-Guelph IRRP Appendix C: Transmission Options to Improve Load Restoration on Cambridge-Kitchener 230 kV Sub-system
Appendix C: Transmission Options to Improve Load Restoration on Cambridge-Kitchener
                                   230 kV Sub-system

      Figure C-1: Options to Improve Restoration on Cambridge-Kitchener 230 kV Sub-system

                                                                    Fault on Middleport X Detweiler -                        Fault on Galt junction X Preston TS –                      Cost        Cost/Load
 Option           Options to Improve Restoration
                                                                         Restorable Load (Note 2)                                  Restorable Load (Note 2)                           (Note 3)      Restored
                                                                                 100 MW                                                     100 MW
             Cambridge-Kitchener 230 kV sub-system
     --                                                          (Cambridge & North Dumfries Hydro’s load –                (Cambridge & North Dumfries Hydro’s load –                     0           $0/MW
             (After GATR comes in-service – Note 1)
                                                                                  Note 4)                                                    Note 4)
                                                                                 100 MW                                                    100 MW
               230 kV in-line switches on M20/21D at
     1                                                           (Cambridge & North Dumfries Hydro’s load –                (Cambridge & North Dumfries Hydro’s load –                   $6M          $60k/MW
                         Preston Junction
                                                                                  Note 4)                                                   Note 4)
                                                                                   135 MW                                                     135 MW
                                                                        (Kitchener Wilmot Hydro’s load)                            (Kitchener Wilmot Hydro’s load)
                                                                                                                                                                                                     $11k/MW
               230 kV in-line switches on M20/21D at
     2                                                                                                                                                                                  $6M             to
                           Galt Junction                                         400 MW                                                    100 MW
                                                                                                                                                                                                     $25k/MW
                                                                 (Cambridge & North Dumfries Hydro’s load –                (Cambridge & North Dumfries Hydro’s load –
                                                                                  Note 4)                                                   Note 4)
              One 230 kV cap bank at Preston TS plus                             140 MW                                                    140 MW
     3        230 kV in-line switches on M20/21D at              (Cambridge & North Dumfries Hydro’s load –                (Cambridge & North Dumfries Hydro’s load –                  $11M          $79k/MW
                        Preston Junction                                          Note 4)                                                   Note 4)

              2nd auto-transformer at Preston TS plus                            200 MW                                                    200 MW
     4        230 kV in-line switches on M20/21D at              (Cambridge & North Dumfries Hydro’s load –                (Cambridge & North Dumfries Hydro’s load –                  $21M         $105k/MW
                         Preston Junction                                         Note 4)                                                   Note 4)

               2nd auto-transformer at Preston TS plus
                                                                                 280 MW                                                    280 MW
               230 kV in-line switches on M20/21D at
     5                                                           (Cambridge & North Dumfries Hydro’s load –                (Cambridge & North Dumfries Hydro’s load –                  $31M         $111k/MW
                Preston Junction plus two 230 kV cap
                                                                                  Note 4)                                                   Note 4)
                        banks at Preston TS

Notes: (1) Prior to the installation of the GATR project, only 65 MW of electricity supply in Cambridge can be restored within 30 minutes through the existing auto-transformers at
Preston TS. (2) Restorable load values are approximate values only as the actual amount of restorable load will depend on the prevailing system conditions and Operating/Control Centre protocols and
priorities and are based on the KWCG IRRP planning forecast. (3) All prices are based on historical data: taxes extra, overhead extra, no escalation considered, no assumptions are made to
feasibility or construction, no assumptions made as to space requirements, real estate and environmental cost extra. (4) Restoration of 230 kV connected load (Cambridge and North Dumfries
Hydro’s load) via the Preston TS auto-transformer may require operational measures on the 115 kV system to secure the transmission system to hand a subsequent contingency e.g., open low voltage bus-tie
breakers/switches at 115 kV connected stations.

                                                                                                                                                                      Appendix C - Page 1 of 1
You can also read