DEVELOPMENT OF A FAN-SHAPED DISTANCE METER SYSTEM FOR MEASURING CONCEPT, PHOTOGRAMMETRIC ORIENTATION AND FIRST RESULTS
←
→
Page content transcription
If your browser does not render page correctly, please read the page content below
ISPRS Annals of the Photogrammetry, Remote Sensing and Spatial Information Sciences, Volume V-2-2020, 2020
 XXIV ISPRS Congress (2020 edition)

DEVELOPMENT OF A FAN-SHAPED DISTANCE METER SYSTEM FOR MEASURING
 MOVING ROTOR BLADES –
 CONCEPT, PHOTOGRAMMETRIC ORIENTATION AND FIRST RESULTS

 M. Goering*, T. Luhmann

 Jade University of Applied Sciences, Institute of Applied Photogrammetry and Geoinformatics (IAPG),
 Ofener Str. 16/19, 26121 Oldenburg, Germany - (Martina.Goering, Thomas.Luhmann)@jade-hs.de

 Commission II, WG II/10

KEY WORDS: Fan-shaped distance meter system, laser spot, camera, photogrammetry, sensor fusion, relative orientation, wind
 turbine, rotor blade torsion

ABSTRACT:

For wind turbines, the actual deformation of the rotor blades during operation is of great interest to manufacturers. Photogrammetry
and laser scanning are suitable for contactless measurement. The torsion of the rotor blade is of major interest and should be determined
with an accuracy of less than 1°. This requires a high precision in the recording distance. The combination of photogrammetry and
laser scanning thus enables the acquisition of the relevant data. The nacelle movement is photogrammetrically measured. To measure
the torsion, laser scanners in 1D mode are used. A further development of the measuring scenario is a novel fan-shaped distance meter
system, presented in this contribution. It consists of four distance measuring units of a Z+F Imager 5006 laser scanner, whose laser
beams span a plane in object space. The distance measuring units provide synchronous range measurements. For the calculation of 3D
coordinates, their relative orientation is required. Two photogrammetric approaches are presented in this paper. In the first method, the
meter system is moved relative to the testfield. The data acquisition and evaluation is complex. In the second method, a stereo camera
is built onto the meter system so that 3D coordinates can be measured directly. This method allows a fast data acquisition and evaluation
for system calibration. The realization on a real wind turbine is possible. This contribution discusses challenges and advantages of
measuring the rotor blades during operation and presents the realisation of the novel meter system and the determination of the relative
orientation. The new meter system makes it possible to measure the torsion during operation of the wind turbines without any targeting
with required accuracy.

 1. INTRODUCTION

The deformation of rotor blades during operation of a wind A non-contact and targetless measurement of the deformation
turbine is an interesting topic for turbine manufacturers in order must be carried out from the ground in order to provide an
to optimize the rotor blades with regard to aerodynamics, energy approach that is relevant for practical applications. The challenge
yield and material properties. The dimensions and degrees of lies in the required accuracy. Especially the torsion of the rotor
freedom of wind turbines make them a complex measurement blades at the outer tip is relevant for turbine manufacturers and
object (Figure 1). The top speed at the outer tip of rotor blades should be determined with an accuracy of less than 1°. The
can be up to 80 m/s depending on the type of turbine. The rotor combination of photogrammetric approaches with laser
blades have a cross section of several meters at the hub, which measurement technology offers the potential to achieve the
reduces towards the outer tip. As a result, the rotor blade is less required accuracy. The tower and nacelle movements are
stiff there and severe deformation occurs. The flapping motion at recorded photogrammetrically and the deformations – especially
the outer tip is 10% of the rotor blade length (Edzard, 2009) and the torsion – of the rotor blades are measured with laser
a torsion of a few degrees is expected. technology. Several laser scanners in 1D mode were previously
 used for this purpose, but their practical application is
 complicated (Grosse-Schwiep et al., 2013). Therefore, the fan-
 shaped distance meter system (FDMS) is being developed as an
 optimization and is presented in this paper. It consists of four
 distance meters that span a plane. This enables the detection of
 torsion with the required accuracy of less than 1°.

 Chapter 2 describes the current state of technology and science.
 Chapter 3 shows the previous method with several synchronous
 laser scanners. As an improvement to the laser scanners, a new
 measuring system consisting of individual distance meters is
 developed and presented in chapter 4. Chapter 5 describes the
 relative orientation of the individual distance meters in the
 overall system of the FDMS with a static and a dynamic
 Figure 1. Degrees of freedom (in green) of the wind turbine measuring set-up. Finally, a summary and outlook is given in
 (adapted from Hau, 2008) chapter 6.
* Corresponding author

 This contribution has been peer-reviewed. The double-blind peer-review was conducted on the basis of the full paper.
 https://doi.org/10.5194/isprs-annals-V-2-2020-711-2020 | © Authors 2020. CC BY 4.0 License. 711
ISPRS Annals of the Photogrammetry, Remote Sensing and Spatial Information Sciences, Volume V-2-2020, 2020
 XXIV ISPRS Congress (2020 edition)

 2. RELATED WORK Luhmann (2016). The deformation properties of the wind turbine
 and rotor blades were derived from the acquired data. With the
To improve plant monitoring during operation, various developed adjustment method, it is possible to derive
monitoring techniques are already being installed (García deformation along the neutral axis of the rotor blade. Their work
Márquez et al., 2012). Strain gauges can be attached to the rotor does not focus the determination of torsion.
blades. However, these are susceptible to errors, especially
temperature has a high impact on the results (Papadopoulos et al., 3. METHODOLOGY
2000). The actual deformation of the blades cannot be adequately
described with these strain gauges. The measurement of profiles of rotor blades offers a lot of
 potential for the determination of deformation parameters from
Photogrammetric methods are suitable for optical detection. First the ground. To determine the torsion it is necessary to record at
measurements on a real turbine with a stereo camera system were least two cross profiles. One is measured directly at the hub to
published in Corten (1996). The wind turbine was covered with determine the angle of attack. With the other profile on the outer
a retro-reflective dot pattern to record vibrations from the tower tip the torsion can be derived. Additional profile data provides
and the rotor blades. the possibility to receive further detailed information about the
 torsion or deformation.
In Schmidt Paulsen et al. (2009), the tower and rotor blades were
covered with retro-reflective targets and observed with two To derive the torsion with an accuracy of less than 1°, a profile
synchronized stereo camera systems. Özbek (2013) demonstrated with high precision is required. Trigonometrically estimated, a
that the random error of the measurement is in the order of profile accuracy of 15mm is required for a blade cross section of
±5 mm. This value is in line with expectations. Furthermore, a 1m. The shape of a rotor blade hardly changes in relation to the
systematic proportion of up to approx. 30 mm could be detected length. It is most noticeable that the rotor blade becomes
for marks at the tip of the blade. It is assumed that there is a narrower to the outer tip. Therefore, for a 100m rotor blade the
correlation between the position of the mark in the image and the position of the profile should be known with an accuracy of 0.5m
systematic error. (information from a manufacturer). For a measurement from the
 ground at a distance of 100m, this means that the horizontal angle
In another project, the rotor blade is covered with a dot pattern at between the meter systems must be known better than 0.25°.
four positions and observed by two cameras (Winstroth et al.,
2014; Winstroth, Seume, 2015). Relative deformation to a The 3 o'clock position of the rotor blade is used as the relevant
reference time can be calculated. The measured points of a rotor measuring position (Figure 2). All distance measuring devices
blade rotation determine a plane whose axis of rotation is stand on the ground, are aligned at the height of the hub and are
assumed as the coordinate origin. distributed over the blade length. Due to the rotation of the blade
 (rotation angle α) the distance measuring devices acquire
As an alternative meter system, a laser scanner offers the different distances depending on the rotation angle. This enables
possibility of contactless acquisition without targets. If the laser an angle-based allocation of the measured values.
scanner or the measuring object is in motion, this is called
kinematic terrestrial laser scanning. The movement must be
detected by additional sensors for a geometrical correction. A
typical application is mobile mapping. Here the laser beam is
deflected around an axis and the third dimension is detected by a
multi-sensor platform. Wind turbines in operation have been
recorded with laser scanners in 1D and 2D mode to measure the
vibration of the tower (Paffenholz et al., 2008; Gikas, Daskalakis,
2009). In 1D mode, only the distance measurement is recorded.
Thus, during a rotor blade run, the surface of the blade is
measured depending on the angle of incidence and the blade
shape. The data of the rotor blades have not been analysed further Figure 2. Recording of profile data with distance measuring
so far. The scanned surface of the blade is called 'profile' in the devices depending on the angle of rotation α from 3 o’clock
following. By measuring the profile data at a fixed radius of the
blade, differences in the angle of incidence can already be Due to the degrees of freedom of the wind turbine, the profile
detected. The company Windcomp (2020) uses two distance data must be transformed into the coordinate system of the wind
meters to determine relative deformations of the rotor blades. The turbine or rotor blade (GL, 2012). In addition, the degrees of
distance meter systems aim at the tower at two different distances freedom must be recorded with additional sensor technology
from the hub. (such as a camera). The concept with the use of laser scanners is
 presented in Grosse-Schwiep et al. (2013). Alternatively, the
The usage of the 3D laser scanner mode is presented in Mitka et method of Jepping and Luhmann (2016) can be used to determine
al. (2019) for a stationary and rotating wind turbine. Simple the nacelle movements.
parameters such as angle difference between rotor blades can be
derived from the data. The Imager 5010 laser scanner from Zoller + Fröhlich GmbH is
 used in 1D mode for profile measurement. Since the beam is
In Kim et al. (2012) a meter system with three distance meters directed in a fixed direction, this mode is classified in laser class
(1D) is presented which is to support the alignment of ships at 3B, and it is dangerous (DIN, 2008). A laser safety officer has to
mobile ports. The distance meters are arranged in a triangle. The be present in order to avoid hazards. In the test, the actual passing
relative orientation is implemented by moving a testfield. time of the blade through the laser beam was 0.75sec at the hub
 and 0.01sec at the outer tip. Figure 3 shows the measured data for
The combination of a targetless photogrammetric approach in a profile run-through at the outer tip of the rotor blade. At the
combination with laser scanning data is presented in Jepping and minimum adjustable measuring frequency of 32kHz 300

 This contribution has been peer-reviewed. The double-blind peer-review was conducted on the basis of the full paper.
 https://doi.org/10.5194/isprs-annals-V-2-2020-711-2020 | © Authors 2020. CC BY 4.0 License. 712
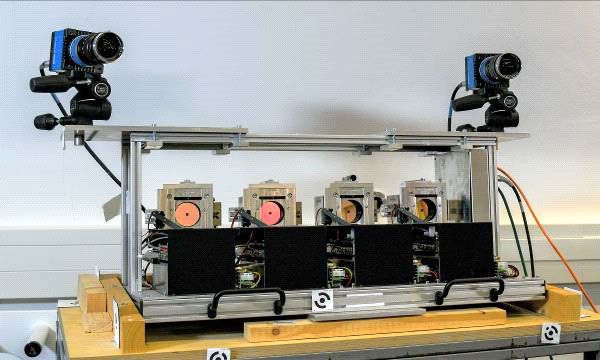
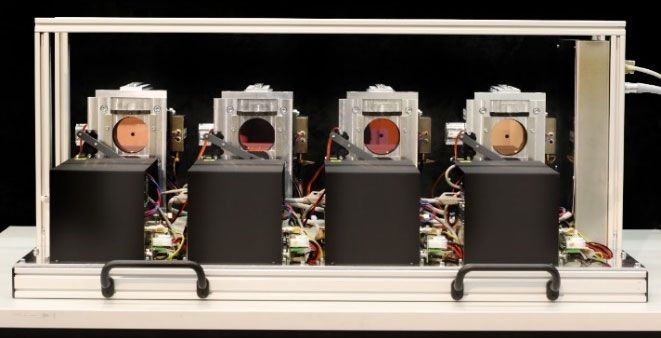
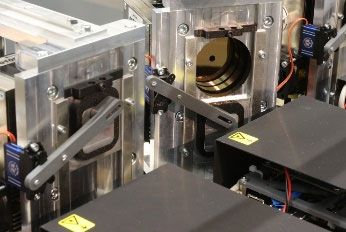
ISPRS Annals of the Photogrammetry, Remote Sensing and Spatial Information Sciences, Volume V-2-2020, 2020
 XXIV ISPRS Congress (2020 edition)

measured values are recorded at the outer tip. If a polynomial is to span a plane. This also simplifies alignment on a wind turbine
fitted by the measured values, a standard deviation of less than with the measurements of the angle of rotation in comparison to
2mm is resulting (Grosse-Schwiep et al., 2013). This provides a multiple alignments of multiple laser scanners (Figure 2).
precision for the distance measurement that allows a torsion
determination with an accuracy of less than 1°.

 Figure 5. Conceptual design of the fan-shaped distance meter
 system on a wind turbine
 Figure 3. Measured data of a rotor blade run-through at the
 outer tip with the Z+F Imager 5010 in 1D mode
 The meter system is mounted on a platform which is equipped
 with a tilting device. A rotation around the vertical axis is
Using additional sensor equipment, an existing CAD model of possible for each distance meter. Thus, depending on the
the nacelle and various transformations, measured profiles in the measuring arrangement in the laboratory or field test, the
coordinate system of the rotor blade can be obtained as a result. horizontal angles can individually be adjusted to the measuring
For the deformation estimation the CAD model of the rotor blade object. The vertical angles of the distance meters are fixed. In
must be available (Figure 4). This usually can be obtained from addition to the simplified alignment to the rotor blades, another
the manufacturer or can be determined by procedures given by advantage of the meter system is that there are fewer degrees of
Jepping and Luhmann (2016). The torsion is derived by adapting freedom and presumably fewer error influences.
the profile data to the CAD model. The large number of measured
values simplifies the adaptation to a structureless object like the 4.2 Practical realisation
rotor blade. The determination of the first measured value on the
blade is limited by the laser spot size (here 4cm at 100m). The practical realisation of the meter system was carried out by
 the company Zoller & Fröhlich GmbH. Four distance meters
 from the Z+F Imager 5006 series are used for the FDMS (Figure
 6). The distance meters have an unambiguous range of 87m
 whereby up to three intervals can be measured. Measuring rates
 between 32khz and 1Mhz are possible. The distances are
 determined using the phase comparison method and are specified
 with a distance measurement accuracy of < 1mm, which depends
 on factors such as the object surface, the angle of incidence and
 other factors (Eric et al., 2017). The wave length of the measuring
 laser is at 785nm, hence in the infrared range. Further sensor
 characteristics can be taken from Z+F (2020). The dimensions of
 Figure 4. Fitting of profile data (in white) to CAD model (in
 the FDMS are 86cm x 36cm x 36cm with a weight of approx.
 green)
 35kg.

For the calculation of deformation, the profiles must be measured
at the same angle of rotation respectively at the same time. In
addition to exact temporal synchronization, perfect spatial
alignment and orientation of the distance meters are required. An
approach is presented to allow for the estimation of the systems
orientation within a lab calibration.

4. DEVELOPMENT OF THE FAN-SHAPED DISTANCE
 METER SYSTEM

The optimization of the approach with laser scanners in 1D mode
consists in the development of a new meter system that we call Figure 6. Practical set-up of the fan-shaped distance meter
“Fan-shaped distance meter system” (FDMS). The FDMS system with four distance meters on a platform
simplifies the determination of the laser beam alignment on the
rotor blades, improves the accuracy of the orientation and
represents a cost-effective alternative. A laser scanner usually measures a reference distance at each
 zero crossing and applies a correction for the respective rotation.
4.1 Concept However, this is not possible with distance meters. For this
 reason, a retractable shutter is installed in each case, for which a
With the FDMS, several distance meters (at least two) are calibrated distance is available (Figure 7 left). The shutter can be
mounted on a platform (Figure 5). The laser beams are adjusted inserted into the laser beam at definable time intervals and thus

 This contribution has been peer-reviewed. The double-blind peer-review was conducted on the basis of the full paper.
 https://doi.org/10.5194/isprs-annals-V-2-2020-711-2020 | © Authors 2020. CC BY 4.0 License. 713
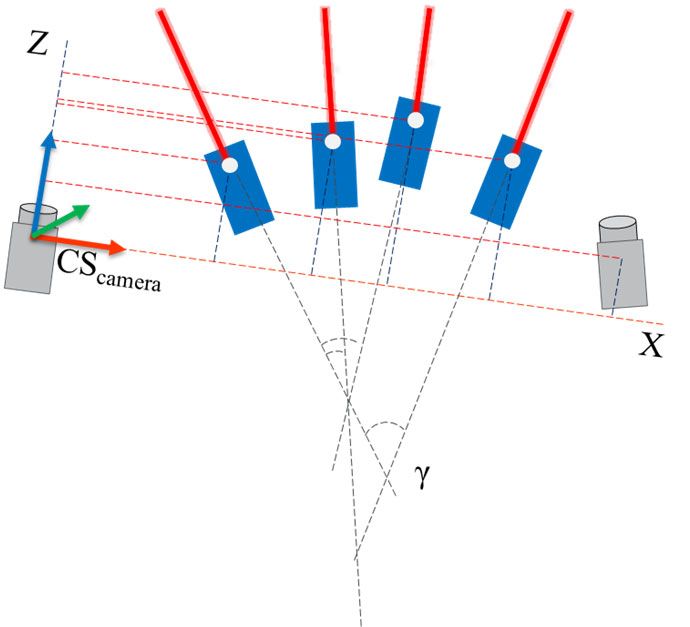
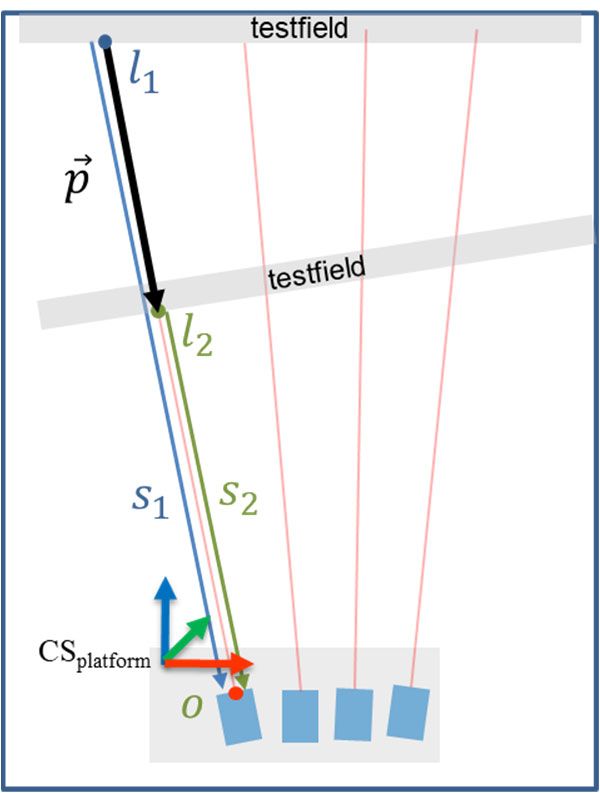
ISPRS Annals of the Photogrammetry, Remote Sensing and Spatial Information Sciences, Volume V-2-2020, 2020
 XXIV ISPRS Congress (2020 edition)

the effect of a warming up (distance change) of the laser unit can a horizontal and vertical angle (γ, β) (Figure 9). The coordinate
be corrected. Figure 7 on the right shows a telescopic sight that system is located in the right distance meter but it can be
can be attached to the distance meters for easier alignment to the transformed to every other of the distance meters or cameras if
measurement object. needed.

 After physical adjustment, the laser beams span a plane in object
 space. A possible deviation from the plane can be checked with
 the relative orientation and should therefore not be included as a
 constraint to the adjustment. Thus the orientation between
 skewed straight lines is determined.

 Figure 7. left: two distance meters with one closed and one
opened retractable shutter for the reference distance data; right:
 telescopic sight for alignment to the measurement object

To align the laser beams in a plane, they must represent a line
when intersecting with a plane in object space. An adjustment of
the laser beams is done by two different recording distances to
detect a possible vertical axis error.

The meter system is operated via a laptop with control software.
Since the underlying hardware is an off-the-shelf scanner, the
control software is fully integrated with the system and all
standard commands can be sent to the system via this software,
 Figure 9. Relative orientation of the fan-shaped distance meter
as with any other laser scanner. The distance meters are
 system, coordinate system in a camera (CScamera), top view
synchronized internally and can also be synchronized with other
sensors, such as a laser scanner or a camera system. For each
measured distance, a distance value, a highly linear intensity In the FDMS, each distance meter is mounted on a rotary table
value and a time stamp are taken via the manufacturer's SDK so that the horizontal angle (γ) can be adjusted according to the
(Software Development Kit). application. After each new alignment, the relative orientation
 must be determined again. If the origin of a distance meter with
4.3 Combination with camera system respect to the rotary table is known, a direct derivation of the
 relative orientation is possible.
The transformation into a superior coordinate system is possible
by combining the FDMS with a camera. For a test of the meter 5.1 Basic workflow
system, reference data are recorded photogrammetrically under
laboratory conditions. For this purpose two high-speed cameras To determine the relative orientation of the distance measuring
pco.dimax CS3 (PCO, 2020) are attached to the frame of the fan devices, it is necessary to move the meter system or a measuring
sensor (Figure 8). The baseline between them is approximately object (Figure 10). Each distance measuring device measures one
1m. distance. With a further distance provided by a known movement
 (shift/rotation - 6DOF) the spatial direction and also the origin of
 the laser beam can be determined. By two or more measurements,
 the 3D coordinates of the laser spot ( 1-n) can be used to define
 the spatial direction p⃗ of each laser beam. In order to estimate the
 6DOF movement, a photogrammetric approach is chosen which
 allows for the determination of 3D coordinates of the laser spots
 ( 1, 2) on a testfield. The coordinate system for this must be on
 the meter system (CSplatform or CScamera). The origin (X, Y, Z) can
 be determined with the vector p⃗ and the measured distances (s1-
 n).

 Large distance differences (s1, s2) mean that the calculated spatial
 direction p⃗ has to be extrapolated to a lower extent and there is
Figure 8. High-speed cameras mounted on fan-shaped distance less leverage. It is also advantageous if the spatial direction is
 meter system determined by more than two 3D coordinates ( 1-n). A regression
 line can be calculated through all 3D coordinates. Together with
 the measured distances the origin can be determined by an
 5. RELATIVE ORIENTATION OF THE FAN-SHAPED adjustment.
 DISTANCE METER SYSTEM
 Subsequently, the relative orientation is calculated using the
Each sensor only detects distances without having a common calculated sensor positions (X, Y, Z) and the 3D coordinates of
reference to each other. To calculate 3D coordinates, the relative the laser spots. For this purpose, the direction vector is
orientation of the distance meters must be determined among determined from which the horizontal (γ) and vertical (β) angles
each other. For each distance meter five unknowns must be for each sensor can be derived.
estimated, these are the respective positions (X, Y, Z) as well as

 This contribution has been peer-reviewed. The double-blind peer-review was conducted on the basis of the full paper.
 https://doi.org/10.5194/isprs-annals-V-2-2020-711-2020 | © Authors 2020. CC BY 4.0 License. 714
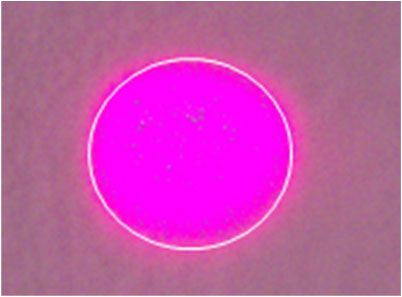
ISPRS Annals of the Photogrammetry, Remote Sensing and Spatial Information Sciences, Volume V-2-2020, 2020
 XXIV ISPRS Congress (2020 edition)

 Figure 12. Laser spots from different directions with Mamiya
 ZD with strong overexposure (white)

 Figure 13. Intensities of a laser spot of the Mamiya ZD; left: red
 Figure 10. Concept for relative orientation with moving colour channel, right: green colour channel
 testfield; coordinate system on the platform of meter system
 (CSplatform); p⃗ direction vector; s1 and s2 measured distances With the camera Mamiya ZD an image bundle of a fixed test field
 with the laser spots can be recorded. The overexposure of the
5.2 Laser spot measurement laser spots is deliberately used for ellipse measurement, as these
 can be evaluated with the software AICON 3D Studio. The
The laser beam intersects with the measured object and a laser overexposed area covers 12 pixels in diameter (0.5 mm in object
spot can be detected using a camera. The centre of the laser spot space). The bundle adjustment results in an RMS in all coordinate
is determined photogrammetrically (ellipse star operator – directions of the laser spots of less than 0.1mm. This camera can
Luhmann et al., 2020). The laser spot has a calculated diameter be just used for a static setup because a synchronization with
of 3.5mm at the laboratory testfield distance and a Gaussian other devices is not possible.
intensity distribution.
 For kinematic applications in dynamic setups an RGB camera
The shape of the laser spot in particular depends on the angle of without infrared filter (CS3 cameras from PCO AG) is used. The
incidence on the target (plane), so that the spot forms an ellipse camera can be synchronized with the FDMS by sending a TTL
(Figure 11). trigger signal. Figure 14 shows a laser spot, recorded with this
 camera at a distance of 3m. Figure 15 shows intensities of the
 laser spot of Figure 14. The RGB image and the intensities in the
 red, green and blue channels are shown. Since the laser has a
 wavelength of 785nm it should be expected that the laser spot
 would be best visible in the red channel which is confirmed by
 Figure 14. This channel is used for ellipse measurement in
 AICON 3D Studio.

 Figure 11. Close-up laser spot with Mamiya ZD camera; left:
 RGB image with ellipse in white, right: 3D display of the
 intensities of the red colour channel

Interferences lead to the speckle effect on the laser projection,
resulting in an inhomogeneous intensity distribution. Basics for Figure 14. Laser spot on image of the PCO camera; from left to
photogrammetric measurement of laser spots with speckle are right: RGB image, red, green and blue colour channel
presented in Clarke, Katsimbris (1994). The speckle effect is
dependent on its direction. If the laser spot is photographed with
a camera from different positions, the shape results differently.
Figure 12 shows the same laser spot recorded at different times
and from different spatial directions. Figure 13 shows the
intensities of a laser spot acquired with a Mamiya ZD camera. In
the red channel, in contrast to the green channel, a high amount
of speckle and a blurred ellipse contour can be identified.
According to Beraldin (2004), the influence of the speckle on the
position can be estimated and would result within 2-5µm (0.05 Figure 15. Intensities of a laser spot of the PCO camera;
Pixel) for the Mamiya ZD camera setup. However, investigations left: red colour channel, right: green colour channel
show that the ellipse centre on this camera varies by 0.3 pixels on
average using template matching, which corresponds to 0.03mm
standard deviation in object space with a maximum deviation of The available data show that there is much potential for further
one pixel (0.1 mm). investigations. The use of a polarization filter can also be tested.

 This contribution has been peer-reviewed. The double-blind peer-review was conducted on the basis of the full paper.
 https://doi.org/10.5194/isprs-annals-V-2-2020-711-2020 | © Authors 2020. CC BY 4.0 License. 715
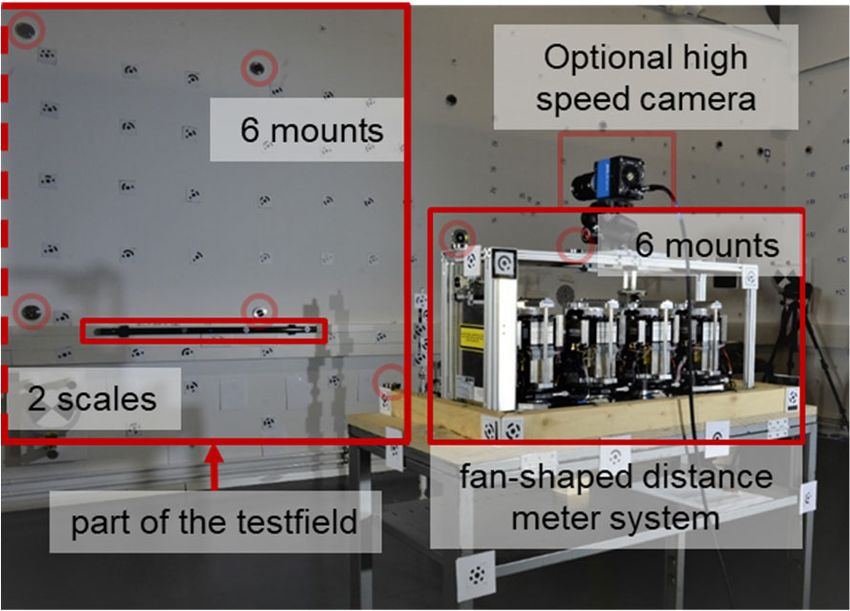
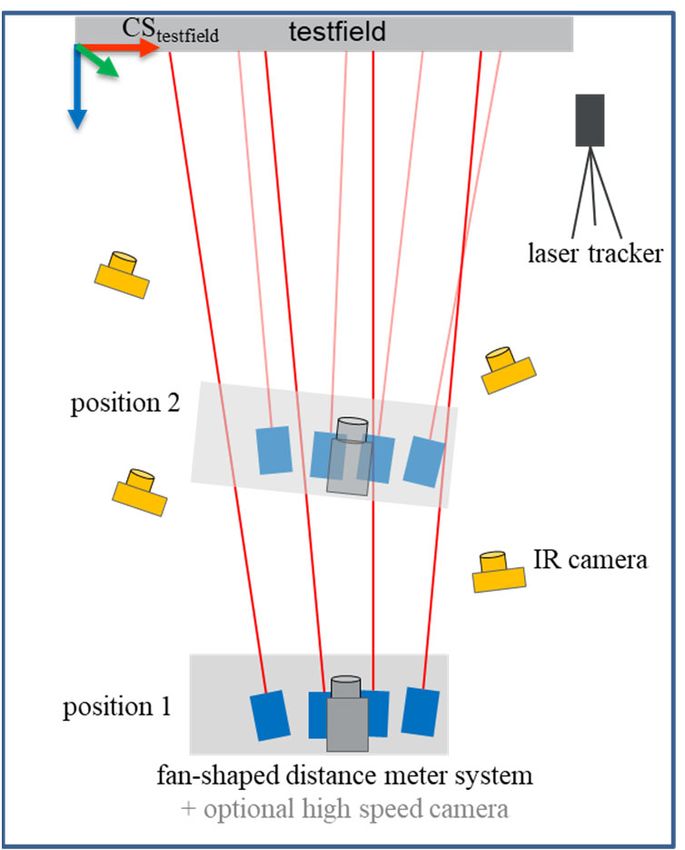
ISPRS Annals of the Photogrammetry, Remote Sensing and Spatial Information Sciences, Volume V-2-2020, 2020
 XXIV ISPRS Congress (2020 edition)

5.3 Determining the relative orientation: Method 1 mathematically, the testfield has moved and the spatial direction
 of the laser beam can be determined from the 3D coordinates of
With this method the relative orientation of the FDMS can be the laser spots (step 6). Applied to the distance of the FDMS, the
determined by moving the meter system (Figure 16). In this case, origin and also the relative orientation can be calculated (step 7).
a high speed camera does not have to be permanently installed on
the system but is used for the transformation into a superior
coordinate system in later applications. With this method it is
possible to achieve large distances between the 3D coordinates
of the laser spots of the distance meters and thus reduce the above
mentioned, unwanted leverage effects of extrapolation.

The alignment of the distance meters is given for a laboratory
setup with a model of a wind turbine. The laboratory environment
allows a maximum acquisition distance of 10m. This results in a
width of 2m for the configuration of the testfield. The principle
measurement setup is shown in Figure 17 with part of the test
field. The testfield is fixed on a wall due to its required size and
the meter system is moved to obtain at least two 3D coordinates
of a laser spot. The coordinate system of the testfield (CStestfield)
and the platform (CSplatform) is located in the interchangeable
target mounts for 1.5” hemispherical targets (Spherically Figure 17. Measurement setup for method 1
Mounted Reflector or photogrammetric target) on the testfield
and on the FDMS. The measurement setup is described in Consequently, coordinates of all targets are given in the
Goering and Luhmann (2017). coordinate system of the meter system (CSplatform). If a camera is
 fixed to the meter system (grey camera in Figure 16), the relative
 orientation can be calculated with known interior orientation
 using space resection in CSFDMS (step 8). Thus a transformation
 into a superior coordinate system is provided.

 Four positions of the FDMS are recorded in this method. A
 common solution via a regression line is possible, but also the
 combination of two positions. The following tables show the
 result and the respective standard deviations from the
 combination of two positions. The measurements correlate with
 each other, but they allow an impression of the measurement
 procedure.

 Relative orientation
 X [mm] Y [mm] Z [mm] β [°] γ [°]
 Sensor 1 524.6 0.0 0.0 90.0 85.4
 Sensor 2 350.5 -0.7 2.8 90.0 87.6
 Sensor 3 175.3 -0.5 1.2 90.0 89.2
 Sensor 4 0.0 0.0 0.0 90.0 93.7
 Table 1. Relative orientation of the fan-shaped distance meter
 system of method 1 (mean value of six combinations)

 Figure 16. Concept of method 1 for determining the relative
 Standard deviations
 orientation
 X [mm] Y [mm] Z [mm] β [°] γ [°]
To measure the laser spots in the testfield, an image bundle is Sensor 1 0.92 0.00 0.00 0.04 0.04
taken with the IR camera (Mamiya ZD, yellow camera in Figure Sensor 2 1.16 1.31 2.65 0.02 0.04
16, step 1). The accuracy of the image measurements in the Sensor 3 0.49 0.93 3.73 0.02 0.05
bundle was checked and only a minor influence on the relative Sensor 4 0.00 0.00 0.00 0.00 0.05
orientation of the FDMS was found. For practical reasons the Table 2. Standard deviations for relative orientation
testfield is additionally measured with superior quality using a
Nikon D2 (step 2). The data sets of Mamiya (each position) are The influence of the standard deviations can be calculated using
transformed to the data set of the Nikon camera (reference; step trigonometric techniques. Table 3 shows the influence (linear) for
3). The result of this step are 3D coordinates of the laser spots of measured values at 100m acquisition distance. If the meter
all distance meters in the coordinate system of the testfield system is installed parallel to the rotor blade, the deviation in X
(CStestfield). direction describes the uncertainty in position of the profile on
 the rotor blade. This is less than 0.1m and thus below the required
In order to detect the movement of the meter system, an API T3 position determination of 0.5m. The simultaneous passage
laser tracker is applied which uses an interferometer. The laser (Figure 2) of a blade is also possible, since the effects are also far
tracker is used to measure Spherically Mounted Reflector in below the blade diameter (Y-axis). The Z-component has an
target mounts on the testfield and on the FDMS (step 4). All data effect on the bending of the blade but it is minimal.
can be transformed into the coordinate system at the meter system
(CSplatform) via the mounts (Figure 10; step 5). Thus

 This contribution has been peer-reviewed. The double-blind peer-review was conducted on the basis of the full paper.
 https://doi.org/10.5194/isprs-annals-V-2-2020-711-2020 | © Authors 2020. CC BY 4.0 License. 716
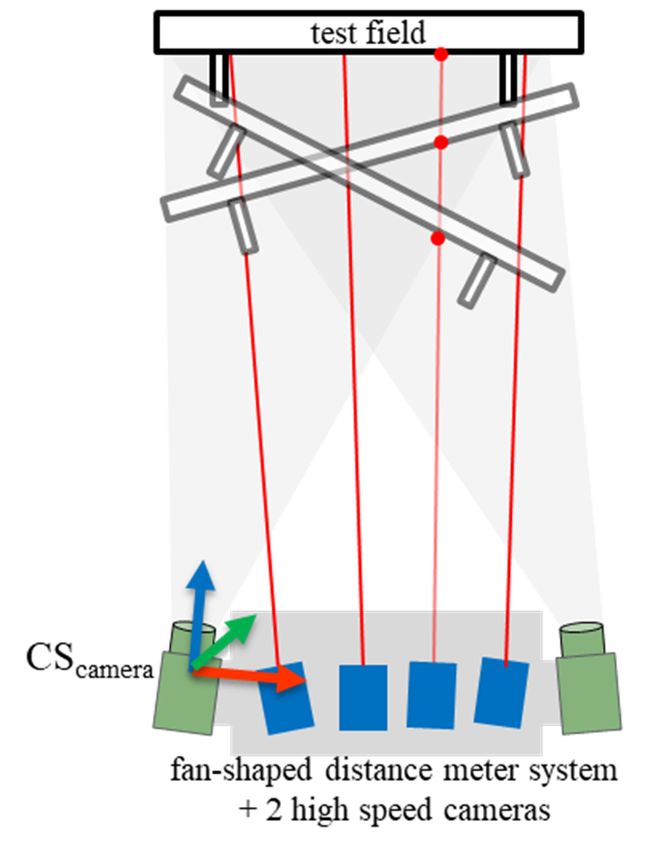
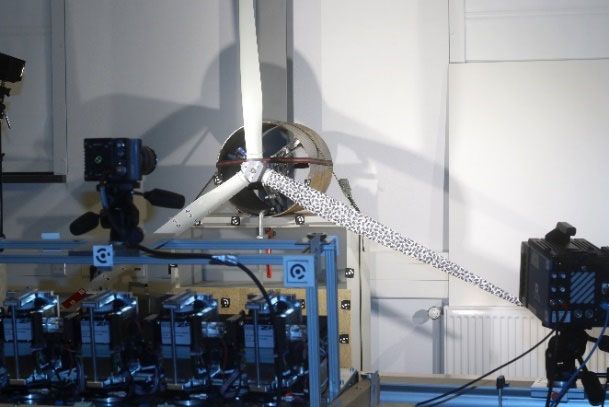
ISPRS Annals of the Photogrammetry, Remote Sensing and Spatial Information Sciences, Volume V-2-2020, 2020
 XXIV ISPRS Congress (2020 edition)

 Impact of standard deviations at 100m distance 6. SUMMARY & OUTLOOK
 X [mm] Y[mm] Z[mm]
Sensor 1 74.9 62.2 5.9 For the measurement of rotor blades of wind turbines during
Sensor 2 74.7 44.4 5.8 operation, a method is presented that combines photogrammetry
Sensor 3 86.5 38.4 4.8 and laser scanning. As a further development, a new meter
Sensor 4 83.6 0.0 5.4 system - the fan-shaped distance meter system - is presented. This
Table 3. Impact of standard deviations from relative orientation meter system consists of distance measuring devices that span a
 on 3D coordinates at 100m plane in object space. During operation of the wind turbine, the
 rotor blade runs through the laser beams so that the bending
The effort of measurement and evaluation is very high. (especially the torsion) can be measured. For the determination
Therefore, further independent measurements with this method of 3D coordinates of the rotor blade, all systems must be given in
are not planned. a common coordinate system. To determine the relative
 orientation of the developed meter system components, two
5.4 Determining the relative orientation: method 2 photogrammetric calibration methods are presented. In both
 methods, the laser spots of the distance measuring devices must
As described in chapter 5.1, the testfield can also be moved be measured. In the first method the meter system is moved
instead of the meter system to estimate the relative orientation. relative to the testfield. Data acquisition and evaluation are
For this purpose, a stereo camera system consisting of two CS3 complex because different systems are used, e.g. for measuring
cameras from PCO AG is attached to the FDMS. A typical the position of the FDMS. In the second method, a stereo camera
photogrammetric set of images with synchronous reading of the is attached to the meter system. With this system a set of images
distances of the FDMS is recorded with respect to the white of a testfield with coded target markers is acquired (testfield is
testfield (step 1). The concept is shown in Figure 18. If the moved) and the 3D coordinates of the laser spots are determined
relative orientation of the stereo system is fixed (step 2), 3D by forward intersection.
coordinates of the laser spots can be determined directly via a pair
of images by means of forward intersection (step 3). The With the known relative orientation, moving objects are recorded
subsequent determination of the relative orientation follows the in the next step. Measurements are performed on a pipe with a
description above (step 4). known nominal diameter. Another measurement object is a
 model of a wind turbine (Figure 19). First experiments for this
 have been published in Brandt et al. (2017). Reference data
 should be recorded photogrammetrically. The cameras on the
 meter system will be used for this purpose.

 Figure 19. Exemplary test setup for measuring moving rotor
 blades in the lab.
 Figure 18. Concept of Method 2 for determining the relative
 orientation. The deformations of the rotor blades can be measured during
 operation of the wind turbines. The synchronous acquisition of
This method allows for many positions of the testfield with little wind velocities by means of Wind-LiDAR methods
effort and thus several 3D coordinates of the laser spots can be (Schneemann et al., 2020) enables the manufacturers of wind
determined by forward intersection. The accuracy of the 3D energy plants to determine relevant characteristic values for the
coordinates is lower than in the described bundle approach with improvement and monitoring of the plants.
method 1. However, due to a larger number of 3D coordinates for
each laser spot with the associated distances, the relative
orientation can be determined with a similarly high accuracy, REFERENCES
compared to method 1. Furthermore, the accuracy can be
increased by using an additional camera. The data acquisition and Beraldin, J.-A., 2004: Integration of Laser Scanning and Close-
evaluation can be carried out much faster with this method. The Range Photogrammetry - The Last Decade and Beyond. XXth
disadvantage is, however, that the laser spot measurement at long International Society for Photogrammetry and Remote Sensing
distances is limited by the used cameras. (ISPRS) Congress, Commission VII, International Society for
 Photogrammetry and Remote Sensing (ISPRS), Istanbul.
Measurements with this method were carried out but not yet
evaluated conclusively. Brandt, T., Semmling, E., Zahl, M., Göring, M., Willemsen, T.,
 2017: Aufbau und Untersuchung einer Messeinrichtung zur

 This contribution has been peer-reviewed. The double-blind peer-review was conducted on the basis of the full paper.
 https://doi.org/10.5194/isprs-annals-V-2-2020-711-2020 | © Authors 2020. CC BY 4.0 License. 717
ISPRS Annals of the Photogrammetry, Remote Sensing and Spatial Information Sciences, Volume V-2-2020, 2020
 XXIV ISPRS Congress (2020 edition)

Deformationsmessung von bewegten Rotorblättern im system for remote relative 6-DOF motion using 1-D laser
Laborversuch mittels optischer 3D-Messtechnik. In: Luh- sensors. IEEE International Systems Conference.
mann/Schumacher (eds.): Photogrammetrie, Laserscanning,
Optische 3D-Messtechnik – Beiträge der 16. Oldenburger 3D- Luhmann, T., Robson, S., Kyle, S., & Boehm, J., 2020: Close-
Tage. Range Photogrammetry and 3D Imaging. Berlin, Boston: De
 Gruyter. doi: https://doi.org/10.1515/9783110607253
Clarke, T.A., Katsimbris. A., 1994. The use of diode laser
collimators for targeting 3-D objects. International Archives of Mitka, B., Klapa, P., Gniadek, J., 2019: Use of Terrestrial Laser
Photogrammetry and Remote Sensing. Vol. 30. Part 5. pp. 47-54. Scanning for Measurements of Wind Power Stations. Geomatics
 and environmental Engineering.
Corten, G. B., 1996: Optical Motion Analysis of Wind Turbines. http://dx.doi.org/10.7494/geom.2019.13.1.39
European Union Wind Energy Conference, Goeteborg, Sweden.
 Özbek, M., 2013: Optical monitoring and operational modal
DIN, 2008: Safety of laser products - Part 1: Equipment analysis of large wind turbines. PhD thesis, Delft University of
classification and requirements (IEC 60825-1:2007). German Technology.
version EN 60825-1:2007.
 Paffenholz, J.-A., Vennegeerts, H., Kutterer H., 2008: High
Edzard, H., 2009: Rotorblatt für Windkraftanlagen, insbesondere Frequency Terrestrial Laser Scans for Monitoring Kinematic
für schwimmende Windkraftanlagen, sowie Windkraftanlage mit Processes. INGEO 2008 – 4th International Conference on
einem Rotorblatt http://www.patent- Engineering Surveying. Bratislava, Slovakia, October 23-24
de.com/20090212/DE102007036917A1.html (24 January 2020)
 Papadopoulos, K., Morfiadakis, E., Philippidis, T. P., Lekou, D.
Eric, V., Göring, M., Luhmann, T., 2017: Intensity of the J., 2000: Assessment of the strain gauge technique for
terrestrial laser scanning data: incident angle and surface measurement of wind turbine blade loads. Wind Energy, 3/1 35-
reflectance effects. In Luhmann/Schumacher (eds.): 65
Photogrammetrie, Laserscanning, Optische 3D-Messtechnik –
Beiträge der 16. Oldenburger 3D-Tage, Wichmann Verlag, PCO, 2020: Datenblatt pco.dimax cs.
Offenbach/Berlin, pp. 40-49 https://www.pco.de/fileadmin/user_upload/pco-
 product_sheets/pco.dimax_cs_data_sheet.pdf. (24 January 2020)
García Márquez, F. P., Tobias, A. M., Pinar Pérez, J. M., &
Papaelias, M., 2012: Condition monitoring of wind turbines: Schmidt Paulsen, U., Erne, O., Schmidt T., 2009: Wind Turbine
Techniques and methods. Renewable Energy, 46, 169-178. Operational and Emergency Stop Measurements Using Point
 Tracking Videogrammetry. In Conference proceedings. Bethel
Gikas V., Daskalakis S., 2009: Contribution of Combined RTS (US): SEM.
and TLS to Dynamic Monitoring of Wind Energy Turbines. 9th
Int. Conference on Optical 3-D Measurement Techniques, Schneemann, J. Rott, A., Doerenkaemper, M., Steinfeld, G.,
Vienna, Austria, July 1-3. Kuehn, M., 2020: Cluster wakes impact on a far-distant offshore
 wind farm’s power. Wind Energy Science.
GL, 2012. Rules for Classification and Construction – Industrial https://doi.org/10.5194/wes-5-29-2020
Services “Guideline for the Certification of Offshore Wind
Turbines”, Germanischer Lloyd WindEnergie GmbH, Edition Windcomp, 2020: Firma Windcomp GmbH.
2012, Hamburg, Germany. https://windcomp.jimdo.com/english/. (24 January 2020)

Goering, M., Luhmann, T., 2017: Entwicklung eines Winstroth, J., Schoen, L., Ernst, B. and Seume, J. R., 2014: Wind
fächerartigen Distanzmesssystems zur Messung von turbine rotor blade monitoring using digital image correlation:
Rotorblättern – Konzept, Orientierung und erste Ergebnisse. In: a comparison to aeroelastic simulations of a multi-megawatt
Luhmann/Schumacher (eds.): Photogrammetrie, Laserscanning, wind turbine. In Journal of Physics: Conference Series (Vol. 524,
Optische 3D-Messtechnik – Beiträge der 16. Oldenburger 3D- No. 1, p. 012064). IOP Publishing.
Tage.
 Winstroth, J., Seume, J.R., 2015: Error Assessment of Blade
Grosse-Schwiep, M., Piechel, J., Luhmann, T., 2013: Deformation Measurements on a Multi-Megawatt Wind Turbine
Measurement of Rotor Blade Deformations of Wind Energy based on Digital Image Correlation. Proceedings of the ASME
Converters with Laser Scanners. ISPRS Annals of the Turbo Expo 2015: Turbine Technical Conference and
Photogrammetry, Remote Sensing and Spatial Information Exposition. GT2015. June 15-19, 2015, Montréal, Canada
Sciences II-5/W2, 97-102.
 Z+F, 2020: Datenblatt Distanzmesser Z+F Imager 5006.
Hau, E. 2008: Windkraftanlagen - Grundlagen, Technik, Einsatz, https://www.zf-
Wirtschaftlichkeit. Springer laser.com/fileadmin/editor/Datenblaetter/Z_F_IMAGER_5006E
 X_Datasheet_E.pdf. (24 January 2020)
Jepping, C., Luhmann, T., 2016: Deformations from image
silhouettes using a kinematic finite element beam model.
International Archives of the Photogrammetry, Remote Sensing
and Spatial Information Sciences, Volume XL-1/W4, Prague,
Czech Republic.

Kim, Y.-K., Kim, Y., Jung, Y. S., Jang, I.G., Kim, K.-S., Kim,
S., Kwak, B.M., Kim, E.H., 2012: Developing a robust sensing

 This contribution has been peer-reviewed. The double-blind peer-review was conducted on the basis of the full paper.
 https://doi.org/10.5194/isprs-annals-V-2-2020-711-2020 | © Authors 2020. CC BY 4.0 License. 718
You can also read


