QUEEN ELIZABETH PARK PEATLAND SURVEY - DAVID MCQUEEN ENVIRONMENTAL SCIENCE DEPARTMENT - GREATER WELLINGTON ...
←
→
Page content transcription
If your browser does not render page correctly, please read the page content below
Queen Elizabeth Park peatland
survey

David McQueen
Environmental Science Department

For more information, contact the Greater Wellington Regional Council:

Wellington                   Masterton                                   GW/ESCI‐G‐21/36
PO Box 11646                 PO Box 41
                                                                         January 2022
T 04 384 5708                T 06 378 2484
F 04 385 6960                F 06 378 2146
                                                                         www.gw.govt.nz
www.gw.govt.nz               www.gw.govt.nz
                                                                         info@gw.govt.nz
Report prepared by:              D McQueen          Environmental
                                                    Monitoring Officer

Report reviewed by:              P Crisp            Team Leader, Land,
                                                    Ecology and Climate

Report approved for release      L Baker            Manager,
by:                                                 Environmental
                                                    Science                 Date: January 2022

DISCLAIMER
This report has been prepared by Environmental Science staff of Greater Wellington Regional Council
(GWRC) and as such does not constitute Council policy.
In preparing this report, the authors have used the best currently available data and have exercised all
reasonable skill and care in presenting and interpreting these data. Nevertheless, GWRC does not accept
any liability, whether direct, indirect, or consequential, arising out of the provision of the data and
associated information within this report. Furthermore, as GWRC endeavours to continuously improve data
quality, amendments to data included in, or used in the preparation of, this report may occur without
notice at any time.
GWRC requests that if excerpts or inferences are drawn from this report for further use, due care should be
taken to ensure the appropriate context is preserved and is accurately reflected and referenced in
subsequent written or verbal communications. Any use of the data and information enclosed in this report,
for example, by inclusion in a subsequent report or media release, should be accompanied by an
acknowledgement of the source.
The report may be cited as: McQueen D. 2021. Queen Elizabeth Park peatland survey. GW/ESCI‐G‐21/36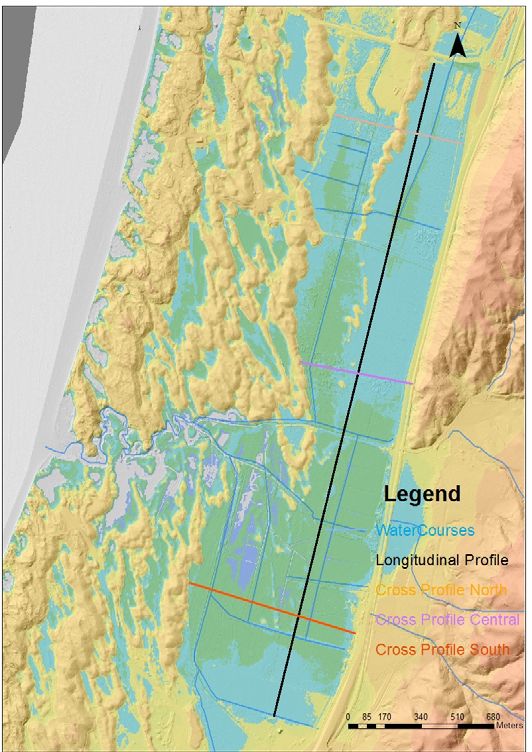
Summary
The key objective of this survey was to map the areal extent and volume of peat within
the largest peat area in Queen Elizabeth Regional Park. The condition of the peat soils
and the degree of changes that have occurred since the modification of the land for
agriculture were examined to address concerns about the potential to successfully
return the peatland to a functional wetland ecosystem. The peat deposits detailed in
this report were contained within Queen Elizabeth Park, a Regional Park on the Kapiti
Coast, administrated by Greater Wellington Regional Council. The peat deposits lie
between Paekakariki and Raumati South, bounded on the east by State Highway 1 and
the Main Trunk railway line, and bounded on the west by sand dunes laid down during
the Holocene epoch which have migrated inland following the marine regression post
6,500 BP.

The areal extent and depth of the peat deposits were assessed by probing at 100 m
intervals on a rectangular grid sampled across an area previously mapped as containing
peat. Soil characteristics were noted at each point and specific sites were revisited for
soil physical and chemical sampling, and to describe the soil profile. Soils were
subsequently classified and mapped. Acid Mesic and Mellow Humic Organic soils were
mapped interspersed with the peat soils, while buried peat and Hydric Soils (imperfectly
drained soils capable of supporting wetland vegetation) were identified adjacent to the
peat soils. Extensive areas of woody peat were encountered in the northern section of
the peatland suggesting the presence of an ancient swamp forest at one stage.

The organic soils, including the peat soils, were found to have been modified, with the
depths to the water table being in excess of 800 mm in parts of the peatland during
summer. Modifications included: increased bulk density due to consolidation, oxidation
of organic matter, and changes in pore size distribution. These modifications could lead
to less plant‐available water storage in the upper soil horizons, lower water contents
throughout the soil profile, and increased soil strength. Soil fertility and pH were higher
than for undisturbed peatlands, which could adversely affect the growth of native
wetland species.

The organic soils were deeper, less decomposed and less modified in the northern end
of the peat deposits. Overall, the organic soils have reacted to modification, becoming
more robust and resistant to further change, which has perhaps slowed further
decomposition. The effects of modification were concentrated at relatively shallow
depths, meaning that plants were still able to access deeper, less disturbed peat soil
horizons.

Soil water table solutions differed across the peatland, with higher nutrient
concentrations on the peatland boundary, declining into the centre of the peatland. As
with the soil structure, the soil water table solutions at the northern end of the peat
deposits showed less modification. Minimising the addition of nutrient‐enhanced water
would increase the range of wetland species that could be reintroduced.
Based on the state of the peat deposits, raising the water table and appropriate planting
should allow for the successful rehabilitation of the Queen Elizabeth Peatland. This could
allow modifications of the soil properties to be reverted and prevent the continuing
decomposition of the peat deposits that is releasing greenhouse gases into the
atmosphere. Furthermore, it is anticipated that rehabilitation of the peatland could lead
to the renewed accumulation of organic matter. Consequently, it is recommended that
the soil evolution and carbon sequestration be monitored along with the biodiversity to
quantify the value of the rehabilitation programme.
Contents
Summary                                                                       i

1.      Introduction                                                          1

2.      Background                                                            2
2.1     Peatland soils                                                        2
2.2     Soil development                                                      2
2.3     Soil deterioration                                                    3
2.4     Peatland restoration                                                  3
2.5     Previous studies                                                      4
2.6     Location                                                              4
2.7     Topography                                                            5
2.8     Watercourses                                                          9
2.9     Vegetation                                                            9

3.      Methods                                                              11
3.1     Extent and depth of peat deposits                                    11
3.2     Peatland condition                                                   12
3.2.1   Soil chemical and physical analyses                                  12
3.2.2   Soil and drain water chemistry analyses                              14
3.2.3   Soil field determinations of water characteristics                   15
3.2.4   Climatic information                                                 16
3.2.5   Soil description and mapping methodologies                           16

4.      Results                                                              17
4.1     Extent and depth of peat deposits                                    17
4.2     Peatland condition                                                   23
4.2.1   Soil chemical analyses                                               23
4.2.2   Soil physical analyses                                               24
4.2.3   Soil and drain water chemical analyses                               28
4.2.4   General soil water table properties and soil water quality – field
        sampling                                                             28
4.2.5   Soil water balance modelling and field water content                 30
4.2.6   Soil description and mapping                                         32
4.2.7   Soil mapping units identified                                        34

5.      Discussion                                                           38
Acknowledgements                                                             41
References                                                                   42
Appendix A: Soil and water quality sampling results                          44
Appendix B: Photographs of the Queen Elizabeth peatland survey site          50
Appendix C: Soil descriptions                                                58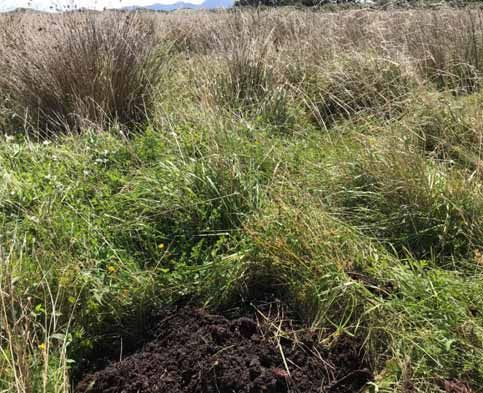
Queen Elizabeth Park peatland survey
1. Introduction
A survey of the major peatlands in Queen Elizabeth Park, Kapiti Coast was
conducted in February 2020 to provide information for a restoration project
that aimed to rehabilitate the peatland to restore its natural biodiversity and
function. To achieve this a number of factors need to be considered, including:
The growth media for wetland plants (including soil, water and other plant
substrates).
The hydrological regime required to facilitate the growth of wetland plants.
Control of pest plants and animals.
Re‐introduction of desirable plants and animals where these are not able
to reoccupy the restored environment without assistance.
The aim of this study was to investigate the state of the growth media,
particularly the soil, to support wetland plants in the areas with peat soils and
to assess its potential to support the restoration of the wetland’s biodiversity.
This was prompted by decades of modification of the peat soils by burning,
drainage and vegetation management. Restoring the function of the peatland
was also seen as an opportunity to address the potential for further loss of the
stored soil organic carbon and to encourage renewed carbon sequestration.
This required the baseline measurement of the areal extent and volume of
peat.
Page 1 of 63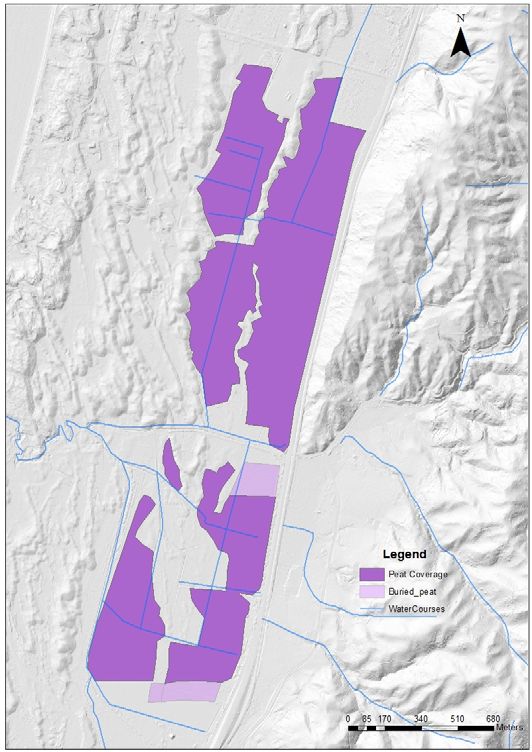
Queen Elizabeth Park peatland survey
2. Background
2.1 Peatland soils
Peat soils, which make up the vast majority of the area surveyed, are important
plant growth media. They can retain large amounts of water and organic matter
and are valuable but also vulnerable resources. Issues that need to be
considered include:
the possibility of irreversible drying i.e. water repellency,
changes to soil pore size‐distribution and water availability (as the volume
of soil available to store water can have implications for the soil water
balance and water deficits in organic soils),
changes in soil hydraulic conductivity (which may have implications for
drainage rates in the peatland), and
the degree of nutrient availability and pH changes (which have implications
for competiveness of wetland species and biodiversity).
2.2 Soil development
Peat soils develop when the rate of organic matter accumulation exceeds the
rate of decomposition by oxidation. Inundating a soil with water reduces the
availability of atmospheric oxygen to support oxidation. Assisted by acidic
conditions, vegetation deposited into peatlands resists decay, so accumulating
peat deposits. When peatlands are drained, the rate of oxidation typically rises
to exceed the rate of organic matter accumulation and their soils become
modified. Likewise, if the contribution of the vegetation to the organic
component of the soil is reduced, as typically happens with the conversion of
peatlands to grazing lands, the rate of oxidation can also exceed the rate of
organic matter accumulation. The peatland at Queen Elizabeth Regional Park
has been both drained and converted to grazing, so impacting on the peat
forming processes.
When considering the appropriate interventions for rehabilitation it is
important to understand the type of wetland. Each wetland type exists within
different sets of environmental parameters, supporting different species
assemblages that work together with the climate to determine the rate of
organic matter accumulation. Peatlands typically occur in bogs, fens and
swamps. Bogs are characterised by the water supply coming predominantly
from rainfall, but at the margins there may be influence of runoff and
groundwater. Fens receive their main water supply from rainfall, groundwater
and seepage from adjacent hillslopes. Swamps receive some water from
rainfall, but most comes from surface and groundwater. These different water
sources and flow rates influence the nutrient status and pH of the various
wetland types. Bogs typically have the lowest productivity, but accumulate the
highest proportion of organic matter due to higher stable water tables and
acidic conditions which, along with humic acids and phenolic compounds,
inhibit the rate of decomposition. In contrast, swamps have higher nutrient
inputs, higher productivity, less stable water tables and more basic conditions
leading to lower rates of organic matter accumulation (Johnson and Gerbeaux
Page 2 of 63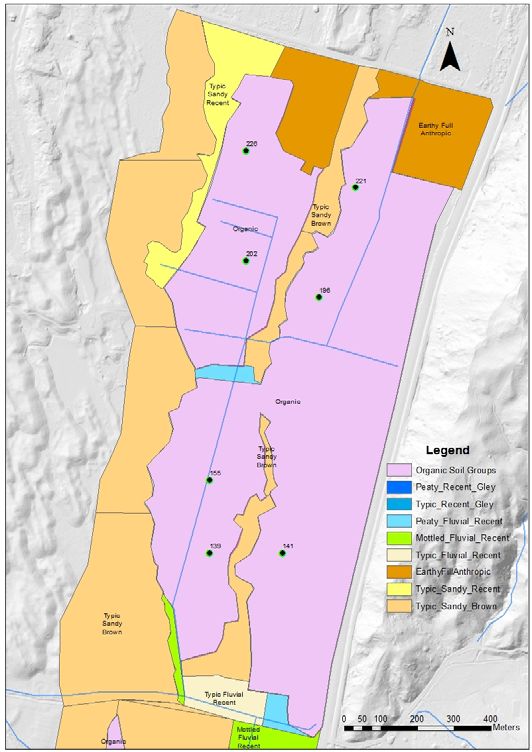
Queen Elizabeth Park peatland survey

      2004). Consequently, it is important to understand the type of wetland as this
      will influence its restoration approach.

2.3   Soil deterioration
      Peat soils are complex porous media with some pores not contributing to water
      and solute flow. The normal soil physical relationships between porosity and
      conductivity may not apply in peat soils, as horizontal conductivity may be
      higher than vertical leading to anisotropy (Rezanezhad et al 2016). As peat
      degrades, the pore size distribution also may shift to smaller pores further
      reducing lateral water movement, so acting as a stabilising element in reducing
      drainage rates so that drains may not be effective over long distances. However
      lower water tables lead to greater aeration resulting in greater peat
      degradation and reduction in peat surface elevation. Countering this is the
      capillary rise phenomenon where a soil moisture matric potential gradient can
      result in upward transport of soil water under slightly non‐saturated conditions
      which can result in reduced opportunity for drying and oxidation.

      Subsidence of the peat surface may also be the result of densification as a result
      of wetting and drying cycles. This increase in bulk density needs to be taken
      into account when carbon storage balances are made, as carbon needs to be
      accounted for on a mass per volume basis or mass per area basis. Peat
      decomposition and mineralisation resulting from drainage and fires release
      nutrients which may lead to new species such as introduced plants being more
      competitive in the peatland. Peat subsidence has been studied extensively in
      New Zealand with a study published by Pronger et al (2014) concentrating on
      peatland in the Waikato region. Rates of 19 mm per year were recorded which
      were significantly lower than initial rates. For optimum pasture production
      without excessive shrinkage, Bowler (1980) advocated maintaining the water
      table at 450mm but noted that water table depths below 300‐500mm
      increased subsidence markedly.

2.4   Peatland restoration
      In order to restore a wetland to as much as possible to original condition, a
      number of factors need to be considered as mentioned in the introduction.
      These include soils, water, wetland vegetation requirements and the
      hydrological regime. Techniques to achieve restoration in peatlands degraded
      by drainage often begin with blocking drains to reduce water flow out of the
      peatland. Nutrient availability may have increased due to mineralisation and
      farming practices. However retirement from agriculture and increased wetness
      should help stabilise these levels. Inflow of nutrients from surrounding land
      sources may result in continued nutrient input and diversion of these sources
      may be need as part of the restoration programme. It may not be possible to
      fully restore the peatland back to its original condition due to some of the
      factors mentioned above. However establishing a fully functional peatland with
      active peat formation and sequestering of carbon and establishment of wetland
      species is the ultimate goal of a restoration programme.

                                                                                       Page 3 of 63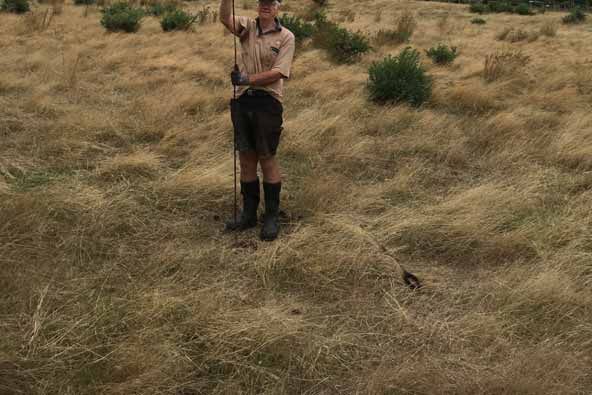
Queen Elizabeth Park peatland survey

2.5            Previous studies
               The major previous study of the peatlands in the eastern side of Queen
               Elizabeth Park was carried out by Neville Moar in 1951 (Moar 1954) A more
               general survey of areas to the north of the study area (Moar 1952) was carried
               out at the same time. Moar (1954) reported that the peatlands in what is now
               Queen Elizabeth Park had been heavily modified by farming activities including:
               burning, stump removal, drainage and vegetation modification. Farming in the
               Whareroa area began in the mid nineteenth century and has continued ever
               since that time. However by 1951, the drainage system in the northern part of
               the peatland was not maintained and areas were dominated by manuka with
               bracken in drier areas. In the southern section, introduced pasture grasses were
               more common.

               Moar conducted a series of peat corings from the northern to the southern end
               of the peatland and found that peat bodies were dominated by woody
               vegetation including swamp forest species overlying sedge components near
               the base of the peat profile. He found that peat depths were shallower south
               of Whareroa Stream, North Branch and that woody peat was not common in
               this southern section. The pollen samples collected at the same time have been
               recently analysed by Wilmeshurst and Bolstridge (2019) and provide a
               comprehensive picture of forest and wetland specialist plants including
               Sphagnum and Cyperaceae species.

2.6            Location
               The study area is located within Queen Elizabeth Regional Park with the area
               bounded by the Kapiti Expressway on the east and coastal sand dunes on the
               west. It extends from Mackays Crossing in the south to Poplar Avenue in
               Raumati South in the north. It is the largest contiguous area of peatland in the
               park. The area in question extends west from the coastal cliffs last developed
               at the end of the marine transgression 6500 years BP to the present day dune
               system behind the current coastline. During the marine transgression, wave
               energy eroded the coastline forming a sea cliff. This sea cliff provides a marker
               line, against which the late Holocene sediments of the coast have accumulated.
               Indications are that there has been uplift during the Holocene at the southern
               end as evidenced by the Te Pari Pari cliffs and subsidence north at Peka Peka
               area (McFadgen 2010) with little change at Paraparumu Airport. The peatland
               area would have been therefore subject to some uplift. A tsunami may have
               affected the area in the 15th century and pumice deposits which occur in the
               area may be from Taupo 1764 BP (Before Present) or Waimihia eruption 3550
               BP, both from the Taupo volcanic centre. Coastal dunes developed after the
               marine transgression and a series of dune systems moved inland until they
               stabilised leaving a low lying area between the dunes and the coastal cliffs
               where peat could accumulate. Wood fibres from Wainui Stream to the south of
               the peatland area were dated 2337 ± 22 BP. (Fleming 1972). The Ohariu fault
               runs through area with the last movement in 1050‐1000 BP with return period
               of 6,500 years.

Page 4 of 63
Queen Elizabeth Park peatland survey
2.7 Topography
The elevation of the peatland area between seven to five meter contours in
metres above mean sea level is shown in Figure 2.1. There is a very gradual
decline from north to the stream running east to west that bisects the peatland.
This stream which has been channelized takes water from across the Kapiti
Expressway and Waterfall Road Catchment and is often referred to as Waterfall
Stream. However it is also referred to as Whareroa Stream and has been
gazetted as such. In the southern part of the peatland there is a slight rise in
elevation, but at the western edge there are areas below 4.5m above mean sea
level (asml). The major drainage channel here on the western side is also
referred to as Whareroa Stream. To clarify nomenclature the report will refer
to the major watercourses as Whareroa Stream North Branch and Whareroa
Stream South Branch.
In Figure 2.1, the elevation of surface of land is given in metres above mean sea
level (amsl), while major streams and drainage ditches are shown in blue.
Whareroa Stream North Branch is the channelized watercourse running east‐
west in the centre of the figure from Waterfall Road to the confluence with
Whareroa Stream South Branch which is the major south‐western watercourse.
A DEM (Digital elevation Model) was used to generate relief profiles of the
peatland surface. Profiles from the DEM of QE Park with locations are shown in
Figure 2.2. The lines of the profile are shown in black on the map and the
longitudinal elevation profiles detailed in Figures 2.3, 2.4, 2.5 and 2.6. What is
noticeable is the relative lack of variation in elevation. Most of the major
changes are cultural features i.e. drains and causeways. There is a decline south
of the North Branch of Whareroa Stream but this is soon restored to the
previous elevation (Figure 2.3).
Page 5 of 63Queen Elizabeth Park peatland survey
Figure 2.1: Topography of a section of Queen Elizabeth Regional Park which
includes the peatland
Page 6 of 63Queen Elizabeth Park peatland survey
Figure 2.2: Relief profile locations Queen Elizabeth Regional Park derived
from digital elevation model (DEM)
Page 7 of 63Queen Elizabeth Park peatland survey
Figure 2.3: Longitudinal elevation profile of Queen Elizabeth Regional Park peatland,
horizontal units in metres. Relative elevation is in cm.
There is little more variation in the western peatland before the sand ridge at
300‐320m (Figure 2.4). East of that feature, the main changes are due to drains.
There is very little variation in the central zone (Figure 2.5). A deeper drain
feature is noted at the western end and then little change until the edge of the
expressway in the east is reached. A similar pattern was found in the southern
Cross Profile, (Figure 2.6).
Cross Profile 1 N area
220
Relative elevation cm
200
180
160
140
120
100
0 20 40 60 80 100 120 140 160 180 200 220 240 260 280 300 320 340 360 380 400 420 440 460 480 500 520 540 560 580 600 620
Distance m W -E
Profile Graph Subtitle
Figure 2.4: Cross Profile North, Queen Elizabeth Regional Park peatland
Relief Profile 2 Mid Area
R e la tive E le va tio n cm
200
180
160
140
120
0 20 40 60 80 100 120 140 160 180 200 220 240 260 280 300 320 340 360 380 400 420 440 460 480 500 520
Distance W -E m
Profile Graph Subtitle
Figure 2.5: Cross Profile Central zone, Queen Elizabeth Regional Park peatland
Page 8 of 63Queen Elizabeth Park peatland survey
Cross Relief Profile S
R e la tiv e e l e v a ti o n c m
220
200
180
160
140
120
0 50 100 150 200 250 300 350 400 450 500 550 600 650 700 750 800 850
Distance m W - E
Cross Relief Profile S
Figure 2.6: Cross Profile South, Queen Elizabeth Regional Park peatland
2.8 Watercourses
The main water courses that pass through the peatlands have been modified
and deepened, as mentioned in Section 2.6. Drainage ditches have been
connected to these channels as shown in Figure 2.1. A major drain termed
North Whareroa Drain runs from north of Poplar Avenue and terminates at the
Whareroa Stream North Branch before the confluence of the two branches
with the stream then meandering through the coastal dunes to discharge into
the Tasman Sea. These streams and drains being entrenched are less likely to
bring water and nutrients into the peatlands as in general peatlands have been
observed as gaining reaches of Kapiti Coast waterways while fan deposits
traversed by waterways are generally losing reaches. Gains are where water
flow into waterways and losses are where water flows from waterways into
surrounding land. Blocking or restricting any of these waterways is likely to have
a knock‐on effect in reducing hydraulic gradients and reducing flow rates from
peatland and hence water table fluctuations.
2.9 Vegetation
Vegetation has been discussed in other publications in detail so a general
overview only is given here. Although peatlands and wetlands can coincide, not
all peatlands are wetlands and not all wetlands are peatlands. Historic
vegetation coverage is provided by Moar (1954) where vegetation cover in
1951 is discussed and the northern area was dominated by Leptospermum
scoparium and Pteridium aquilinum. Gorse, Ulex europaeus, at that time was
absent. The southern area was dominated by pasture species.
Page 9 of 63Queen Elizabeth Park peatland survey
Currently the north eastern section of the peatland has common rush species
along with introduced grasses and gorse. Within this area, plantings of native
species including manuka (Leptospermum scoparium) and flax (Phormium
tenax) have been made. The north‐western area has a higher proportion of
gorse and introduced pasture species with over‐sowing with grasses and herbs
such as plantain. In terms of land management, low intensity grazing with
sheep and cattle has been practised but is currently being phased out. South of
North Branch Whareroa Stream, more intensive agriculture has been practised
with crops of brassicas and pasture renovation has also occurred extensively.
The abundance of Juncus species changes from north to south with the order
being Juncus pallidus, J. australis, J. effusus, Juncus edgariae with Juncus
sarophorus being more common in the southern section.
Page 10 of 63Queen Elizabeth Park peatland survey
3. Methods
3.1 Extent and depth of peat deposits
A probing survey was undertaken in February/March 2020 with a 245 hectare
grid being laid down over the area under investigation, extending beyond the
likely boundaries of the peatland. The grid extended 800 metres in an East to
West direction and 3.2 km in a West South West to North North East direction.
Site observations were made at 100 m intervals. Criteria for inclusion as
peatland included predominately organic soil horizons in the 0‐60 cm depth
range thus meeting the definition of Organic soil (i.e. 30 cm or more in the
upper 60 cm consisting of Organic soil horizons) (Hewitt 2010). If peat was first
encountered below 60 cm or organic matter levels did not meet criteria above
that depth, then the point was not classified as peatland. Hence a number of
peaty and hydromorphic soils were not included in the area total for organic
soils although they are potential wetland and carbon sequestering sites and will
be identified in the final soil map of the area.
An initial drilling down to 1.2 m was carried out by using a Dutch clay auger of
65 mm diameter, and soil horizons as well as presence of wood were noted.
This drilling was followed by probing using a 10 mm diameter aluminium probe
in one metre sections which could be extended by screwing additional sections
together. This was inserted until it meet total resistance. Maximum peat depth
reached exceeded 3.6 m. The presence of wood during probing was indicated
by hollow thumping impact, sand by rasping impact on rotation and silt by dull
thumping impact. When wood was encountered the probe was withdrawn and
reinserted nearby. If after multiple attempts wood was still encountered the
maximum depth reached was recorded and a note made. The presence of wood
in the soil profile was added to a spreadsheet on a three point scale, using 0 for
no wood encountered, 1 for some wood encountered but probing to bottom
continued and 2 where so much wood was encountered that probing
underestimated total depth (Figure 3.1).
Page 11 of 63Queen Elizabeth Park peatland survey
Figure 3.1: Grid locations of regular points for peat probing survey, probing
points are at 100 m intervals, resulting in one probe point per hectare
3.2 Peatland condition
3.2.1 Soil chemical and physical analyses
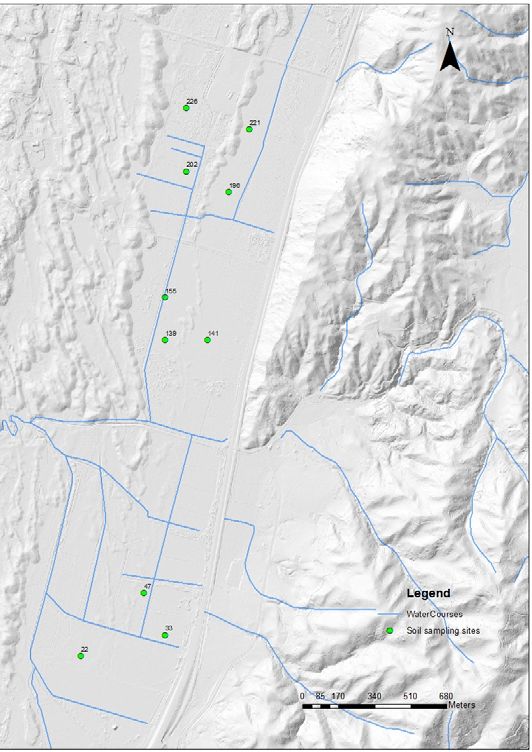
Soil samples were collected for chemical and physical analyses at seven sites
(33, 22, 47, 139, 155, 221 and 226) (Figure 3.2). Some sites were also used for
soil profiles as detailed in Section 3.2.5.
Page 12 of 63Queen Elizabeth Park peatland survey
Figure 3.2: Soil sampling and soil profile
Soil chemical analyses were undertaken by Manaaki Whenua Landcare
Research to determine soil pH, electrical conductivity, organic carbon%, total
nitrogen, Kjeldahl phosphorus and Olsen available phosphorus. Details of
methodologies and literature sources may be found on the Manaaki Whenua
Landcare Research website for environmental chemistry. Methods for soil
physical analyses carried out by Manaaki Whenua Landcare Research including
bulk density, particle density, moisture release characteristics followed
Page 13 of 63Queen Elizabeth Park peatland survey
Gradwell (1973). Manaaki Whenua Landcare Research terminology and
definitions for these physical analyses followed McQueen (1993).
3.2.2 Soil and drain water chemistry analyses
Soil and drain water samples were taken from four sites across the peatland.
Soil groundwater was extracted after purging from bores BP32/0117,
BP32/0119 (Figure 3.3). A groundwater sample was also taken the Northern
Whareroa Drain and from bore R26/6503 (a bore slightly to the south of the
peatland).
Figure 3.3: Location of piezometers in north‐eastern section of peatland and
sites where groundwater samples were collected
Water chemistry methods for analyses were carried out by Hill Laboratories
Hamilton with details of analytical method used being included in Appendix A.
Page 14 of 63Queen Elizabeth Park peatland survey
3.2.3 Soil field determinations of water characteristics
Field determinations of water characteristics: pH, electrical conductivity,
temperature, dissolved oxygen and oxygen reduction potential were made with
a YSI Pro Plus multi‐probe. Calibration of the instrument followed NEMS
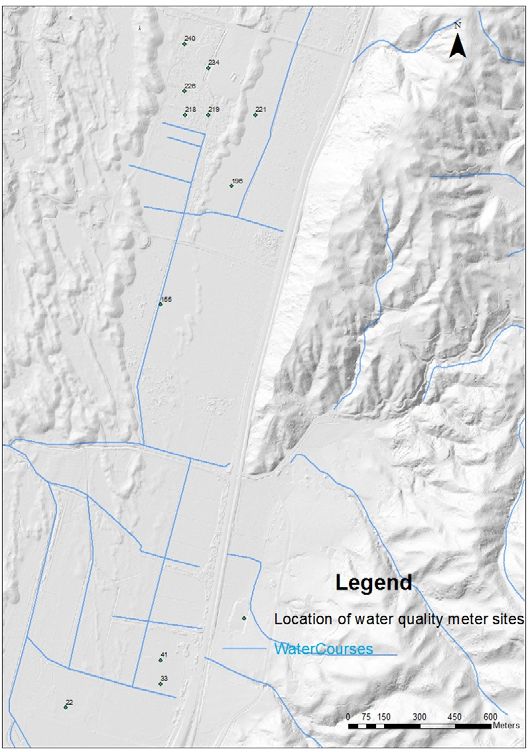
protocols (NEMS 2019). Eleven sites were sampled as shown in Figure 3.4.
Figure 3.4: Sites where general soil water table properties and soil water
quality were measured
Page 15 of 63Queen Elizabeth Park peatland survey
3.2.4 Climatic information
Climatic information was used to construct a water balance at Queen Elizabeth
Park. The factors of ET (evapotranspiration) and rainfall can be extrapolated
from the nearest comprehensive climatic station at Paraparaumu Airport
(NIWA data).
3.2.5 Soil description and mapping methodologies
Ten of the grid sites were selected for detailed soil descriptions and sampling
within the peatland (Figure 3.2). Profiles were exposed by digging a profile face
down to the water table if present. Auger descriptions extended down to a
maximum of 120 cm using a 65 mm diameter Dutch clay auger. Description
terms followed Soil Description handbook (Milne et al 1995) while soil
classification followed the NZ Soil Classification (Hewitt 2010). All sites were on
very gently sloping peatland. Organic soil horizons were defined using criteria
from Hewitt (2010) including at least one of the following; >18% total Carbon,
31% Organic matter, unrubbed fibre >20% and soil colour value 4 or less if dry
and 3 or less if wet. The distinction between acidic and mellow Organic
subgroups in the NZ soil classification is based on a soil profile pH of < or > than
4.5. The distinction between humic, mesic and fibric groups is based on the
degree of decomposition of the peat material with humic showing the greatest
decomposition. Fibre tests followed Milne et al 1995 (p 151) and von Post
assessment (op. cit. p.54). Soil mapping was based on the interpretation of
profile classifications from soil pits and auger observations to construct soil
mapping units which may contain minor areas of other soil types which could
not be displayed on the final soil maps. Photographs associated with the Queen
Elizabeth peatland site are shown in Appendix B.
Page 16 of 63Queen Elizabeth Park peatland survey
4. Results
4.1 Extent and depth of peat deposits
The peat depths encountered north of Waterfall Stream (North Branch of
Whareroa Stream) are shown in Figure 4.1, while peat depths south of
Waterfall Stream (North Branch of Whareroa Stream) are displayed in Figure
4.2. The pattern is summarised in Figure 4.3 where peat contours are displayed.
Peat was present up to the 3.5 m depth interval, as averaged by the contouring
process. The deeper peat deposits occurred in the northern eastern part of the
peatland closer to the Holocene relic coastal cliffs. The peat deposits were
generally shallower to the west where they lay between sand dune ridges and
also shallower to the south. There were occasional deeper peat deposits in the
southern area as well, again mainly on the eastern side. While most of the
western side was delineated by the presence of sand dunes, in the central zone
where North Branch of Whareroa Stream exists the eastern hill country,
deposition of sediment overlaid possible extensive areas of peat.
The extent of peat coverage as well as buried peat that could be identified by
augering and probing is shown in Figure 4.4. Buried peat could not identified if
the surface layer of mineral sediment was greater than 1.2 m. At the southern
edge of the peatland, the same pattern of deposition of more recent sediment
from the Whareroa Stream had created the same pattern of buried peat
underneath a mineral soil. One hundred and eleven of the grid points met the
peat criteria described above, with an average peat depth of 2.4 m and an
estimated volume of 2,639,580 m3.
The presence of wood in the peat profiles is shown in Figure 4.5. Wood was
much more common in the northern area and concentrated in the area of
deeper peats. Wood was encountered at a range of depths including tree
stumps located at the current peat surface.
Page 17 of 63Queen Elizabeth Park peatland survey
Figure 4.1: Peat depths north of Waterfall Stream (aka North Branch
Whareroa Stream) measured by probing survey
Page 18 of 63Queen Elizabeth Park peatland survey
Figure 4.2: Peat depths north of Waterfall Stream (aka North Branch
Whareroa Stream) measured by probing survey. North Branch Whareroa
Stream runs east to west at top of figure.
Page 19 of 63Queen Elizabeth Park peatland survey
Figure 4.3: Peat depth contours (mm) in the peatland survey area of Queen
Elizabeth Regional Park
Page 20 of 63Queen Elizabeth Park peatland survey
Figure 4.4: Extent of peat deposits within surveyed area, Queen Elizabeth
Park. Buried peat occurs where the upper 600 mm of the soil profile is
predominately mineral material
Page 21 of 63Queen Elizabeth Park peatland survey
Figure 4.5: Wood detected in peat profile during probing. 0 = no wood, 1 =
some wood and 2 = a high concentration of wood
Page 22 of 63Queen Elizabeth Park peatland survey
4.2 Peatland condition
4.2.1 Soil chemical analyses
Soil chemical analyses were undertaken at seven of the sampling points (33, 22,
47, 139, 155, 221 and 226) (Figure 3.2, Table 4.1). Three sampling sites located
in the southern section of the peatland (south of Whareroa Stream) had higher
pH levels than those normally associated with bogs, which typically range
between pH 3 and 4.8 (Johnson and Gerbeaux 2004). When the pH average
throughout the active soil profile is less than 4.5, the soil is assigned to an acid
subgroup. Topsoil samples with the exception of site 226 are equal to or greater
than pH 4.5. There was also a considerable decline in pH recorded between the
upper and lower profile horizons. Horizons below 250 to 400 mm depth
frequently had pH in the 3 to 4 range.
Table 4.1: Soil chemistry analyses at selected sites in the peatland
Site and Depth Total Kjeldahl Olsen P
pH Subgroup C% Total N (%) C/N
(mm) P (%) (mg/kg)
33 0‐200 5.1 13.4 1.10 12 0.180 26
Mellow
200‐400 4.9 12.4 0.98 13 0.160 21
22 50‐250 4.8 8.37 0.71 12 0.100 11
250‐540 4.4 Mellow 27.7 1.44 19 0.102 22
1200 34 0.99 35
47 0‐180 5.0 13.5 1.07 13 0.153 24
310‐430 4.7 Mellow 18.3 1.02 18 0.109 22
430‐700 4.1 44.1 1.87 24 0.070 16
139 40‐240 4.9 35.6 1.30 27 0.069 15
240‐600 3.7 Acid 63.7 0.87 73 0.013 82
1100‐1200 51.9 1.06 49
155 100‐400 4.5 43.8 1.58 28 0.071 14
Acid
400‐540+ 3.6 55.0 1.25 44 0.024 23
221 0‐110 5.1 52.3 1.73 30 0.063 6
110‐250+ 4.4 Acid 60.6 1.15 53 0.026 17
800‐1000 62.1 0.86 72
226 0‐200 4 47.7 1.80 27 0.078 22
Acid
1000 57.5 1.28 45
The C/N ratio can be seen as an index of the degree of decomposition and the
availability of N. Ratios of greater than 40 would be favourable for low nutrient
demanding species. The data showed that this was not achieved in the southern
sites (33, 22 and 47), but the northern sites (139, 155, 221 and 226) had higher
C/N ratios. Olsen P values indicate that the southern sites had higher than
desirable Olsen P levels, while the northern sites showed lower Olsen P levels.
Page 23 of 63Queen Elizabeth Park peatland survey
Total Kjeldahl P values were also significantly higher in the southern areas but
showed more consistency than Olsen P measures.
4.2.2 Soil physical analyses
The results of soil physical analyses completed on samples taken from nine
sampling sites are shown in Table 4.2, with the locations of those sampling
points shown in Figure 3.2. The physical properties of soil profiles in the
southern part of the peatland area; sites 22, 33 and 47 show different
characteristics to the more northern sites. The soil particle density values at the
southern sites tend to be greater than 1.75 t/m3 indicating notable mineral
addition to most soil horizons. However total porosity still remains high and the
predominance of organic matter content contributes to high total available
water capacity and moderately low bulk density. The northern sites have lower
particle densities more characteristic of pure peats being in the range 1.4 to 1.7
t/m3 (Yulianto et al. 2019).
Peat soils normally have a wide distribution of pore sizes. These vary from very
large pores which drain at only ‐1 kPa to pores which drain at between ‐100 and
‐1500 kPa and provide water to plants after more easily drained water has been
removed (McQueen1993). Soil shrinkage can occur in peatland where the
topsoil has been exposed to drying as has occurred at Queen Elizabeth Park. A
shrinkage test of the soil cores obtained from the sample sites indicated that
the samples outlined in green in Table 4.2 and Figure 4.6 showed the greatest
shrinkage. These were Site 139 24‐60 cm depth, Site 202 28‐54 cm depth and
Site 141 19‐45 cm depth. Relatively pure undisturbed peats normally show
shrinkage on drying and this is evident in Queen Elizabeth Park peat soils.
Figure 4.6: Soil cores from 2020 sampling – the ring in the foreground
indicates the original volume of soil
Page 24 of 63Queen Elizabeth Park peatland survey
Table 4.2: Physical properties of soils sampled
Client Horizon Sample C % w/w C%v/v Initial Initial Initial Dry Bulk Particle Total VLP Macro Air Vol. WC Vol. WC Vol. WC Vol. WC Vol. WC Vol. WC Vol. WC Readily Total Visual assessment of
ID Depth Depth Water Water water Density Density Porosity 0‐‐1kPa Porosity Filled 1 kPa 5kPa 10kPa 20kPa 40kPa 100kPa 1500kPa Available Available ShrinkagePAW HardeningPR
Content Content Pot "Saturation" 0 to ‐5kPa Porosity Field Stress Wilting Water Water mm MPa
0 to ‐ 10kPa Capacity Point Point ‐10 to 10010 to 1500
3 3
(%, w/w) % v/v kPa (t/m ) (t/m ) (%, v/v) (%, v/v) (%, v/v) (%, v/v) (%, v/v) (%, v/v) (%, v/v) (%, v/v) (%, v/v) (%, v/v) (%, v/v) (%, v/v) (%, v/v)
(cm) (cm)
Site 33 0‐20 13.4 4.8 191.1 68.8 3.0 0.36 2.19 83.8 12.8 21.2 26.4 71.0 62.5 57.3 53.5 49.7 45.2 21.4 12.2 35.9 med 0.2
Site 33 20‐40 12.4 6.2 139.2 69.6 100 0.83 2.32 64.3 4.8 11.9 15.4 59.5 52.4 48.9 47.1 45.2 42.3 33.7 6.6 15.2 low hardened 2.5 reasonably mineral cont
18‐33 hardened Blocks used for rewetting
Site 47 31‐43 34‐40 18.3 12.4 52.5 35.7 >100 0.68 2.26 69.7 12.0 20.4 24.0 57.7 49.3 45.7 43.4 41.8 39.9 34.4 5.8 11.3 low v low 101 not harde 0.4
Site 47 43‐70 56‐63 44.1 11.5 159.5 41.5 80.0 0.26 1.72 84.7 19.0 30.8 35.9 65.7 53.8 48.8 45.6 43.5 40.8 32.0 7.9 16.7 med 0.4
0.0
Site 139 4‐24 35.6 17.8 40.5 20.3 >1500 0.50 1.71 70.6 17.3 25.6 32.2 53.3 45.0 38.4 34.2 31.4 28.3 21.6 10.1 16.8 med low 185 quite firm 1.4
Site 139 24‐60 63.7 13.4 323.4 67.9 20.0 0.21 1.40 85.1 8.8 13.9 16.2 76.3 71.2 68.8 67.2 65.4 63.5 28.6 5.3 40.2 high 0.4
Site 139 110‐120 51.9 10.4 0.2
Site 141 4‐19 30 14.7 98.6 48.3 >100 0.49 1.73 71.8 1.6 5.0 13.2 70.2 66.7 58.6 55.4 51.9 49.2 30.8 9.4 27.8 low 251 1.4
Site 141 19‐45 60 10.2 416.2 70.8 10.0 0.17 1.48 88.2 7.0 15.7 18.1 81.2 72.5 70.2 68.4 67.3 65.9 22.0 4.3 48.2 high 0.2
Site 141 110‐120 64.3 10.9 0.0 0.17
Site 155 0‐10 0.0 1.1
Site 155 10‐40 43.8 17.5 61 24.4 0.4 some hard 1.8
Site 155 40‐54 55 11.0 371 74.2 0.2 0.5
0.0
Site 202 0‐23 7‐14 50 21.5 47.5 20.4 >1500 0.43 1.58 72.6 28.6 32.0 36.7 44.0 40.6 37.5 35.5 34.2 31.2 25.7 4.7 10.1 med 175 some hard 1.5
Site 202 28‐54 37‐44 55 12.7 303.1 69.7 15.0 0.23 1.47 84.0 8.0 10.4 12.6 76.0 73.6 71.5 69.1 66.2 63.7 30.4 7.8 41.0 high 0.4
Site 202 110‐120 59.9 12.0 0.0 0.20
Site 221 0‐11 52.3 19.4 135.5 50.1 30.0 0.37 1.59 77.0 13.2 19.0 25.8 63.8 58.0 51.2 50.4 49.0 48.2 23.3 2.9 27.8 low 136 few hard g 1.2
Site 221 11‐25 60.6 14.5 142.1 34.1 >100 0.24 1.43 83.3 30.5 40.5 44.1 52.8 42.8 39.2 37.6 36.4 35.2 29.1 4.1 10.1 med ‐low 1.1
Site 221 80‐100 62.1 12.4 0.0 0.20
Site 226 0‐20 47.7 16.4 230.0 78.9 0.34 0.7
Site 226 100 58 11.5 0.20 ng 0.2t/m3 for density at depth based on measured at site 22
Macro‐porosity cited here is determined between total porosity and tension of ‐5 kPa, for consistency with the National Soils Database of New Zealand (NSD).
PAW based on extrapolation to upper 600mm of soil profile
Page 25 of 63Queen Elizabeth Park peatland survey
There were no consistent changes in overall porosity in the affected horizons,
but an increase in large pores can be at the expense of fine pores which are
used to store plant available water. The shift in pore size distribution is contrary
to what is normally expected with wetting/ drying cycles and densification
reported in the literature where large pores are disproportionally lost.
Additional physical changes have been identified in the surface peat horizons
which are subject to long term wetting and drying cycles. These include
relatively high penetration resistance levels for an organic horizon, with the
formation of large, stable, very firm clods. Penetration resistances are high in
these clods in the range of limiting root distributions. However roots appear to
be able to descend to deeper less restrictive horizons by exploiting gaps
between clods. In an experiment, a hardened clod from Site 47 depth 18‐33 cm
(bulk density 0.878 t/m3) was submerged in water for over 4 weeks. Initial
water content was 20% v/v, i.e. below wilting point. After removal from
container the clods were still very firm but water content had risen to 36% v/v
which was in the range of readily available water for similar horizons. This
recovery of water content is encouraging for eventual rewetting of modified
peat soil horizons
Water conductivity is also reported to be reduced as a result of wetting and
drying cycles. There were no conductivity measurements made on these
surface horizons but it may be that these pores are not continuous as compared
to biopores which frequently extend through soil horizons. Biopores often are
large >750µm pores also referred to as K‐40 pores (McQueen 1993) which drain
at less than ‐0.4 kPa. These are within the range of the Very Large Pores 0‐1.0
kPa which were found to have also greatly increased in the pore size shifted
horizons. K‐40 unsaturated hydraulic conductivity is the water flow through all
the pores < 750µm.
Biopores are good conductors of water but there is no evidence that these new
large pores will function in the same way. They have been formed in a different
process and whether they are connected has not been established. In general
these changes occur in surface horizons, one subsoil horizon at Site 47 depth
43‐70 cm shows significant pore size shift but this is a shallow peat profile 70
cm deep with lower water contents throughout the profile. The horizon in
question has lower particle density of 1.72 t/m3 so belongs in the purer peat
category.
Peat soils are often moist to near the soil surface even if the water table has
been lowered. Capillary rise occurs when moisture is wicked up by surface
tension above a water table. Capillary rise may be an important additional
source of moisture to peat soils during periods of moisture stress. Nugraha et
al. (2016) report rises of up to 50 cm in peat soils with height of rise being
affected by bulk density and pore size distribution. The sites where capillary rise
behaviour are summarised below and grouped by whether or not high
contrasts were observed in water content were observed above and below the
capillary fringe boundary (Table 4.3).
Page 26 of 63Queen Elizabeth Park peatland survey
Table 4.3: Contrast in water content above and below the capillary fringe
boundary
High contrast sites
Site 155 Moisture difference across capillary rise boundary at 40 cm
depth is difference between 24 v/v% above and 74 v/v%
which is the same difference between ‐1500kPa and ‐5 kPa
with a water table depth at 54 cm
Site 221 Sharp capillary rise boundary at 25 cm with moisture levels ‐
100kPa to ‐1500kPa above boundary with profile description
is very moist to saturated below water table at 42 cm depth.
Site 202 Horizon less than 28 cm has pore size shift and field water
content >1500 kPa. Very moist in horizon at 28 to 54 cm,
water table estimated at around 100‐110 cm.
Low contrast sites
Site 226 Water table at 37cm at site where capillary rise zone
reaches 20 cm but very moist above capillary fringe
estimated at ‐1 kPa, so no evidence of sharp water change
across boundary. A capillary fringe boundary does not
always indicate absence of moist conditions above the
visually obvious line,
Site 33 Water table at 38 cm but no sharp capillary zone boundary
observed. Horizons above water table are at ‐1 and ‐3 kPa
matric potential, so very moist and close to saturation.
Where water tables were observed in the soil profile,
capillary rise zones were also commonly observed
In some cases there was a sharp drop in water content above the boundary,
but the sharp decrease in water content only occurred in horizons where soil
pore sizes distribution shift had occurred. These horizons may act as a barrier
to upward movement of capillary water. In cases where this was not observed
water table depths were also less than 38 cm. Upward fluxes of water which
are adequate to maintain plant growth have been found in peats in New
Zealand for at least 1 m above water table. (D. McQueen, pers com.).
Capillary rise is an important component in maintaining water content in the
peat soils of Queen Elizabeth Park. Where significant pore size redistribution
leads to an increase in large pores this upward movement of water is reduced.
This occurs however only in surface and near surface horizons and in sites
where water tables are the deepest. It is likely that plant roots are able to
penetrate into deeper horizons below 30 cm to obtain sufficient moisture and
with rising water tables into 25‐ 30 cm depth zones these horizons may be
rehabilitated through rehydration.
Page 27 of 63Queen Elizabeth Park peatland survey
4.2.3 Soil and drain water chemical analyses
The results of the groundwater and drain water sampling are shown in Table
4.4. The northern bore BP32/0117 water had very high levels of organic carbon,
nitrogen and phosphorus, which indicated a high level of biological activity.
Phosphorus was not limiting, with a N/P ratio of less than 10. Mineralised
nitrogen levels were relatively low, with a combined level of ammoniacal N and
nitrate N of 0.71 g/m³, compared to a non‐mineralised N level of 13.15 g/m³.
Most N was therefore in an organic form. Dissolved reactive phosphorus (DRP)
levels were high, again indicating an active metabolising system.
The North Whareroa Drain values for total N and P were high, with the drain
having a particularly high DRP value, a significant level of organic carbon and a
level of nitrate indicating a degree of aerobic behaviour. The majority of N was
biological however (3.76 g/m³). The pH in the drain was 3.9, a level of acidity
comparable to soil water pH levels. The more southern BP32/0119 site had
noticeably lower levels of P (some of which would have restricted biological
activity), with similar levels of N to the North Whareroa Drain. A greater
proportion of the mineralised N was in the ammoniacal form, indicating a less
aerobic environment.
Table 4.4: Groundwater and drain water chemical analyses of samples taken
May 2020
Total
Total Total Ammoniacal
Sample Ratio organic C/N DRP Nitrate
P N N
site N/P C (g/m³) (g/m³) (g/m³)
(g/m³) (g/m³) (g/m³)
(g/m³)
BP32/0117 2.00 13.86 6.93 225 16.2 0.4 0.25 0.31
North
Whareroa 0.91 5.39 5.92 155 28.8 0.4 0.84 1.76
Drain
BP32/0119 0.11 5.64 51.2 21 3.8 1.456Queen Elizabeth Park peatland survey
0.38 m. Soil water pH is relatively high and specific conductivity is low compared
to other sites, indicating that this site may be obtaining relatively fresh
groundwater possibly from hillside shallow groundwater and expressway
drainage. Site 226 in the north eastern corner of the peatland had comparable
autumn groundwater depth of 0.37m with soil water pH value of 3.73 and a
conductivity that was indicative of groundwater with noticeable peat influence.
This is possibly due to groundwater movement from peat areas north of Poplar
Avenue.
Acidity (pH) values at sites south of Nth Branch Whareroa Stream had an
average of 5, while in the northern area, the pH was below 4. Specific
conductivity was greater than 200 µS/cm in the northern area, while in the
southern area it was more variable with one value at site 22 being 853 µS/cm.
This latter site is the closest to the coast and the result may indicate a saline
influence on groundwater at this location. In terms of anaerobic status, the
dissolved oxygen levels were not particularly low but readings were taken from
recently disturbed excavated sites. Relatively high water conductivity values
are usually found in peat. ORP values were also not low but pH values less than
4 would have elevated the ORP levels. The presence of low pH levels in the
northern area indicate an environment more conducive to lower
decomposition of organic matter and beneficial to terrestrial wetland
vegetation species.
Table 4.5: Environmental indicators from water quality field meter sampling
at selected locations
Water table Cond
Site # E N Date depth m Temp 0C µS/cm O2% O2 ppm pH ORP
22 1766618 5463274 4/3/2020 0.7 18 853 87.1 8.22 5.1 155.2
33 1767018 5463374 18/2/2020 0.61
33 1767018 5463374 5/3/2020 0.38 16.1 166.1 4.7 0.47 4.93 155.4
41 1767018 5463474 18/2/2020 0.51
47 1766918 5463574 5/03/2020 0.67 16.4 292.9 10.1 1.01 5.08 171.9
155 1767018 5464974 7/5/2020 0.54 16.3 390 21.6 2.6 3.76 354.7
196 1767318 5465474 7/5/2020 0.46 15.5 279.4 28.9 2.89 3.62 374.8
218 1767120 5465774 20/2/2020 0.73 17.6 281 16 1.53 3.82 193.4
219 1767218 5465774 20/2/2020 0.46 14.7 221.3 34.1 3.47 3.68 338.6
221 1767418 5465774 8/5/2020 0.42 14.7 221.3 34.1 3.47 3.68 338.6
226 1767118 5465874 8/5/2020 0.37 14.9 312 10.9 1.11 3.73 127.0
226 1767118 5465874 20/2/2020 0.68
234 1767218 5465973 28/2/2020 0.82 17.1 206.5 14.2 1.37 4.11 225.3
Page 29 of 63Queen Elizabeth Park peatland survey
240 1767018 5466074 28/2/2020 0.55
In stream
by 240 28/2/2020 17.2 208.2 20.2 1.95 5.05 207.3
BP32/0117 1767458 5465820 28/2/2020 0.97
BP32/0119 1767459 5465571 19/2/2020 0.64
BP32/0121 1767396 5465181 19/2/2020 0.66
BP32/0122 1767396 5465181 19/2/2020 0.84
Average water table
depth for Feb March 0.611
10 sites St Dev 0.14
Average water table
depth for early May 0.45
4 sites St Dev 0.07
4.2.5 Soil water balance modelling and field water content
Climatic data obtained from the Paraparaumu Aero weather station, as detailed
in Section 3.2.4 are shown in Table 4.6 with soil water deficit for the last 10
years shown in mm. The average annual rainfall for the area is 1118 mm.
Table 4.6: Water deficit (mm) modelling results from Paraparaumu Aero
weather station
Year Jan Feb Mar Apr May Jun Jul Aug Sep Oct Nov Dec Annual
2010 82.3 122.4 127.3 120.5 73.1 3.8 1.1 1.7 2.6 15.1 83.3 106.2 61.6
2011 109.9 117.7 109.7 47.6 3.1 1 2.8 6.2 18.7 7.9 23.2 71.3 43.3
2012 73.1 106.7 63.3 86.8 53.8 7.3 2.8 1 8.2 27 81.5 103.1 51.2
2013 89.9 100.6 102.7 81.4 12.5 1.1 3 3.3 6.5 10.9 52.3 111.1 47.9
2014 104.7 129.2 127.7 99.1 12.4 2.4 3.4 4.4 18.1 35.5 85.6 71.7 57.9
2015 119.9 137.4 121 32.6 5.3 2.7 1.8 1.9 5.8 48.6 70.1 116.5 55.3
2017 106.2 89.5 62.7 9.9 1.1 4.9 1.2 1.8 3.3 29.6 107.7 141.6 46.6
2018 123.4 93.4 57 17.8 9.3 1.7 0.9 1.6 21.1 59.9 56.2 92.2 44.5
2019 127.5 140.6 105.8 72.4 47.2 1.1 1.1 4.4 21.1 20.1 36.9 51.8 52.5
Average 104.1 115.3 97.5 63.1 24.2 2.9 2.0 2.9 11.7 28.3 66.3 96.2 51.2
In the winter the soils maintain their water contents with very little loss but in
the summer months (December to March), there is a significant water loss. The
balance is based on the assumption that the soil profile in the upper 600 mm
can store 150 mm of water.
Page 30 of 63Queen Elizabeth Park peatland survey
A soil water balance model was run using the 10 years of monthly data from
Paraparaumu Airport, four km NW from Queen Elizabeth Park. The inputs to
the model were: rainfall data, ET (evapotranspiration) and profile soil water
capacity (PAW). The model output shows a water deficit if rainfall input is less
than the losses (Figure 4.7). The balance depends significantly on the degree of
soil water storage.
Figure 4.7: Monthly average Soil water deficit QE Park based on 150 mm
storage in 0‐600 mm depth range
Soil samples collected from Queen Elizabeth Park have been analysed to
establish their water holding capacity as this will have a major bearing on the
level of water deficit which is 4.6 % of annual rainfall. The results indicate that
the actual Profile Available Water of the peatland at Queen Elizabeth Park is
175 mm with a standard deviation of 47 mm as compared to NIWA assumed
value of 150 mm. Hence monthly deficits would be reduce from about 100 mm
in summer to 84 mm. If all the runoff was captured by preventing flow out of
the peatlands, there would be an average excess of 58 mm. This also ignores
any excess water entering through seepage from surrounding areas. In essence
this shows how finely balanced the water status of the peatland would be in
the absence of artificial drainage.
Table 4.7: Models of 2020 Water Deficit mm Paraparaumu Aero weather
station based on two PAW values (NIWA assumed value of 150 mm and
actual value of 175 mm)
Month January February March Apr May June
PAW 117.1 71.9 36.8 5.6 0.8 0
150mm
PAW 92 47 12 0 0 0
175mm
The values shown in Table 4.7 indicate that PAW Profile Available Water is only
6% below maximum in March and not reduced at all in May. So soil horizons
should be at Field Capacity (‐10 kPa) in May and at 94% of Field Capacity in
March. However surface and near surface horizons are considerably drier than
this, being at or below Wilting Point (‐1500kPa) in March, (see Table 4.2).
Page 31 of 63Queen Elizabeth Park peatland survey
In summary, the reduction in HAW (Horizon Available Water) for surface horizons
in the peatland reduces the average PAW for the soil profiles. Overall PAW is still
175 mm with standard deviation 47 mm in the upper 600 mm of the soil. This is
still significantly higher than the 150 mm used as an approximation in NIWA water
balance modelling and shows that even modified peat soils are still able to retain
substantial amounts of water. The major reductions in available water capacity
(AWC) are in the surface horizons but plant roots are able to bypass these areas
and extend deeper into the subsoil to extract water from less modified deeper
horizons. It is to be expected that water extraction would be greater in the surface
horizons due to abundant roots densities, however root concentrations are still
common in deeper horizons throughout the peat soil profiles.
4.2.6 Soil description and mapping
Soils in different parts of the peatland were able to be grouped according to the
degree of modification, whether or not organic horizons had become hardened,
and whether or not mineral matter additions had occurred. Hardening or
induration that was noticed in the upper organic soil horizons creates hard clods
that cannot be crushed. Examination by hand lens indicated that there were no
visible large biopores and that fine roots, if present, were restricted to the
surfaces between soil plates. Clods from profile site 47 were placed in water to
see what changes would occur. Clods submerged without difficulty, so were not
hydrophobic, however after several months the clods were still very firm. The dry
bulk density was determined to be 0.88 g/cm3, which is not high by mineral soil
standards but is very high for an organic soil. By comparison, a sample from 1200
mm depth in the same area, recovered from well below the permanent water
table, was little modified and had a dry bulk density of 0.197 g/cm3. Hence
densification has occurred but may be reversible in the long term with rewetting
and soil biological activity. Hardening tends to be restricted to the upper subsoil
less than 400 mm deep which is a zone above capillary rise in sites where summer
water tables are deeper and dryness is more common.
The key attributes of the peatland soils are summarised in Table 4.8. Peat
colour varied between blackish and reddish hues. In profiles where wood was
uncovered, the wood fragments were reddish so this was a likely source of the
peat colouration. The profiles from the southern zone of the peatland, i.e.
south of North Branch Whareroa Stream, all had blackish peat colours and this
coincided with very little wood being detected in the probing surveys from this
zone. Decomposition of the peat was more advanced, with most sites belonging
to the Humic Organic group. Peat depths also tend to be shallower than in the
more northern zones. Soil and soil water pH values were less acidic than in the
other areas. These features were consistent with peat decomposition rates
being higher in the southern zone.
It is not surprising that peat decomposition was more advanced in areas where
there was proximity to less acidic soil water and a greater availability of
nutrients from surrounding mineral soils. Organic horizon hardening occurred
in one site in this area. One exception was site 22 that had a cap of wet gleyed
Page 32 of 63Queen Elizabeth Park peatland survey
mineral soil which would have dampened fluctuations in soil moisture and so
reduce chances of hardening occurring.
In the central and northern zones, north of North Branch Whareroa Stream
there was a pattern of more reddish peat on the eastern side where wood was
more common in the profile and hardening only occured on the western side
where peat depths also tended to be shallower. Soil water acidity was also
higher in these western areas. The great majority of the soils in these areas
were classified as belonging to Mesic Organic group, indicating an intermediate
level of peat decomposition. Profiles that exhibit hardening of the organic
horizons only occurred in the western sites and were associated with the Humic
Organic group classification.
Table 4.8: Summary table of key Peatland Organic soil attributes
Site Classification Location Location Peat Horizon Water Comment
No. zone side Colours Hardened Table
mm
22 Mellow Humic South West Blackish See ‐700 Surface almost 30
comment cm of gley
mineral soil so no
organic
hardening.
33 Mellow Mesic South East Blackish No 380 Best wetland
vegetation
character of
profile sites, a
few hard granules
47 Mellow Humic South West Blackish Yes ‐ Some sand in
topsoil
139 Acid Mesic Central West Blackish No ‐900 Minor sand in
over topsoil
reddish
141 Mellow Mesic Central East Reddish No ‐ Minor sand in
topsoil
155 Acid Mesic Central West Reddish Yes ‐540 Minor sand in
over topsoil
blackish
196 Acid Mesic North East Blackish No ‐460 Minor sand in
over topsoil
reddish
202 Mellow Humic North West Reddish Yes ‐ No sand observed
over
blackish
221 Acid Mesic North East Reddish No ‐420 No sand observed
a few hard
granules
226 Acid Mesic North West Blackish No ‐370 Minor sand in
topsoil
Page 33 of 63You can also read