Recent atmospheric changes and future projections along the Saudi Arabian Red Sea Coast
←
→
Page content transcription
If your browser does not render page correctly, please read the page content below
www.nature.com/scientificreports
OPEN Recent atmospheric changes
and future projections
along the Saudi Arabian Red Sea
Coast
Abdulhakim Bawadekji1*, Kareem Tonbol2*, Nejib Ghazouani3, Nidhal Becheikh3 &
Mohamed Shaltout4*
Recent and future climate diagrams (surface air temperature, surface relative humidity, surface
wind, and mean sea level pressure) for the Saudi Arabian Red Sea Coast are analysed based on hourly
observations (2016–2020) and hourly ERA5 data (1979–2020) with daily GFDL mini-ensemble means
(2006–2100). Moreover, GFDL mini-ensemble means are calculated based on the results of three
GFDL simulations (GFDL-CM3, GFDL-ESM2M, and GFDL-ESM2G). Observation data are employed to
describe the short-term current weather variability. However, ERA5 data are considered to study the
long-term current weather variability after bias removal via a comparison to observations. Finally, a
bias correction statistical model was developed by matching the cumulative distribution functions
(CDFs) of corrected ERA5 and mini-ensemble mean data over 15 years (2006–2020). The obtained
local statistic were used to statically downscale GFDL mini-ensemble means to study the future
uncertainty in the atmospheric parameters studied. There occurred significant spatial variability
across the study area, especially regarding the surface air temperature and relative humidity, based on
monthly analysis of both observation and ERA5 data. Moreover, the results indicated that the ERA5
data suitably describe Tabuk, Jeddah and Jizan weather conditions with a marked spatial variability.
The best performance of ERA5 surface air temperature and relative humidity (surface wind speed
and sea level pressure) data was detected in Tabuk (Jeddah). These data for the Saudi Arabian Red
Sea coast, 1979–2020, exhibit significant positive trends of the surface air temperature and surface
wind speed and significant negative trends of the relative humidity and sea level pressure. The GFDL
mini-ensemble mean projection result, up to 2100, contains a significant bias in the studied weather
parameters. This is partly attributed to the coarse GFDL resolution (2° × 2°). After bias removal, the
statistically downscaled simulations based on the GFDL mini-ensemble mean indicate that the climate
in the study area will experience significant changes with a large range of uncertainty according to the
considered scenario and regional variations.
The Saudi Arabian Red Sea Coast extends approximately 1800 km from north of Tabuk (28.75° N, 34.83° E) in
the north to south of Jizan (16.15° N, 42.75° E) in the south, as shown in Fig. 1. This coastal zone includes four
large cities, namely, Tabuk, Al Madinah, Jeddah and Jizan, and religious and historical sites, tourist resorts, fertile
agricultural lands, and economic resources, such as oil and gas resources, in addition to fishing activities. The
current study focuses on three sites along the Saudi Arabian Red Sea Coast: Tabuk in the north, Jeddah at the
centre and Jizan in the south.
Tabuk (28.365° N, 36.619° E), which is located in the northwestern region of Saudi Arabia at an elevation
of 760 m above mean sea level (Fig. 1), is classified as an agricultural area depending mostly on groundwater.
However, Jeddah (21.67° N, 39.15° E), which is the second largest city in the kingdom (Fig. 1), suffers from a
high population density and rapid urbanization. Thus, Jedda is considered vulnerable to climate change, and
frequent flooding is a current example1. Moreover, Jizan (16.9° N, 42.6° E), which is located in the southwest
1
College of Science, Northern Border University, Arar, Saudi Arabia. 2College of Maritime Transport
and Technology, Arab Academy for Science, Technology and Maritime Transport, Abu‑Qir, Alexandria,
Egypt. 3College of Engineering, Northern Border University, Arar, Saudi Arabia. 4Oceanography Department,
Faculty of Science,, Alexandria University, Alexandria, Egypt. *email: bawadekji@nbu.edu.sa; ktonbol@aast.edu;
mohamed.shaltot@alexu.edu.eg
Scientific Reports | (2022) 12:160 | https://doi.org/10.1038/s41598-021-04200-z 1
Vol.:(0123456789)
www.nature.com/scientificreports/
Figure 1. Digital elevation chart of the study area with the location of Tabuk (1), Jeddah (2) and Jizan (3)
weather observation stations. Math Works, Inc. MATLAB. Version 2020a, Math Works, Inc., 2020. www.mathw
orks.com.
corner of Saudi Arabia, is considered the richest agricultural region in Saudi Arabia. In addition, Jizan is projected
to experience damage resulting from projected warming trends in the f uture2.
According to3,4, Tabuk is considered a hyper-arid (extremely arid) zone, where the aridity index (annual
precipitation/potential evapotranspiration) is lower than 0.03. However, Jeddah and Jizan are considered arid
zones with aridity index values between 0.03 and 0.2. These values correspond to a notable diurnal temperature
cycle. In addition, according to the Köppen–Geiger climate classification, the Tabuk, Jeddah and Jizan climates
are classified as BWh climates (the main climate is arid, the precipitation type is the desert type, and the tem-
perature is high).
According to6, the annual average air temperatures (1978–2010) over Tabuk, Jeddah and Jizan reach 22.15 °C,
27.84 °C, and 30.64 °C, respectively. Almazroui et al.7 studied the mean annual temperature/rainfall throughout
Saudi Arabia based on 27 stationary (including Tabuk, Jeddah and Jizan) data observations from 1979 to 2009.
They reported that the annual mean surface air temperature (T2m) along the Saudi Arabian Red Sea Coast ranges
from 24 to 30 °C. Furthermore, A lmazroui8 simulated weather characteristics from 2001 to 2005 with the RegCM
model over the MENA CORDEX domain, including the study area. They determined that the simulated daily
average surface air temperature ranges from 18 to 21 °C in Tabuk and ranges from 21 to 30 °C in Jeddah and
Jizan. More recently, Azamathulla et al.9 employed four climate parameters (atmospheric pressure, wind speed,
relative humidity, and rainfall) to efficiently project the future air temperature in Tabuk by developing two dif-
ferent generic models: artificial neural network and gene expression programming models. Alrashed and A sif10
found that the annual climatic average air temperature over Jeddah reaches 27.9 °C.
According to11, the Arabian Peninsula experienced a warm trend of 0.055 °C d ecade−1 during the period
7
from 1879 to 1992. Moreover, Almazroui et al. observed that Saudi Arabia experienced a warming trend of
0.06 °C decade−1 during the 1978–2009 period.
Azamathulla et al.9 reported that the annual average wind speed (relative humidity) over Tabuk reached
5.5 m s−1 (32.9%) based on monthly average climate data from 1986 to 2015. However, Alrashed and A sif10
−1
determined that the annual climatic average wind speed (relative humidity) over Jeddah reached 2.3 m s (65%).
In addition, Nassar et al.12 stated that the relative humidity over Jizan ranged from 54% in July to 68.5% in
September.
Many researchers have indicated that the air temperature, wind field, relative humidity and atmospheric
pressure are the most important climate change measurements considering their direct effect on all life sectors.
Scientific Reports | (2022) 12:160 | https://doi.org/10.1038/s41598-021-04200-z 2
Vol:.(1234567890)
www.nature.com/scientificreports/
The air temperature is considered one of the most important climate factors, as the daily activities of people are
influenced by even a minor change in air t emperature13. According to Maia-Silva et al.14, relative humidity (RH;
calculated from the surface air and dew point temperatures) rise is one of the main climate challenges, as the
increase in surface air temperature is correlated with a decrease in relative humidity. This coupling effect can be
disastrous, especially during heat wave events. This may increase mortality/morbidity rates. However, wind fields
and the progress associated with wind technology may reduce CO2 emissions15. In general, changes in mean
sea level pressure (SLP) could impose a notable effect on climate because SLP controls atmospheric circulation.
Therefore, this factor influences wind, moisture movement, precipitation, and temperature variabilities.
In 2000, I PCC16 introduced the Special Report on Emissions Scenarios (SRES), covering a range of greenhouse
gas (GHG) emissions (A1B, A2, and B1 scenarios) under the Coupled Model Intercomparison Project, phase
three (CMIP3). Meehl et al.17 reported that based on the success of SRES scenarios, the IPCC elevated the CMIP3
to the CMIP5 in late 2008 and described new future scenarios (RCP2.6, RCP4.5, RCP6.0, and RCP8.5). These
new future RCP scenarios comprise various RCP combinations. RCP denotes the representative concentration
pathway, and the numbers indicate the assumed radiative forcing by the end of the twenty-first century.
The current research examines the current and future climate conditions along the Saudi Arabian Red Sea
Coast. First, observation data were employed to describe the current short-term weather variability from 2006
to 2020. Second, the current research qualifies the use of ERA5 data in capturing the surface air temperature
(T2m), relative humidity (RH), surface wind field and mean sea level pressure. Third, 42 years (1979–2020) of
ERA5 data after bias removal were analysed to describe the current long-term climate. Finally, the future climate
in the study area was projected via statistical analyses through the above four CMIP5 scenarios. The materials
and methods adopted are presented in “Results” section, the results and discussion are provided in “Discussion
and Conclusions” section, and the conclusions are outlined in “Future work” section.
Results
Observed data. Monthly time series. Monthly average time series for T2m, RH, WS10, and SLP based on
hourly observation data (2016–2020) for Tabuk, Jeddah and Jizan are shown in Fig. 2.
In Tabuk, the T2m data revealed that January 2020 (10.16 °C) is the coldest month, while July 2017 is the
warmest month (34.68 °C), as shown in Fig. 2a. Similarly, the RH data revealed that November 2018 exhibits
the maximum monthly RH mean value (50.25%), while May 2019 attains the lowest monthly RH mean value
(14.9%), as shown in Fig. 2b. In addition, the WS10 data revealed that June 2020 is the windiest month (4.6 m s–1),
while November 2017 is the calmest month (2.29 m s–1), as shown in Fig. 2c. Generally, the SLP data revealed
that January 2016 attains the maximum monthly SLP value (1019.33 hPa), while July 2020 exhibits the lowest
SLP value (999.74 hPa), as shown in Fig. 2d.
In Jeddah, the T2m data indicate that January 2020 (22.3 °C) is the coldest month, while August 2020 (34.2 °C)
is the warmest month. Similarly, the RH data confirm that October 2017 (68.0%) attains the maximum monthly
RH mean value, while May 2018 (44.5%) exhibits the lowest mean value. Moreover, the WS10 data reveal that
April 2017 (4.8 m s–1) is the windiest month, while October 2016 (2.5 m s–1) is the calmest month. Generally,
the SLP data reveal that January 2020 (1016.7) attains the maximum monthly SLP value, while August 2017
(1001.7 hPa) exhibits the lowest monthly SLP value.
In Jizan, the T2m data confirmed that the maximum (monthly) average value was 35.05 °C (26.1 °C). The
maximum (minimum) value occurred in June 2020 (January 2019). Similarly, the RH data confirmed that
December 2019 (74.1%) attained the maximum monthly RH mean value, while May 2019 (55%) attained the
lowest monthly RH mean value. Moreover, the WS10 data revealed that the highest (lowest) average wind speed
value is 4.2 m s–1 (2.7 m s–1). The windiest (calmest) month is July 2020 (January 2020). Generally, the SLP data
reveal that December 2017 (1015 hPa) attains the maximum monthly SLP value, while July 2020 (1002.0 hPa)
achieves the lowest monthly SLP value.
Generally, T2m increased from Jizan to Tabuk. The highest temperatures were close among the three stud-
ied cities, while the lowest temperature markedly occurred in Tabuk (11 °C) rather than in Jeddah (24 °C) and
Jizan (27 °C). In contrast, RH increased from Jizan to Tabuk, and there was a significant difference between the
maximum and minimum RH values among the three studied cities. There was no significant difference among
Tabuk, Jeddah and Jizan regarding the W S10 regime. Regarding SLP, Jizan and Jeddah exhibited similar behaviour.
However, SLP in Tabuk indicated markedly higher values than those in Jizan/Tabuk.
Annual, monthly, and hourly cycles. In Jeddah and Jizan, the hottest (coldest) year was 2016 (2020). However, in
Tabuk, the hottest (coldest) year was 2018 (2019). The highest/lowest annual average RH values in the study area
changed from city to city, similar to W
S10. However, the SLP annual pattern in the study area revealed similari-
ties between Tabuk and Jizan, where the maximum (minimum) annual SLP value occurred in 2016 (2020). In
Jeddah, the maximum (minimum) annual value occurred in 2019 (2017), as indicated in Table 1.
In terms of the annual cycle (climate monthly average), as described in Table 1 and Fig. 3, the maximum T2m
value occurred in July for Tabuk and Jeddah and occurred in June over Jizan. In contrast, the minimum T2m
value occurred in January in the three studied cities. There was no common pattern among the three studied
cites regarding RH and WS10. In contrast, the SLP annual cycles were similar among Tabuk, Jeddah and Jizan,
as the maximum (minimum) values occurred in January (July).
The daily T2m cycle (Table 1; Fig. 4) amplitude in Tabuk (13.5 °C) is much higher than that in Jeddah (7.1 °C)
and Jizan (5.3 °C). Similarly, the amplitude of the RH daily cycle in Tabuk (26.7%) is much higher than that in
Jeddah (25.2%) and Jizan (17%). The amplitude of the W S10 daily cycle reaches its maximum value (4.7 m s−1)
−1 −1
in Jizan followed by (4 m s ) Jeddah and (2.4 m s ) Tabuk. Finally, the observed short-term SLP hourly means
indicate a significant hourly variation ranging from 1011.88 hPa at 8:00 to 1001.8 hPa at 15:00, as shown in
Scientific Reports | (2022) 12:160 | https://doi.org/10.1038/s41598-021-04200-z 3
Vol.:(0123456789)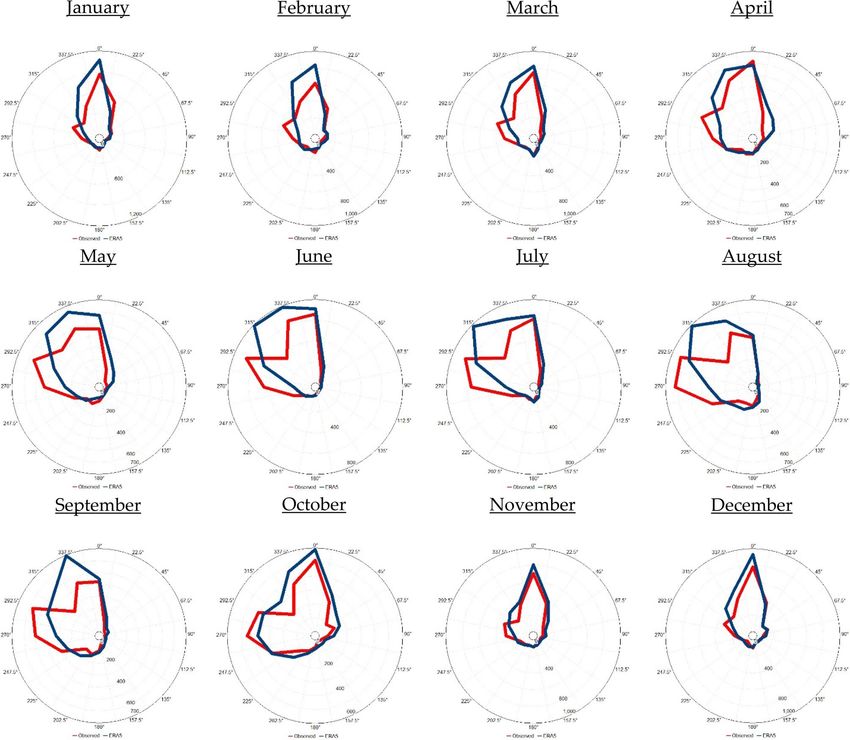
www.nature.com/scientificreports/
Figure 2. Monthly average time series for the parameters studied based on hourly observation data (2016–
2020) in Tabuk, Jeddah and Jizan. Microsoft Office (Excel). Version 365. https://www.office.com/.
Tabuk. The daily SLP cycle cannot be analysed in Jizan and Jeddah based on the available observed data due to
a large number of missing observations.
In Tabuk, the annual WS10 cycle reveals a direct correlation (n = 12, R = 0.69) with T2m and inverse correla-
tions (n = 12, R = − 0.88) with RH and (n = 12, R = − 0.76) SLP. Similar to Tabuk, the annual W S10 cycle in Jizan
indicates a significant direct correlation with T2m and significant inverse correlations with RH and SLP. In
contrast, the annual W S10 cycle in Jeddah reveals a non-significant correlation with T2m and SLP, while W S10
achieves a significant inverse correlation with RH (n = 12, R = − 0.76). This indicates that the four parameters
studied are co-dependent only in Tabuk and Jizan. In addition, in Tabuk, RH monthly maximum values occurred
in December. After one month (in January), SLP reached its monthly maximum values. After 4 months (in May),
WS10 reached its monthly maximum values. After 2 months (in July), T2m attained its monthly maximum values,
Scientific Reports | (2022) 12:160 | https://doi.org/10.1038/s41598-021-04200-z 4
Vol:.(1234567890)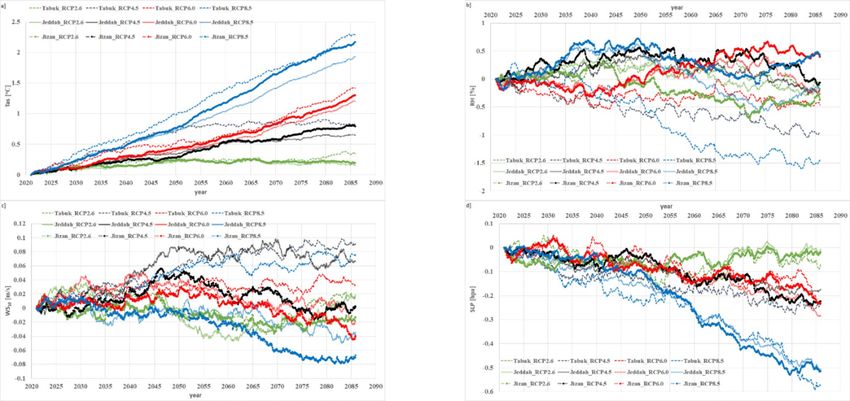
www.nature.com/scientificreports/
Tabuk Jeddah Jizan
Variables Maximum Minimum Maximum Minimum Maximum Minimum
2018 2019 2016 2020 2016 2020
Annual
(23.99 °C) (23.25 °C) (29.8 °C) (29.4 °C) (31.6 °C) (30.8 °C)
Surface air temperature July January July January June January
Monthly
(T2m, °C) 33.3 °C 11.3 °C 33.95 °C 23.87 °C 34.7 °C 26.9 °C
30.4 °C 16.86 °C 33.38 °C 25.97 °C 34.19 °C 28.36 °C
Hourly
at 15:00 at 6:00 at 12:00 at 5:00 at 12:00 at 5:00
2017 2017 2020 2020 2017
Annual 2019 (29.06%)
(26.1%) 55% 51.9% 68% 64.5%
Relative humidity (RH, December June September May December July
Monthly
%) 41.46% 17.53% 62.30% 46.84% 71.30% 58.9%
42.76% 16.01% 65.84% 40.55% 74.0% 57.0%
Hourly
at 6:00 at 15:00 at 5:00 at 11:00 at 5:00 at 12:00
2020 2017/2019 2016 2016/2020 2017
Annual 2016/2017 (3.22 m s–1)
(3.43 m s–1) (3.9 m s–1) (3.6 m s–1) (3.4 m s–1) (3.2 m s–1)
Surface wind speed May December February October July December
Monthly
(WS10, m s–1) 3.95 m s–1 2.60 m s–1 4.1 m s–1 3.0 m s–1 4.1 m s–1 2.9 m s–1
4.69 m s–1 2.26 m s–1 6.13 m s–1 2.1 m s–1 4.69 m s–1 2.26 m s–1
Hourly
at 17:00 at 6:00 at 14:00 at 5:00 at 17:00 at 6:00
2016 2020 2019 2017 2016 2020
Annual
(1010.7 hPa) (1009.4 hPa) 1009.7 hPa 1008.4 hPa 1009.0 hPa 1008.4 hPa
Mean sea level pressure January July January July January July
Monthly
(SLP, hPa) 1017.9 hPa 1001.41 hPa 1015.1 hPa 1002.9 hPa 1014.3 hPa 1002.6 hPa
1011.9 hPa 1001.8 hPa 1010.3 hPa 1007.8 hPa 1010.3 hPa 1006.2 hPa
Hourly
at 8:00 at 15:00 at 8:00 at 17:00 at 11:00 at 19:00
Table 1. Annual, monthly, and hourly characteristics of the parameters studied based on the hourly
observation data (2016–2020) in Tabuk, Jeddah and Jizan.
Figure 3. Observed short-term monthly means (annual cycle) for the parameters studied based on the hourly
observed data (2016–2020).
as shown in Fig. 3. Similarly, in Jizan, RH monthly maximum values occurred in December. After one month
(in January), SLP reached its monthly maximum values. After 6 months (in June), T2m attained its monthly
maximum values. After one month (during July), W S10 reached its monthly maximum values.
In contrast, regarding the daily cycle in Tabuk, W
S10 attains a direct correlation (n = 24, R = 0.76) with T2m
and an inverse correlation (n = 24, R = − 0.85) with RH. Moreover, T2m attains an inverse correlation (n = 24,
R = − 0.97) with RH. Moreover, SLP exhibits a weak correlation with W S10, T2m, and RH, indicating that the daily
cycle, which distinguishes W S10, T2m, and RH, is not significant for SLP (SLP is distinguished by a 3-h cycle),
Scientific Reports | (2022) 12:160 | https://doi.org/10.1038/s41598-021-04200-z 5
Vol.:(0123456789)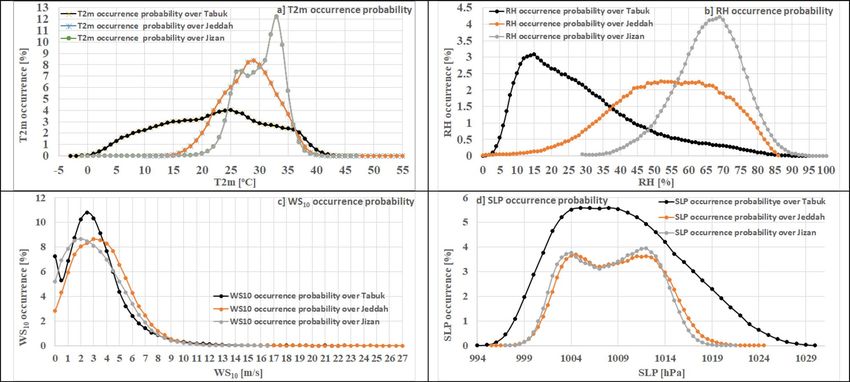
www.nature.com/scientificreports/
Figure 4. Observed short-term hourly means (daily cycle) for the parameters studied based on the hourly
observed data (2016–2020) (there is a large gap in the mean sea level observation data for Jizan and Jeddah).
Microsoft Office (Excel). Version 365. https://www.office.com/.
Figure 5. Observed (ERA5) annual wind rose diagram based on hourly observed (ERA5) data from 2016 to
2020 in Tabuk, Jeddah and Jizan. The blue colour indicates the observations, while the red colour indicates the
ERA5 data. UL, Inc. Windographer professional edition version 5.0.5. https://www.ul.com/resources/apps/
windographer.
as shown in Fig. 4. In Jizan and Jeddah, the daily RH, T2m and W S10 cycles indicate a significant correlation
(n = 24, R > 0.9 between any two parameters. This confirms the previous finding whereby T2m, RH and WS10 are
co-dependent in the study area. Due to the high percentage of missing SLP data, the hourly correlation between
SLP and the studied parameters could not be determined.
10‑m height wind direction (WD10). The prevailing annual wind direction originated from the northwest
(12.2% of the time) followed by the south-southwest direction (10.2% of the time) in Tabuk, as shown in Fig. 5.
However, the prevailing annual wind direction originated from the north (19.1% of the time), followed by both
the west-northwest and north-northwest directions (14.7% of the time each). In Jizan, the wind rose diagram
shows a different pattern than that in Jeddah and Tabuk, where the prevailing annual wind direction originated
from the west (15.6% of the time) followed by both the south and south-southwest directions (10.3% of the time
each).
Scientific Reports | (2022) 12:160 | https://doi.org/10.1038/s41598-021-04200-z 6
Vol:.(1234567890)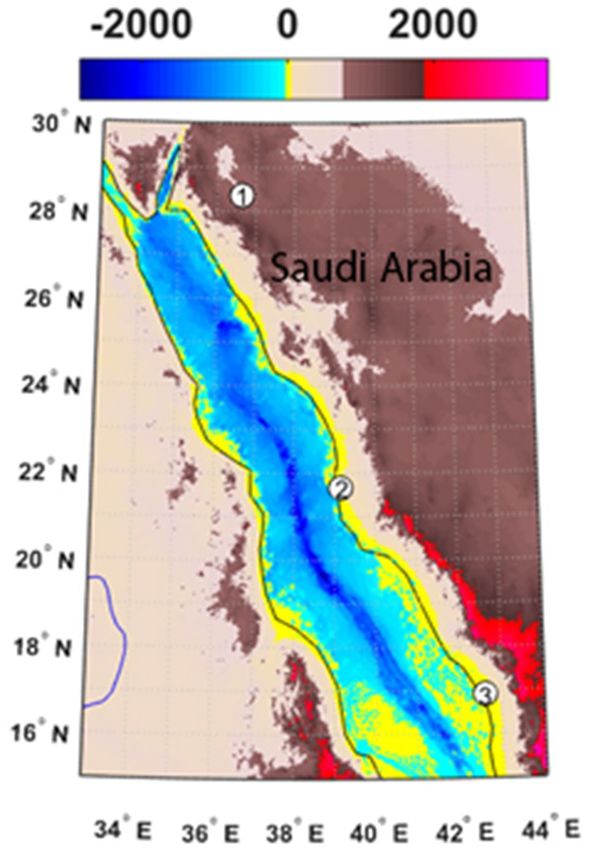
www.nature.com/scientificreports/
Figure 6. Observed (ERA5) monthly wind rose diagram based on hourly observed (ERA5) data from 2016 to
2020 in Tabuk. The blue colour indicates the observations, while the red colour indicates the ERA5 data. UL,
Inc. Windographer professional edition version 5.0.5. https://www.ul.com/resources/apps/windographer.
In Tabuk, as shown in Fig. 6, in November, December, January, and February, the prevailing monthly wind
direction originated from the east for 15%, 16%, 12%, and 14%, respectively, of the time. In March, the prevail-
ing monthly wind direction originated from the south-southwest direction (11% of the time). In April, June,
July, and August, the prevailing monthly wind direction originated from the northwest direction at frequencies
of 13%, 19%, 16%, and 19%, respectively, of the time. In May, the prevailing monthly wind direction originated
from the northwest and south-southwest directions (11% of the time each) at equal frequencies. In August, the
prevailing monthly wind direction originated from the west and south-southwest directions at equal frequen-
cies (11% of the time each). In Jeddah (Fig. 7), from October until April, the prevailing monthly wind direction
originated from the north. In the months from May to August, the prevailing monthly wind direction originated
from the west-northwest.
In Jizan (Fig. 8), in January, February and March, the prevailing monthly wind direction originated from the
south. In the months from April to September, the prevailing monthly wind direction originated from the west.
From October to December, the prevailing monthly wind direction originated from the east.
ERA5. ERA5 verification. To evaluate the feasibility of using ERA5 data in describing the selected atmos-
pheric parameters in Tabuk, Jeddah and Jizan, a comparison was carried out between ERA5 data and observa-
tions covering the observation period from 2016 to 2020 (Table 2; Figs. 6, 7, 8).
Generally, the ERA5 data closely matched the observations in the studied cities. With ERA5 data, T2m and
WS10 were underestimated, while RH and SLP were overestimated, as indicated in Table 2. Moreover, the applied
statistical tests (t and f tests) indicated that the observed and ERA5 T2m, RH, W
S10, and SLP values originated
Scientific Reports | (2022) 12:160 | https://doi.org/10.1038/s41598-021-04200-z 7
Vol.:(0123456789)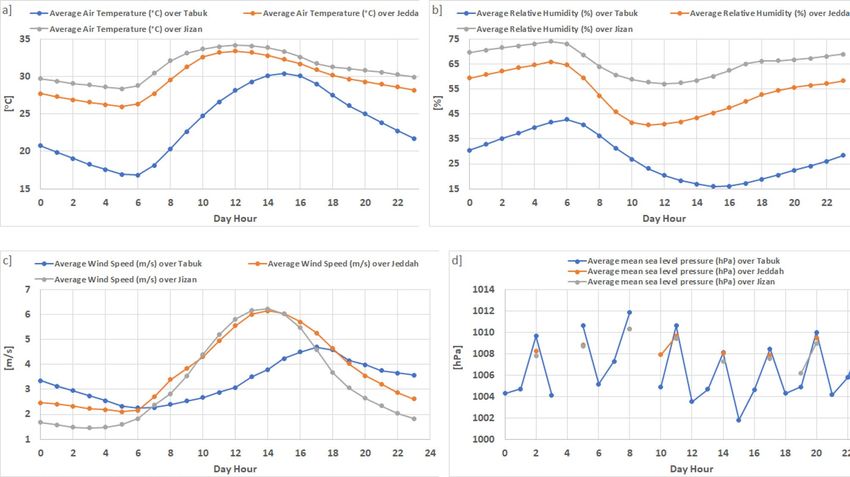
www.nature.com/scientificreports/
Figure 7. Observed (ERA5) monthly wind rose diagram based on the hourly observed (ERA5) data from 2016
to 2020 in Jeddah. The blue colour indicates the observations, while the red colour indicates the ERA5 data. UL,
Inc. Windographer professional edition version 5.0.5. https://www.ul.com/resources/apps/windographer.
from two equal distributions based on the mean and variance at a 99% significance level. In addition, based
on Figs. 6, 7 and 8, it is clear that the observed wind direction agrees with the ERA5-based wind direction. In
general, with the ERA5 data, the simulation efficiency in Jeddah was higher than that in Tabuk, with the lowest
simulation efficiency in Jizan.
ERA5 bias correction. To remove the bias in the ERA5 data, CDF bias correction was applied to match the CDF
of the observations to that of the ERA5 data from 2016 to 2020 (Fig. 9). This strategy conserves the nature of the
data while maintaining the same correlation values and adjusts the bias to zero. This strategy was applied to the
long-term ERA5 data to obtain corrected ERA5 data (C_ERA5) for Tabuk, Jeddah and Jizan. Figure 9 confirms
the current findings that the ERA5 data more reasonably simulate the current atmospheric parameters in Jeddah
and Tabuk than is achieved in Jizan.
C_ERA5 statistical analyses. Annual mean and trend analyses. The C_ERA5 data (1979–2020) revealed that
the annual average T2m, RH and SLP values across the study area exhibits significant spatial variation (Table 3),
where T2m and RH increased meridionally from north to south, while SLP decreased meridionally from north
to south. The annual long-term WS10 average value was very close between Tabuk and Jizan. However, Jeddah
was much windier.
The C_ERA5 data (1979–2020) confirmed a significant spatial long-term trend in T2m, RH and SLP. The long-
term WS10 trend in Tabuk and Jeddah, however, was less notable than that in Jizan. The study area experiences
a positive monotonic warming trend in the three studied cites. Similarly, WS10 attained a positive monotonic
trend in the study area. In contrast, RH and SLP attained negative monotonic trends in the study area (Table 3).
Scientific Reports | (2022) 12:160 | https://doi.org/10.1038/s41598-021-04200-z 8
Vol:.(1234567890)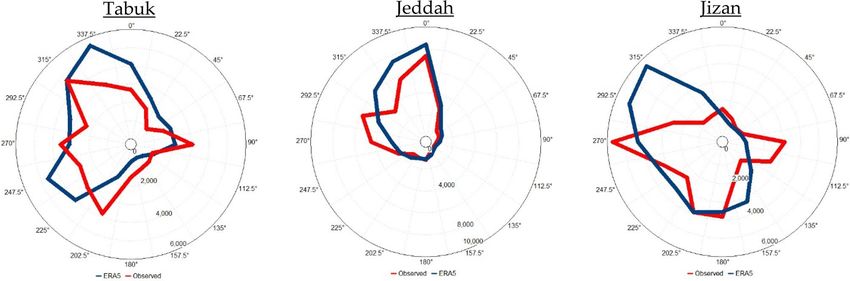
www.nature.com/scientificreports/
Figure 8. Observed (ERA5) monthly wind rose diagram based on the hourly observed (ERA5) data from 2016
to 2020 in Jizan. The blue colour indicates the observations, while the red colour indicates the ERA5 data. UL,
Inc. Windographer professional edition version 5.0.5. https://www.ul.com/resources/apps/windographer.
In detail, the warming trend in Tabuk is more intense than that in Jizan, indicating that the T2 m difference
across the study area may decrease in the future. Similarly, RH attains a much more significant negative trend
in Jizan than that in Tabuk, indicating that the spatial RH variation in the study area may decrease in the future.
In addition, the negative long-term SLP trend reaches its highest value in Jeddah, followed by Jizan and Tabuk,
indicating that the SLP difference between Tabuk and Jeddah may decrease in the future, while the difference
between Jeddah and Jizan may increase in the future.
Historical days. Tabuk The highest temperature of 44.87 °C in Tabuk was recorded on 12 July 2010 at 11:00
GMT, virtually on par with the value of 44.86 °C on 11 July 2010 at 13:00 GMT. However, the lowest temperature
of − 2.93 °C in Tabuk was recorded on 15 January 2008 at 4:00 GMT, virtually on a par with the value of − 2.65 °C
on 15 January 2008 at 5:00 GMT.
In Tabuk, the maximum RH value (= 93.9%) was recorded on 30 November 1989 at 02:00 GMT. In contrast,
the minimum RH value (= 0.1%) in Tabuk was recorded on 24 April 1994 at 16:00 GMT.
In Tabuk, the wind speed peaked (= 22.66 m s−1) on 13 March 2020 at 11:00 GMT, virtually on a par with the
value of 22.61 m s−1 on the same day at 10:00 GMT.
Tabuk’s highest SLP value reached 1030.56 hPa and was recorded on 5 January 1992 at 04:00 GMT, virtually
on par with the value of 1030.56 hPa on the same day at 5:00 GMT. In contrast, Tabuk’s lowest SLP value reached
994.60 hPa and was recorded on 24 March 2019 at 11:00 GMT, virtually on par with the value of 994.64 hPa on
the same day at 10:00 GMT.
Scientific Reports | (2022) 12:160 | https://doi.org/10.1038/s41598-021-04200-z 9
Vol.:(0123456789)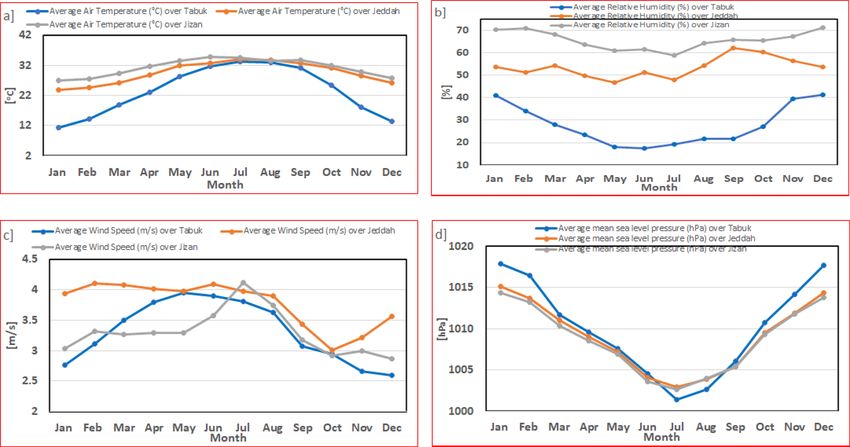
www.nature.com/scientificreports/
Annual mean ± standard
Variables n R [%] Minimum Maximum deviation
Observed − 2.0 46.0 23.7 ± 9.5
Tabuk 42,139 99.3
ERA5 − 2.3 43.7 22.6 ± 9.3
Surface air temperature (T2m, Observed 15 49 29.6 ± 4.7
Jeddah 42,699 96.6
°C) ERA5 15.8 43.8 29.0 ± 3.9
Observed 17 42 31.2 ± 3.6
Jizan 42,748 80.7
ERA5 22.4 34.3 29.3 ± 2.3
Observed 4.6 187.6 27.4 ± 16.0
Tabuk 42,127 92.6
ERA5 3.9 95.6 33.12 ± 17.1
Observed 4 100 55.5 ± 15.3
Relative humidity (RH, %) Jeddah 42,625 76.1
ERA5 17.8 104 69.4 ± 11.1
Observed 22.6 100 65.7 ± 10.1
Jizan 42,741 39.5
ERA5 41.4 92.8 76.1 ± 5.2
Observed 0.0 28.8 3.3 ± 2.3
Tabuk 42,128 66.8
ERA5 0.0 14.9 2.8 ± 1.6
Observed 0 27.8 3.37 ± 2.3
Surface wind speed (WS10, m s−1) Jeddah 42,730 73.0
ERA5 0 12.9 4.5 ± 2.1
Observed 0 23.2 3.3 ± 2.3
Jizan 42,752 58.6
ERA5 0 13.5 3.6 ± 2.0
Observed 994.4 1031.0 1009.8 ± 6.5
Tabuk 8363 98.4
ERA5 997.1 1033.1 1012.5 ± 5.6
Mean sea level pressure (SLP, Observed 997.1 1022.6 1008.9 ± 4.6
Jeddah 8476 99.8
hPa) ERA5 999.8 1022.6 1009.1 ± 4.55
Observed 997.9 1020.3 1008.6 ± 4.4
Jizan 8607 97.5
ERA5 997.6 1021.1 1008.7 ± 4.3
Table 2. Comparison analysis between the observed and ERA5-based weather variables in Tabuk, Jeddah and
Jizan: n = number of observations, and R = correlation coefficient.
Jeddah The highest temperature of 55.7 °C in Jeddah was recorded on 5 June 2013 at 9:00 GMT, while the low-
est temperature of 10.2 °C in Jeddah was recorded on 13 January 1992 at 4:00 GMT and on 26 February 1992
at 02:00 GMT.
In Jeddah, the maximum RH value (= 86.2%) was recorded on 20 October 1980 at 02:00 GMT, on 7 October
1995 at 04:00 GMT, and on 16 September 1995 at 04:00 GMT.
In Jeddah, a wind speed peak (= 26.3 m s−1) was recorded on 28 March 1997 at 09:00 GMT, virtually on par
with the value of 24.9 m s−1 on 18 December 1985 at 10:00 GMT.
Jeddah’s highest SLP value, 1024.9 hPa, was recorded on 26 February 1992 at 08:00 and 07:00 GMT. In con-
trast, Jeddah’s lowest SLP value reached 995.7 hPa and was recorded on 13 August 1998 at 0:00 GMT, virtually
on par with the value of 995.8 hPa on 12 August 1998 at 0:00 GMT.
Jizan In Jizan, the highest temperature of 47.2 °C was recorded on 11 July 1995 at 11:00 and 12:00 GMT, while
the lowest temperature of 0.1 °C in Jizan was recorded on 7 February 1993 at 04:00 and 03:00 GMT.
In Jizan, the maximum RH value (= 100%) was recorded on 29 July 1995 at 10:00 GMT. However, a wind
speed peak (= 16.6 m s−1) was recorded in Jizan on 17 July 2018 at 11:00 GMT.
Jizan’s highest SLP value of 1021.9 hPa was recorded on 5 January 1992 at 07:00 GMT virtually on par with the
value of 1021.5 hPa on the same day at 06:00 GMT. However, Jizan’s lowest SLP value reached 997.0 hPa and was
recorded on 29 July 2001 at 0:00 GMT, virtually on par with the value of 997.1 hPa on 22 June 2007 at 14:00 GMT.
Probability of occurrence. The highest values of the hourly T2m occurrence probability are 4.13% (24–25 °C),
8.4% (28–29 °C), and 12.2% (32–33 °C) in Tabuk, Jeddah and Jizan, respectively. In regard to the warmest hours
(mean + 2*standard deviation), the occurrence probability is 0.46% (> 41.1 °C), 1.36% (> 37.8 °C), and 0.85%
(> 38.1 °C) in Tabuk, Jeddah and Jizan, respectively. However, regarding the coldest hours (mean − 2*standard
deviation), the occurrence probability is 2.3% (< 3.7 °C), 3.2% (< 19 °C), and 3.3% (< 23.3 °C) in Tabuk, Jeddah
and Jizan, respectively, as shown in Fig. 10a.
The highest values of the hourly RH occurrence probability were 3.09% (15–16%), 2.26% (51–52%), and
4.22% (68–69%) in Tabuk, Jeddah and Jizan, respectively. Regarding the highest RH values (mean + 2*standard
deviation), the occurrence probabilities were 5.7% (> 62.5%), 0.15% (> 85.5%), and 1.17% (> 85.9%) in Tabuk,
Jeddah and Jizan, respectively. In addition, no hourly occurrences of the lowest RH value were noted (< 0%;
mean − 2*standard deviation) in Tabuk. During approximately 3.1% (3.5%) of the time, the lowest hourly RH
values < 23.5% (46%) were noted in Jeddah (Tabuk), as shown in Fig. 10b.
Scientific Reports | (2022) 12:160 | https://doi.org/10.1038/s41598-021-04200-z 10
Vol:.(1234567890)www.nature.com/scientificreports/
Figure 9. Cumulative distribution function (CDF) between the observations and ERA5 data from 2016–2020
for T2m (2-m air temperature), RH (relative humidity), surface wind speed ( WS10), and SLP (mean sea level
pressure). The corrected ERA5 (C_ERA5) curves are identical to the observed curves. Math Works, Inc.
MATLAB. Version 2020a, Math Works, Inc., 2020. www.mathworks.com.
Scientific Reports | (2022) 12:160 | https://doi.org/10.1038/s41598-021-04200-z 11
Vol.:(0123456789)www.nature.com/scientificreports/
Annual mean ± standard
Variables deviation Trend Significant (monotonic) trend
Tabuk 22.4 ± 9.3 °C 0.49 °C decade−1 Yes
Surface air temperature (T2m, °C) Jeddah 28.4 ± 4.7 °C 0.42 °C decade−1 Yes
Jizan 30.7 ± 3.7 °C 0.33 °C decade−1 Yes
Tabuk 29.1 ± 16.7% − 0.34% decade−1 Yes
Relative humidity (RH, %) Jeddah 54.5 ± 15.5% − 0.33% decade−1 Yes
Jizan 66.3 ± 9.8% − 0.45% decade−1 Yes
Tabuk 3.3 ± 2.2 m s −1 0.02 m s−1 decade−1 Yes
Surface wind speed (WS10, m s−1) Jeddah 3.7 ± 2.2 m s−1 0.02 m s−1 decade−1 Yes
Jizan 3.3 ± 2.2 m s−1 0.01 m s−1 decade−1 Yes
Tabuk 1009.9 ± 6.3 hPa − 0.04 hPa decade−1 Yes
Mean sea level pressure (SLP, hPa) Jeddah 1008.9 ± 4.5 hPa − 0.11 hPa decade−1 Yes
Jizan 1008.5 ± 4.3 hPa − 0.08 hPa decade−1 Yes
Table 3. Long-term annual mean and trend analyses of the corrected ERA5 weather variables in Tabuk,
Jeddah and Jizan from 1979 to 2020. The nonparametric Mann–Kendall test is used to detect monotonic trends
in the corrected ERA5 data to examine whether the C_ERA5 data follow a significant (monotonic) trend.
Figure 10. Occurrence probability of the parameters considered based on the hourly corrected ERA5 data
(1979–2020) in the study area. Math Works, Inc. MATLAB. Version 2020a, Math Works, Inc., 2020. www.mathw
orks.com.
The hourly W S10 mostly (10.78%, 8.6%, and 8.6%) ranged from 2.5 to 3 m s−1, 3 to 3.5 m s−1, and 2 to 2.5 m s−1
in Tabuk, Jeddah and Jizan, respectively. In regard to the windiest WS10 hourly events (mean + 2*standard devia-
tion), the occurrence probabilities were 4.7% (> 7.7 m s−1) in Tabuk, 3.6% (> 8.1 m s−1) in Jeddah, and 4.1%
(> 7.7 m s−1) in Jizan. The calmest hourly events (< 0.5 m s−1) occurred approximately 12.5%, 9.9%, and 16.4% of
the time in Tabuk, Jeddah and Jizan, respectively, as shown in Fig. 10c.
The hourly SLP mostly (6.7%, 3.7%, and 3.9%) ranged from 1012 to 1013 hPa, 1004.5 to 1005 hPa, and 1012 to
1012.5 hPa in Tabuk, Jeddah and Jizan, respectively. In regard to the highest SLP hourly events (mean + 2*stand-
ard deviation), the occurrence probabilities were 2.44% (> 1022.5 hPa), 1.23% (> 1017.9 hPa), and 0.86%
(> 1017.1 hPa) in Tabuk, Jeddah and Jizan, respectively. The lowest hourly events (mean − 2*standard devia-
tion) occurred during 0.6% (< 997 hPa), 0.3% (< 999 hPa), and 1% (< 999.9 hPa) of the time in Tabuk, Jeddah
and Jizan, respectively, as shown in Fig. 10d.
Principal component analysis (PCA). PCA (Table 4) revealed that only two principal components (PCs)
accounted for 85%, 82% and 75% of the parameter variance in Tabuk, Jeddah and Jizan, respectively.
In detail, the first PC, which is responsible for 62.71% and 45% of the parameter variance in Tabuk and Jed-
dah, respectively, indicates a strong correlation with three of the examined variables. This first PC decreases with
decreasing T2m but increases with increasing RH and SLP. This indicates that T2m, RH, and SLP are highly
Scientific Reports | (2022) 12:160 | https://doi.org/10.1038/s41598-021-04200-z 12
Vol:.(1234567890)www.nature.com/scientificreports/
Principal component (PC)
Variables PC1 PC2 PC3 PC4
Surface air temperature (T2m) − 0.59 − 0.21 0.09 0.77
Relative humidity (RH) 0.52 0.17 0.75 0.36
Tabuk
Surface wind speed (WS10) − 0.27 0.96 − 0.06 0.06
Mean sea level pressure (SLP) 0.55 0.08 − 0.65 0.52
Surface air temperature (T2m) − 0.69 0.19 − 0.26 0.65
Relative humidity (RH) 0.44 0.63 0.58 0.40
Jeddah
Surface wind speed (WS10) − 0.29 − 0.61 0.72 0.16
Mean sea level pressure (SLP) 0.58 − 0.44 − 0.29 0.62
Surface air temperature (T2m) − 0.69 0.11 − 0.11 0.70
Relative humidity (RH) 0.21 0.70 0.65 0.21
Jizan
Surface wind speed (WS10) − 0.18 − 0.64 0.74 0.04
Mean sea level pressure (SLP) 0.66 − 0.29 − 0.12 0.68
Table 4. Principal component analysis of Tabuk, Jeddah and Jizan based on the corrected ERA5 parameters.
The bold numbers indicate highly significant correlations above 0.40.
Annual GFDL mini-ensemble mean—annual corrected ERA5 data
Surface air temperature Surface wind speed (WS10, Mean sea level pressure (SLP,
(T2m, °C) Relative humidity (RH, %) m s−1) hPa)
Tabuk − 4.7 4.4 − 0.76 7.6
Jeddah 1 − 14 − 0.5 2.1
Jizan − 3.7 − 15.8 0.4 3.5
Table 5. Performance of the GFDL mini-ensemble mean during the control period (2006–2020) in Tabuk,
Jeddah and Jizan: only the RCP2.6 scenario is considered. The bold numbers (shaded numbers) indicate
overestimation (underestimation).
correlated in Tabuk and Jeddah. In Jizan, the first PC, which is responsible for 47% of the parameter variance,
exhibits a strong correlation with only two of the examined variables. This first PC decreases with decreasing
T2m but increases with increasing SLP.
The second PC, which is responsible for 22.11% of the parameter variance in Tabuk, can be considered a
measure of WS10. In Jeddah and Jizan, the second PC is responsible for 39% and 28%, respectively, of the param-
eter variance. The second PC attains a strong correlation with only two of the examined variables, RH and W S10,
indicating the strongest co-dependence between RH and W S10.
Statistical downscaling for future projection. In this section, the results of the GFDL mini-ensemble
mean simulations under the different RCP scenarios are investigated for Tas, RH, W
S10, and SLP.
GFDL model bias correction over the control period, 2006—2020. The GFDL mini-ensemble mean under-
estimates (overestimates) Tas in Tabuk and Jizan (Jeddah), as indicated in Table 5. In addition, the GFDL
mini-ensemble mean underestimates (overestimates) RH in Jeddah and Jizan (Tabuk). Moreover, the GFDL
mini-ensemble mean underestimates (overestimates) WS10 in Tabuk and Jeddah (Jizan). In general, the GFDL
mini-ensemble mean overestimates SLP in the three studied cities.
To overcome the above underestimation/overestimation of the GFDL mini-ensemble mean that is incompa-
rable to the C_ERA5 data, a simple statistical model was developed by matching the CDF of the C_ERA5 data
to that of the GFDL mini-ensemble mean data over the control period (2006—2020) under the different RCP
scenarios, as shown in Fig. 11. Figure 11 shows the bias correction for only RCP2.6. However, the bias correction
for RCP4.5, RCP6, and RCP8.5 is not shown due to the similarity with the RCP2.6 effect over the control period.
Future atmospheric parameters, 2006–2100. The GFDL mini-ensemble mean at each site over the 2006–2100
period was subjected to bias removal based on the developed statistical model, which was established by match-
ing the CDF of the C_ERA5 data to that of the GFDL mini-ensemble mean data over the control period (2006–
2020) under the different RCP scenarios. The resulting S_D_ GFDL mini-ensemble mean data were used to
calculate the atmospheric future uncertainty with a high accuracy at each site (Tabuk, Jeddah and Jizan).
The S_D_ GFDL mini-ensemble means under the projected Tas scenarios in the current century indicate
significant warming during the 2006–2100 period in the Saudi Arabia Red Sea coast, especially under the RCP8.5
scenario in Tabuk, as shown in Fig. 12a. The expected warming at the end of the current century (with reference
to the 2006–2020 average value) ranges from 1.92 to 2.29 °C under the RCP8.5 scenario, 1.20–1.41 °C under
the RCP6.0 scenario, 0.64–0.81 °C under the RCP4.5 scenario and 0.15–0.34 °C under the RCP2.6 scenario.
Scientific Reports | (2022) 12:160 | https://doi.org/10.1038/s41598-021-04200-z 13
Vol.:(0123456789)www.nature.com/scientificreports/
Figure 11. Cumulative distribution function (CDF) between the corrected ERA5 (C_ERA5) and GFDL mini-
ensemble mean data over the control period (2006–2020) under the RCP2.6 scenario for the studied parameters.
Tas (simulated 2-m air temperature), RH (relative humidity), surface wind speed ( WS10), and SLP (mean sea
level pressure). The corrected data curves are identical to the reference curves. Math Works, Inc. MATLAB.
Version 2020a, Math Works, Inc., 2020. www.mathworks.com.
The S_D_ GFDL mini-ensemble means under the projected RH scenarios in the current century indicate a
significant negative trend from 2006 to 2100 in the study area, especially under the RCP8.5 scenario in Tabuk,
as shown in Fig. 12b. The expected decrease in RH up to 2100 (with reference to the 2006–2020 average value)
ranges from 1.5 to 0.43% under the RCP8.5 scenario, 0.46–0.40% under the RCP6.0 scenario, 0.06–0.98% under
the RCP4.5 scenario, and 0.11–0.36% under the RCP2.6 scenario.
Scientific Reports | (2022) 12:160 | https://doi.org/10.1038/s41598-021-04200-z 14
Vol:.(1234567890)www.nature.com/scientificreports/
Figure 12. Thirty-year running annual means for (a) Tas (2-m air temperature), (b) RH (relative humidity), (c)
WS10 (surface wind speed), and (d) SLP (mean sea level pressure) anomalies with reference to the 2006–2020
average values for statistical downscaling of the GFDL mini-ensemble mean simulations. Math Works, Inc.
MATLAB. Version 2020a, Math Works, Inc., 2020. www.mathworks.com.
The S_D_ GFDL mini-ensemble means under the projected W S10 scenarios in the current century indicate
both negative and positive trends from 2006 to 2100 in the study area, especially under the RCP8.5 scenario in
Jizan, as shown in Fig. 12c. The expected changes in WS10 up to 2100 (with reference to the 2006–2020 average
value) averages − 0.14 m s−1 under the RCP8.5 scenario, − 0.07 m s−1 under the RCP6.0 scenario, − 0.08 m s−1
under the RCP4.5 scenario, and − 0.03 m s−1 under the RCP2.6 scenario.
The S_D_ GFDL mini-ensemble means under the projected SLP scenarios indicate a significant negative
trend from 2006 to 2100 in the study area, especially under the RCP8.5 scenario in Tabuk, as shown in Fig. 12d.
The expected changes in SLP up to 2100 (with reference to the 2006–2020 average value) reach 0.062 hPa under
the RCP8.5 scenario, 0.051 hPa under the RCP6.0 scenario, 0.058 hPa under the RCP4.5 scenario, and 0.058 hPa
under the RCP2.6 scenario.
Generally, the future warming uncertainty is 2.14 °C, where 86% (14%) of the uncertainty is associated
with scenario design (regional variation). In regard to the future RH, the uncertainty is 2.3%, and 25% of the
uncertainty is associated with scenario design, while 75% is associated with regional variation. In regard to the
future WS10, the uncertainty is 0.23 m s−1, where 21% of the uncertainty is associated with scenario design, and
79% is associated with regional variation. Regarding the future SLP, the uncertainty is 0.56 hPa, and 93% of the
uncertainty is associated with scenario design, while only 7% is associated with regional variation.
Discussion and conclusions
As mentioned above, a limited number of scientific studies has been conducted on the climate in the study area.
The current paper presented an overview to bridge the present gap in climate knowledge of the Saudi Arabian
Red Sea coast, especially regarding future projections.
Based on hourly observed time series for T2m, RH, W S10 and SLP, the present research studied the short-term
atmospheric changes in Tabuk, Jeddah and Jizan from 2016 to 2020. The observed time series was employed
to remove the bias in ERA5 data and calculate C_ERRA5 data for the three studied cities from 1979 to 2020
via cumulative distribution functions (CDFs). The long-term C_ERA5 data were analysed statistically with the
following techniques: trend analysis, historical days, probability of occurrence, and PCA. The C_ERRA5 data
were employed to downscale GFDL mini-ensemble mean simulations and ensure relevance to Tabuk, Jeddah
and Jizan with the CDF strategy. Finally, the S_D_ GFDL mini-ensemble mean was considered to analyse the
uncertainty in the future Tabuk climate.
The results based on the observed data indicated that the air temperature increased meridionally from north
(Tabuk) to south (Jizan), partly due to the amount of net absorbed solar energy. The warmest month was July
in Tabuk and Jeddah, with average values of 33.3 °C and 33.95 °C, respectively. However, in Jizan, the hottest
month occurred one month earlier (June), with an average value of 34.7 °C. The coldest month was January in
Tabuk, Jeddah and Jizan, with average values of 11.3 °C, 23.87 °C and 26.9 °C, respectively. The lowest surface air
temperature that was 12.5 °C (15.6 °C) lower than that in Jeddah (Jizan) indicated a much more intensive cool-
ing process during cold months in Tabuk stemming from its mountainous nature. Similarly, the RH increased
meridionally from Tabuk to Jizan. In contrast, there were no consistent patterns of meridional changes in the
study area regarding WS10 and SLP. In addition, the prevailing annual wind direction was NW (12.2% of the time)
Scientific Reports | (2022) 12:160 | https://doi.org/10.1038/s41598-021-04200-z 15
Vol.:(0123456789)www.nature.com/scientificreports/
in Tabuk, N (19.11% of the time) in Jeddah, and W (15.6% of the time) in Jizan. Moreover, the prevailing wind
direction indicated significant monthly variability in the study area. Generally, the monthly T2m/RH variability
was lower in Jeddah and Jizan than that in Tabuk, partially reflecting the importance of studying the dynamic
mechanism that shapes the temperature variability near the Earth’s surface and upper layer.
Generally, the monthly T2m/SLP patterns were very close among the 3 studied cities. However, the monthly
RH pattern in Tabuk was much closer to that in Jizan than to that in Jeddah. In the same manner, the monthly
RH pattern in Tabuk was much closer to that in Jizan than to that in Jeddah.
The ERA5 data described the real atmospheric characteristics of the Saudi Arabian Red Sea Coast in a reason-
able way, as CDF bias correction against real observations was insignificant in 66% of the study cases. This high
performance indicates significant spatial variation, reaching a maximum performance in Jeddah and a lowest
performance in Jizan. In detail, the highest match for the prevailing wind direction between the observed and
ERA5 data was detected in Jeddah (Shift = 0), while in Tabuk, the shift was 22.5°, and finally, in Jizan, the shift
was 45°. In contrast, ERA5 describes the present observation with a higher accuracy in Tabuk regarding T2m and
Rh. However, a higher ERA5-based accuracy regarding W S10 and SLP was detected in Jeddah. This variability
between the observed and ERA5 data initiates a future discussion regarding the reliability of ERA5 data versus
land use and topography data in the study area.
In Tabuk, the present calculated long-term T2m annual mean (22.4 ± 9.3 °C) is approximately 1 °C higher
than that modelled b y13. This difference may be related to the different time spans. However, the current calcula-
tion of the long-term WS10 annual mean (3.3 ± 2.2 m s−1) is close to that modelled by14. In contrast, the C_ERA5
annual wind speed is approximately 50% lower than that previously calculated b y15. This significant difference
15
mainly occurs because ) the calculations were based on climate data, while the current calculations were based
on hourly data.
The annual mean (from 1979 to 2020) of the C_ERA5 data in the study area confirms the occurrence of an
8.3 °C spatial T2m variation ranging from 22.4 to 30.7 °C, a 37.2% spatial RH variation ranging from 29.1 to
66.3%, a 0.4 m s−1 spatial W S10 variation ranging from 3.2 to 3.7 m s−1, and a 1.4 hPa spatial variation ranging
from 1008.5 to 1009.9 hPa.
In addition, the C_ERA5 data revealed that T2m and W S10 attained a significant positive trend. However,
RH and SLP exhibited a significant negative trend. The significance of the calculated trends was tested with the
Mann–Kendall test. In detail, the Saudi Arabian Red Sea coast exhibits a significant spatial warming trend (from
1979 to 2020) for T2m (0.33–0.49 °C decade−1), RH (− 0.34 to − 0.45% decade−1), WS10 (0.01–0.02 m s−1 decade−1)
and SLP (− 0.04 to − 0.11 hPa decade−1). However, the Saudi Arabian Red Sea Coast exhibits a significant spatial
variation in the T2m trend, and RH and SLP may lead to a decrease in the spatial variation in the annual average
values. The T2m and RH values in the south remain higher than those in the north, and the SLP value in the
south remains lower than that in the north.
A historical warming day in the study area was recorded in Jeddah (55.7 °C) on 5 June 2013 at 9:00 GMT,
while a historical cold day was recorded in Tabuk (− 2.93 °C) on 15 January 2008 at 4:00 GMT. In contrast,
a peak RH value (100%) occurred in Jizan on 29 July 1995 at 10:00 GMT. However, an hourly wind speed
peak (= 26.3 m s−1) was recorded in Jeddah on 28 March 1997 at 09:00 GMT. The highest SLP value reached
1030.56 hPa and was recorded in Tabuk on 5 January 1992 at 04:00 GMT, while the lowest SLP value reached
994.60 hPa and was recorded in Tabuk on 24 March 2019 at 11:00 GMT.
In general, the probability occurrence patterns indicate a significant spatial variation in each studied param-
eter. In addition, the C_ERA5 long-term records (1979–2020) confirm that T2m, RH and SLP in the study area
are rarely below 3.7 °C, 1%, and 997 hPa, respectively, or above 41.1 °C, 85.9% and 1022.5 hPa, respectively.
Moreover, WS10 rarely exceeds 8.1 m s−1.
At least 75% of the variance in the studied parameters can be explained by only two principal components
in the study area, much more markedly in Tabuk (85%). In Tabuk and Jeddah, T2m, RH and SLP are closely
co-dependent. However, in Jizan, only T2m and SLP are closely co-dependent.
The comparison between the GFDL mini-ensemble mean and corrected ERA5 data over the control period
(2006–2020) confirms that the GFDL mini-ensemble mean in general underestimates Tas, RH and W S10 with
average values of − 2.4 °C, − 8.4%, and − 0.2 m s−1, respectively. Moreover, the GFDL mini-ensemble mean
generally overestimates SLP with an average value of 4.5 hPa. Thus, the GFDL mini-ensemble mean is applied
to project the future climate in the study area after bias correction with the CDF technique.
The statistical downscaling results indicate that the study area will experience significant warming trends
and significant negative RH/SLP trends. The future WS10 exhibits a wide uncertainty range from a positive to a
negative trend. Moreover, the emission assumptions (according to the RCP used) combined with regional vari-
ation impose a significant effect on the uncertainty in all the studied parameters. The uncertainty related to the
simulation performed is negligible, as the research considers only GFDL mini-ensemble means.
To support future management in Tabuk, statistical downscaling was applied to improve the GFDL mini-
ensemble mean results, which exhibits a coarse resolution (2° × 2°), to ensure applicability in Tabuk. The S_D_
GFDL mini-ensemble mean simulations over the current century revealed a significant increase in Tas and WS10
with decreasing RH and SLP.
Future work
The current research provides the first scientific analyses based on the current and future climate conditions in
the Saudi Arabian Red Sea Coast. The main result of the current paper confirmed that the study area will face
dramatic climatic changes, and the responses in terms of Tas, RH, W S10, and SLP are now better identified. This
information can comprise a powerful database needed to improve the future vision of Tabuk.
Scientific Reports | (2022) 12:160 | https://doi.org/10.1038/s41598-021-04200-z 16
Vol:.(1234567890)www.nature.com/scientificreports/
In future studies, the authors will expand the current work to study new stations distributed throughout the
KSA to obtain a full picture of the future uncertainties in the KSA. Moreover, the use of a regional climate model
as a scientific tool for dynamical downscaling merits our attention in future work.
Finally, the most important conclusion of the current research addresses the project statistics of the studied
climatic parameters up to 2100 through the different RCP scenarios. The projected climate uncertainties are
likely to yield many negative socioeconomic impacts, especially in agriculture, water demand, and health. Thus,
scientists in the fields of agriculture, medicine, and climate change must work with specialists in the field of water
resources and decision-makers to improve climate policies in the KSA to identify innovative ways to turn the
expected future climate challenges into social and economic opportunities.
Methods
This paper obtained observation data to describe the short-term atmospheric variability in T2m, relative humid-
ity (RH), and surface wind field components (eastward wind (U10), northward wind (V10) and SLP) in Tabuk,
Jeddah and Jizan. Moreover, the long-term characteristics of the studied atmospheric parameters were analysed
based on the ERA5 database after bias removal. Regarding the projection of future scenarios, statistical downscal-
ing of the GFDL mini-ensemble mean was performed to study the future uncertainty in the study area.
Material. Observation data. An automated weather observing system (AWOS) in Tabuk (760-m height),
Jeddah (15-m height), and Jizan (6-m height) was employed to collect hourly T2m, surface dew point tempera-
ture (d2m), U10, V10 and SLP data. AWOS data are freely available via https://datasource.kapsarc.org/explore/
dataset/saudi-hourlyweather-data/information/?disjunctive.station_name&disjunctive.wind_direction_quali
ty&disjunctive.wind_type&disjunctive.wind_speed_quality&disjunctive.sky_ceiling_quality&disjunctive.visib
ility_distance_quality&disjunctive.visibility_variability_quality&disjunctive.air_temperature_quality&disjunc-
tive.air_temperature_dew_point_quality&disjunctive.atmospheric_sea_level_pressure_quality (last accessed on
1 February 2021). These AWOSs were installed and maintained according to WMO regulations. The observa-
tions were calibrated according to a WMO standard height of 2 m above sea level for T2m/d2m and 10 m above
sea level for U10 and V10. These data were used to generate a full image of the current short-term dynamics
(from 2016 to 2020) of the studied atmospheric variables while validating the ERA5 database.
ERA5 database. Hourly data for T2m, d2m, U10, V10 and SLP from 1979 to 2020 were extracted from the
Copernicus Climate Change Service (C3S) website (https://cds.climate.copernicus.eu/cdsapp#!/dataset/reana
lysis-era5-single-levels?tab=form).
ERA5 data, which are distributed by the Copernicus Climate Change Service (C3S) and produced by the
European Center for Medium Range Weather Forecasts (ECMWF), were intended to mitigate earlier issues (e.g.,
ERA Interim and ERA40 data) and improve the study of atmospheric parameters18,19 with a finer grid resolution
of 0.25° × 0.25° and hourly data. These data, after a comparison to observations, were considered to analyse the
long-term trends of the studied atmospheric variables. These data were further used for statistical downscaling.
Statistical downscaling from 2006 to 2100. GFDL climate model simulation results of the surface air tempera-
ture (Tas) over the 2006–2100 period was extracted from three model realizations: GFDL-ESM2M20,21, GFDL-
CM322, and GFDL-ESM2G20,21. These simulations are available on the GFDL website (ftp://nomads.gfdl.noaa.
gov/CMIP5/output1/NOAA-GFDL) for the above four CMIP5 emission scenarios with a coarse grid resolution
of 2° × 2°.
Methods. Analysis of the recent and future variabilities in T2m, relative humidity (RH), 10-m height wind
speed (WS10), wind direction ( WD10), and SLP requires three steps. The first step is to analyse the current short-
term atmospheric system from 2016 to 2020 using observation data. The second step concerns the ERA5 data-
base (based on observations, remote sensing, and modelled information), where these data are employed after
validation against observation data to analyse the current long-term climate system from 1979 to 2020. The third
step is to conduct statistical downscaling to project the future climate from 2020 to 2100.
Generally, the relative humidity (RH) is calculated according t o23 based on T2m and d2m, as expressed in
Eq. (1).
17.625∗d2m(◦ C)
100 ∗ exp 243.04+d2m( ◦ C)
RH =
17.625∗T2m(◦ C)
(1)
exp 243.04+T2m( ◦ C)
Observation. Statistical analysis (observed as short-term means at hourly, daily, and monthly scales) of T2m,
RH, WS10, and SLP was performed to investigate the temporal variation. In addition, the wind rose method is
applied to similarly describe the temporal variation in WD10.
The SLP data pertaining to Tabuk, Jeddah and Jizan contained notable missing data fractions of 19.41%,
19.37% and 19.67%, respectively. Thus, the monthly mean was calculated only if the hourly data covered at least
33% of the month. Missing data for T2m, RH, and WS10 were very rare among the three stations.
Observed short-term hourly means for the parameters studied were considered to compute average values of
T2m at hourly intervals throughout the observation period. Similarly, observed short-term monthly means were
computed by averaging all the hourly data on a monthly basis during the observation period.
Scientific Reports | (2022) 12:160 | https://doi.org/10.1038/s41598-021-04200-z 17
Vol.:(0123456789)You can also read