A Machine Learning Approach to Passively Informed Prediction of Mental Health Risk in People with Diabetes: Retrospective Case-Control Analysis ...
←
→
Page content transcription
If your browser does not render page correctly, please read the page content below
JOURNAL OF MEDICAL INTERNET RESEARCH                                                                                                       Yu et al

     Original Paper

     A Machine Learning Approach to Passively Informed Prediction
     of Mental Health Risk in People with Diabetes: Retrospective
     Case-Control Analysis

     Jessica Yu, PhD; Carter Chiu, PhD; Yajuan Wang, PhD; Eldin Dzubur, PhD; Wei Lu, PhD; Julia Hoffman, PsyD
     Livongo Health, Inc, Mountain View, CA, United States

     Corresponding Author:
     Jessica Yu, PhD
     Livongo Health, Inc
     150 W Evelyn Ave
     Ste 150
     Mountain View, CA, 94041
     United States
     Phone: 1 6508048434
     Email: jessica.yu@livongo.com

     Abstract
     Background: Proactive detection of mental health needs among people with diabetes mellitus could facilitate early intervention,
     improve overall health and quality of life, and reduce individual and societal health and economic burdens. Passive sensing and
     ecological momentary assessment are relatively newer methods that may be leveraged for such proactive detection.
     Objective: The primary aim of this study was to conceptualize, develop, and evaluate a novel machine learning approach for
     predicting mental health risk in people with diabetes mellitus.
     Methods: A retrospective study was designed to develop and evaluate a machine learning model, utilizing data collected from
     142,432 individuals with diabetes enrolled in the Livongo for Diabetes program. First, participants’ mental health statuses were
     verified using prescription and medical and pharmacy claims data. Next, four categories of passive sensing signals were extracted
     from the participants’ behavior in the program, including demographics and glucometer, coaching, and event data. Data sets were
     then assembled to create participant-period instances, and descriptive analyses were conducted to understand the correlation
     between mental health status and passive sensing signals. Passive sensing signals were then entered into the model to train and
     test its performance. The model was evaluated based on seven measures: sensitivity, specificity, precision, area under the curve,
     F1 score, accuracy, and confusion matrix. SHapley Additive exPlanations (SHAP) values were computed to determine the
     importance of individual signals.
     Results: In the training (and validation) and three subsequent test sets, the model achieved a confidence score greater than 0.5
     for sensitivity, specificity, area under the curve, and accuracy. Signals identified as important by SHAP values included
     demographics such as race and gender, participant’s emotional state during blood glucose checks, time of day of blood glucose
     checks, blood glucose values, and interaction with the Livongo mobile app and web platform.
     Conclusions: Results of this study demonstrate the utility of a passively informed mental health risk algorithm and invite further
     exploration to identify additional signals and determine when and where such algorithms should be deployed.

     (J Med Internet Res 2021;23(8):e27709) doi: 10.2196/27709

     KEYWORDS
     diabetes mellitus; mental health; risk detection; passive sensing; ecological momentary assessment; machine learning

                                                                          experience generalized anxiety      disorder      (GAD) [1-3].
     Introduction                                                         Individuals with diabetes and mental health challenges have
     In the United States, 34.2 million people are affected by diabetes   been found to be less adherent to diabetes
     mellitus [1]. Approximately 25% of those living with diabetes        treatment recommendations, including diet, exercise, medication
     experience significant depressive symptoms, and up to 40%            use, glucose monitoring, and medical appointments, and they
                                                                          are at a greater risk for adverse medical outcomes [1]. Health

     https://www.jmir.org/2021/8/e27709                                                           J Med Internet Res 2021 | vol. 23 | iss. 8 | e27709 | p. 1
                                                                                                                (page number not for citation purposes)
XSL• FO
RenderX
JOURNAL OF MEDICAL INTERNET RESEARCH Yu et al
care costs for those with comorbid diabetes and mental health retrospective analysis was performed to evaluate the machine
have been estimated to be US $4 billion to $9 billion greater learning model for detecting potential mental health risk from
than for those without these conditions [4]. However, proactive passive sensing signals leveraging data collected during
detection of mental health needs of people with diabetes could participants’ engagement in the Livongo for Diabetes program
facilitate early intervention, thereby improving their overall [14].
health and quality of life and reducing the health and economic
burdens placed on this population and the health care system
Livongo for Diabetes
as a whole. The Livongo for Diabetes program is a digital remote program
for the management of chronic condition focused on
Despite recommendations by the American Diabetes Association empowering members by providing education and tools to
and the United States Preventive Services Task Force to self-manage their diabetes through mobile technology. The
routinely evaluate people with diabetes for their mental health program offers members (1) a cellular-enabled, two-way
needs, only 25% to 50% of people with diabetes who have messaging device that measures blood glucose and delivers
depression receive a mental health diagnosis and intervention personalized insights; (2) free, unlimited blood glucose test
[5,6]. This gap in receiving care is a result of a shortage of strips; (3) real-time support from diabetes response specialists
mental health professionals available to offer assessment and available 24 hours a day, 7 days a week, 365 days a year; and
intervention, a lack of mental health knowledge among primary (4) access to certified diabetes care and education specialists
care providers who most often care for patients with diabetes, for support and goal setting. Further details on the Livongo for
and limited access to mental health screening tools in health Diabetes program and its efficacy in improving diabetes-related
care practices offering services to these patients [6]. Newer outcomes are available in the literature [15-17].
methods such as passive sensing and ecological momentary
assessments (EMAs) provide a more scalable, less effort- and Study Participants
time-intensive approach to information gathering and Study participants were defined as those individuals enrolled
assessment. Passive sensing refers to the capture of data about in the Livongo for Diabetes Program between January 1, 2018,
a person without any extra effort on their part [7]. EMA refers and February 28, 2020, who used their blood glucose meter at
to the repeated sampling of an individual’s behavior in real time least once (N=142,432). Approval was granted by the Aspire
within their natural environment [8]. Both methods can be Independent Review Board (#520160099). All participants
integrated into or with devices and services that people with provided consent to participate, and guidelines outlined in the
diabetes already utilize in their daily lives, such as blood glucose Declaration of Helsinki were followed.
meters, smartphones, and health coaching platforms
to enable the collection and processing of data in real time and Study Procedure
to provide context for real-time interventions [7]. The mental health status of each participant was verified through
available data from two sources that included data on
Although passive sensing and EMA have previously been
medications prescribed to and filled by participants and mental
examined in the general population, limited studies have focused
health–related interventions. Next, passive sensing signals were
on the detection of mental health needs among the diabetes
extracted from participants’ behaviors as they interacted with
population outside of using smartphones as data warehouses,
Livongo’s blood glucose meter, mobile app, web portal, and
relying on accelerometer, GPS, ambient light sensors, and call
coaching feature. Then, data sets were assembled by aggregating
log data [9,10]. Moreover, no known study to date has attempted
these signals per participant over various periods, creating
to detect mental health concerns in people with diabetes by
participant-period instances. Descriptive analyses were
using blood glucose meters despite the fact that individuals
conducted to understand the correlation between the signals and
living with diabetes are encouraged to engage with these devices
mental health status. Finally, demographic information and
at regular intervals, blood glucose monitoring has been found
passive sensing signals were entered into the model, training it
to be correlated with psychological effects, and engagement
to understand the relationships between these signals and the
with these devices and testing blood glucose levels are known
participants’ mental health status.
to be associated with mood or stress [11-13]. Further, blood
glucose meter data can be paired with data from other sources Study Population Identification
for a robust view of a person’s behavioral and emotional Identification of population cases and controls with respect to
profile. The primary aim of this study was to conceptualize, mental health conditions—which, in the context of labeling data
develop, and evaluate a novel approach using passive sensing for model training, we refer to as ground truth—was performed
for predicting mental health risk in people with diabetes. utilizing two data sources: (1) claims data and (2) medication
prescription data. Claims data contained information on
Methods medications indicated for mental health conditions that were
prescribed to and filled by participants, as well as mental
Study Design
health–related assessments and interventions. Based on data
A multidisciplinary team of experts in data science, machine availability and right to use, 6.1% (8633/142,432) of the study
learning, and clinical and experimental psychology collaborated participants had claims data, which provided a diverse way to
in the development of a machine learning model for detecting identify their mental health needs through diagnoses, procedures,
potential mental health risk from passive sensing signals that and prescriptions. Medication prescription data contained only
was both clinically relevant and statistically rigorous. A information on mental health–related medications that were
https://www.jmir.org/2021/8/e27709 J Med Internet Res 2021 | vol. 23 | iss. 8 | e27709 | p. 2
(page number not for citation purposes)
XSL• FO
RenderXJOURNAL OF MEDICAL INTERNET RESEARCH Yu et al
prescribed to and filled by participants. Medication prescription demographic characteristics, which were used to evaluate signals
data were available for the entire study population and used to correlated with mental health in the study population, are
identify cases for the remaining participants. Participant summarized in Table 1.
Table 1. Participant demographics and characteristics at the time of enrollment (N=142,432).
Characteristic Value
Age in years, mean (SD) 54.8 (12.4)
Gender, n (%)
Female 68,968 (48.4)
Male 73,147 (51.6)
Other 317 (0.22)
Ethnicity, n (%)
Hispanic 12,809 (9.0)
Non-Hispanic 86,116 (60.5)
Unknown 43,507 (30.6)
Race, n (%)
Caucasian 66,551 (46.7)
Black or African American 14,702 (10.3)
Asian 8199 (5.76)
Pacific Islander 468 (0.33)
American Indian 725 (0.51)
Other 6,588 (4.63)
Unknown 45,199 (31.7)
Diabetes type, n (%)
Type 1 14,360 (10.1)
Type 2 126,369 (88.7)
Unknown 1603 (1.2)
Years since diagnosis, mean (SD) 8.27 (8.1)
First reported A1c, mean (SD) 7.51 (1.7)
Insulin use, n (%)
Yes 39,153 (27.5)
No 102,622 (72.1)
Unknown 657 (0.5)
Demographics
Passive Sensing Signals
Demographic factors such as age, gender, ethnicity, and race
All data utilized in the study were collected in the course of
have been shown to be related to mental health [18]. Therefore,
how participants naturally engaged with the Livongo for
we included participants’ demographic data into the model.
Diabetes Program. That is, no data were collected solely for
study purposes. We identified various data sources potentially Glucometer Data
useful to detect mental health risk behaviors. From these data The Livongo blood glucose meter is the most frequent
sources, we extracted 83 individual signals that can be broadly interaction point for participants of the Livongo for Diabetes
classified into the following four categories. Note that individual Program. Low rates of blood glucose monitoring [2] and poorer
signal names are withheld to protect proprietary information. blood glucose control [19] have been linked to depression among
those with diabetes; and depression, anxiety, and stress
symptoms are greater among people with diabetes than those
without [20]. Differences in device usage is particularly
informative of conditions such as depression when examining
https://www.jmir.org/2021/8/e27709 J Med Internet Res 2021 | vol. 23 | iss. 8 | e27709 | p. 3
(page number not for citation purposes)
XSL• FO
RenderXJOURNAL OF MEDICAL INTERNET RESEARCH Yu et al
usage time of day [10] and weekday [21]. Therefore, the key 2. How often are those without mental health needs (controls)
metrics derived from glucometer usage included the number of correctly identified?
times blood glucose was checked; blood glucose levels; and 3. How often are those with predicted mental health needs
variations, responses to questions to assess context such as truly cases?
current emotional state, and time of the day and day of week
The following seven measures commonly used in machine
when the reading was taken.
learning model evaluation [24] were selected to address the
Coaching Data above questions and beyond, enabling a holistic view of model
In the Livongo for Diabetes Program, Livongo coaches contact performance:
individuals under certain conditions. Numerous studies have 1. Sensitivity or recall, which addresses question 1
affirmed relationships between sociability and mental health. 2. Specificity, which addresses question 2
Fewer calls and fewer incoming texts have been linked to 3. Precision, which addresses question 3
depression [22], whereas frequency and duration of 4. Area under the curve (AUC), defined as the area under the
conversations have been shown to be useful in evaluation of receiver operating characteristic curve—an important
bipolar disorder [23]. Coaching data can serve as a proxy for measure quantifying the model’s capacity to differentiate
sociability, for which successful or failed contacts and time cases and controls (1=ideal performance, 0.5=random
spent interacting can be used to glean valuable insights. prediction)
5. F1 score, defined as the harmonic mean of the precision and
Event Data
recall
In addition to the blood glucose meter, individuals enrolled in 6. Accuracy, defined as the proportion of instances correctly
the Livongo for Diabetes Program interact with multiple
classified
platforms during program participation, including the Livongo 7. The confusion matrix, which depicts the number of correctly
mobile app and web portal. In following the motivations behind
and incorrectly identified cases and controls
utilizing glucometer and coaching data, we collected frequency,
duration, interactivity, and consistency of interaction sessions, Model Development
as well as the time of day and day of week information To develop our machine learning model, we then had to divide
associated with the use of the mobile app and web portal. In the study population into two segments. The first segment,
addition, we tracked voluntary report sharing with friends and termed the training and validation set, enabled the model to
family as well as interactions with pop-up reminders. learn. The second segment, termed the test sets, was held
Statistical Analyses separate from model training and used to evaluate the model’s
ability to generalize to unseen data. For training, we used a
We conducted correlation analyses using Pearson r to
time-interval slice of the population consisting of 124,322
preliminarily gauge the strength of the relationship between
participants (ie, 87% of the study population) who had activated
each extracted signal and the presence of mental health
their blood glucose meters in 2018 or 2019, with passive sensing
conditions. Among the most highly correlated signals,
signal data collected in that timeframe. For testing, we defined
demographics were well represented, including gender (male:
three distinct test sets designed to comprehensively evaluate
r=–0.156, PJOURNAL OF MEDICAL INTERNET RESEARCH Yu et al
Furthermore, the demographic information for each subset is The rationale for the first criterion is trivial. The second
detailed in Multimedia Appendix 1. eligibility condition reflects the reasoning that a model for
identifying mental health needs from passive signals should
To increase the model utility, passive signals were aggregated
only be employed when a signal is present, specifically signals
during a certain period (participant-period) and presented to the
where missingness cannot be assumed to be zero (eg, blood
model for prediction of mental health risk. We defined the
glucose values). Thus, our model should only be trained and
participant-period as an instance. In this study, an aggregation
evaluated on complete instances. Table 3 demonstrates the
window of 4 weeks was selected to optimize data availability.
distribution of eligible instances among the data subsets. Note
Furthermore, two additional conditions were applied to filter
the class imbalance, with control instances represented at
out ineligible participant-period instances: (1) instances before
roughly a 2:1 ratio over case instances in each data subset.
a participant had participated in the Livongo Program and (2)
instances of extended inactivity, defined as 30 or more days
without any interaction with the Livongo for Diabetes Program.
Figure 1. Source and date ranges of data subsets defined in this study.
Table 2. Number of participant cases and controls for each data subset.
Data subset Cases, n (%) Controls, n (%) Subset total, n
Training or validation set 42,481 (34.2) 81,841 (65.8) 124,322
Test set 1 31,251 (33.5) 61,904 (66.5) 93,155
Test set 2 2919 (30.8) 6558 (69.2) 9477
Test set 3 3358 (38.9) 5275 (61.1) 8633
Total unique 48,758 (34.2) 93,674 (65.8) 142,432
Table 3. Number of participant-period cases and controls for each data subset.
Data subset Cases, n (%) Controls, n (%) Subset total, n
Training and validation set 287,311 (34.3) 549,183 (65.7) 836,494
Test set 1 54,709 (33.3) 109,550 (66.7) 164,259
Test set 2 2953 (30.8) 6640 (69.2) 9593
Test set 3 34,190 (40.1) 51,150 (59.9) 85,340
Total 379,163 (34.6) 716,523 (65.4) 1,095,686
A machine learning model was enlisted to capture the a differing perspective of the data. We utilized soft voting to
relationship between input activity features and exhibited mental obtain an output prediction for a given instance, meaning the
health needs. The core component of our approach was the outputs of each constituent model—a value from 0 to 1
training of LightGBM [25] gradient tree boosting models on interpretable as the confidence that an instance is a case—were
random subsets of the training data. This approach addressed averaged to obtain a single aggregate confidence score.
the class imbalance; we undersampled the training control
Our final devised model consists of an ensemble of 10
instances by random undersampling, thus reducing the number
LightGBM models. During our model selection process, we
of control instances to equal the number of case instances.
evaluated multiple other classes of machine learning models,
Because this technique reduced the number of control instances
including logistic regression, random forests, and neural
by roughly half, we saw the opportunity to train multiple models
networks. We also experimented with other flavors of gradient
on multiple random subsets. This strategy enabled us to fully
boosting, including XGBoost and CatBoost, and overall,
utilize the entire training data set, with each model training on
https://www.jmir.org/2021/8/e27709 J Med Internet Res 2021 | vol. 23 | iss. 8 | e27709 | p. 5
(page number not for citation purposes)
XSL• FO
RenderXJOURNAL OF MEDICAL INTERNET RESEARCH Yu et al
LightGBM yielded the highest performance for our training the second test set. However, it is important to note that owing
task. To tune each constituent model, we used automated to class imbalance, 0.5 would not be the theoretical precision
hyperparameter tuning enabled by the hyperopt [26] Python or the F1 score yielded by random prediction. Rather, the
library with 5-fold cross-validation on the training set. Following precision obtained by random prediction would be the proportion
this training procedure, we evaluated the model on the three of cases, with the F1 score affected commensurately. In our
held-out test sets to assess model performance. case, baseline precision would be approximately 0.3331 for the
first test set and 0.3078 for the second, both of which were well
Results outperformed by the reported precisions of 0.4702 and 0.4164.
Likewise, the baseline theoretical F1 score of 0.3810 was greatly
The results of our model’s performance on each of the
outperformed by the reported 0.4953 on the second test set.
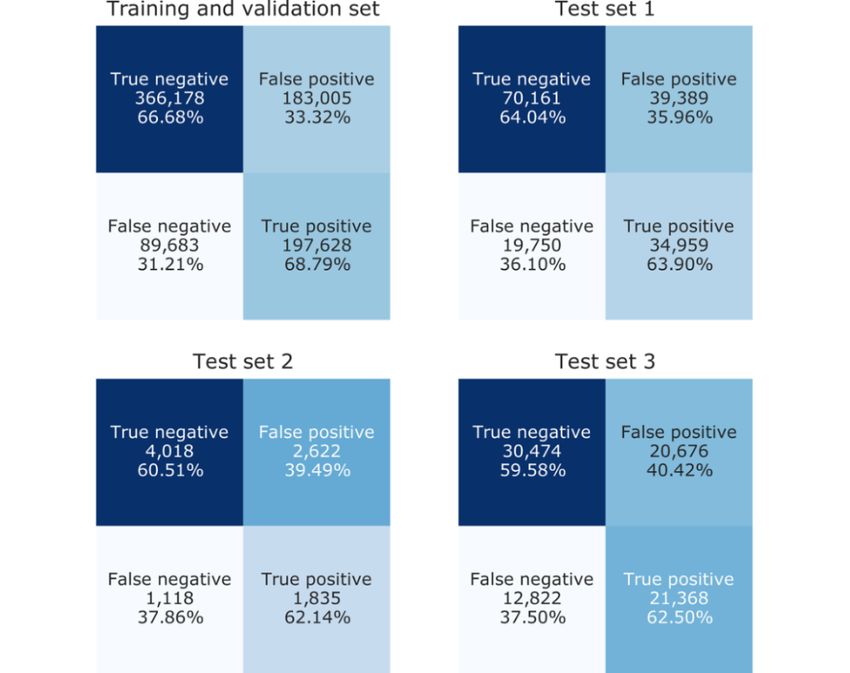
previously described data subsets are presented in Table 4. In
Concerning improvement over random prediction overall, our
addition, the associated confusion matrices are shown in Figure
model produced an approximately 14-point gain in precision
2, with both counts and percentages (normalized by class support
for the first test set and an approximately 10-point gain for the
size) depicted. Across all three test sets, the vast majority of
second and third sets, whereas recall improved by 14 and 12
metrics exceeded 0.5. Notably, we achieved an AUC of nearly
points and AUC improved by 20 and 16 points, respectively.
0.7 on the first test set and exceeded 0.65 across all three sets.
These results demonstrate a respectable, generalizable
The metrics for which the model fell short of the 0.5 mark were
performance and are an encouraging advancement towards
precision in the first and second test sets and the F1 score for
practical passive mental health risk assessment at scale.
Table 4. Performance metrics for each data subset.
Data subset Sensitivity Specificity Precision AUCa F1 Score Accuracy
Training and validation set 0.688 0.667 0.519 0.745 0.592 0.674
Test set 1 0.639 0.640 0.470 0.696 0.542 0.640
Test set 2 0.621 0.605 0.412 0.658 0.495 0.610
Test set 3 0.625 0.596 0.508 0.656 0.561 0.608
a
AUC: area under the curve.
https://www.jmir.org/2021/8/e27709 J Med Internet Res 2021 | vol. 23 | iss. 8 | e27709 | p. 6
(page number not for citation purposes)
XSL• FO
RenderXJOURNAL OF MEDICAL INTERNET RESEARCH Yu et al
Figure 2. Confusion matrices for each data subset.
Our model results also provided the opportunity to gain further sensing signals, responses indicating an emotional state of
insight into the utility of the passive sensing signals. For this wellness or unwellness during blood glucose checks were
purpose, we used the SHapley Additive exPlanations (SHAP) deemed the most important. Interaction frequency and
method [27] to compute feature importance, allowing us to consistency were also considered valuable according to SHAP.
quantify the average contribution of each signal to the model. The model took into particular consideration blood glucose
These values are presented in Table 5. Our findings closely checks based on the times of day and the proportion of days
mirrored the insights from our correlation analysis. they were performed. Mean and SD values of blood glucose
Demographics ranked highly among signals, with gender and levels also appeared in the top quartile of signals.
race identified as the two most relevant factors. Among passive
https://www.jmir.org/2021/8/e27709 J Med Internet Res 2021 | vol. 23 | iss. 8 | e27709 | p. 7
(page number not for citation purposes)
XSL• FO
RenderXJOURNAL OF MEDICAL INTERNET RESEARCH Yu et al
Table 5. Feature importance as measured by mean absolute SHapley Additive exPlanations (SHAP) values, interpreted as the average impact on model
output (log-odds) magnitude. Note that aliases based on the signal category are depicted in lieu of the signals to protect proprietary information.
Passive signal Mean absolute SHAP value
Demographics 1 0.152
Demographics 2 0.089
Glucometer data 1 0.078
Demographics 3 0.040
Glucometer data 2 0.039
Demographics 4 0.037
Demographics 5 0.037
Event data 1 0.022
Demographics 6 0.018
Event data 2 0.017
Glucometer data 3 0.014
Glucometer data 4 0.013
Glucometer data 5 0.012
Glucometer data 6 0.012
Glucometer data 7 0.011
Demographics 7 0.011
Glucometer data 8 0.011
Glucometer data 9 0.010
Glucometer data 10 0.008
Glucometer data 11 0.008
Glucometer data 12 0.008
Glucometer data 13 0.007
Event data 3 0.006
Event data 4 0.006
Glucometer data 14 0.006
Glucometer data 15 0.006
Event data 5 0.006
Event data 6 0.005
Glucometer data 16 0.005
Event data 7 0.005
Event data 8 0.004
Event data 9 0.004
Event data 10 0.004
Glucometer data 17 0.004
Event data 11 0.003
Glucometer data 18 0.003
Coaching data 1 0.003
Glucometer data 19 0.002
Event data 12 0.002
Event data 13 0.002
Coaching data 2 0.002
https://www.jmir.org/2021/8/e27709 J Med Internet Res 2021 | vol. 23 | iss. 8 | e27709 | p. 8
(page number not for citation purposes)
XSL• FO
RenderXJOURNAL OF MEDICAL INTERNET RESEARCH Yu et al
Passive signal Mean absolute SHAP value
Event data 14 0.002
Event data 15 0.002
Glucometer data 20 0.002
Event data 16 0.002
Coaching data 3 0.001
Event data 17 0.001
Event data 18 0.001
Coaching data 4 0.001
Event data 19 0.001
Event data 20JOURNAL OF MEDICAL INTERNET RESEARCH Yu et al
feedback on their blood glucose levels and share data with
Discussion others. Such meters and associated apps host behavioral,
In this study, we found that a machine learning approach using communication, and physiological data similar to what we used
passive sensing signals that included data on participant in our model. There is also a plethora of health-related apps that
demographics, blood glucose meter use, interaction with diabetes enable individuals to track their food intake, physical activity,
coaches as a proxy for sociability, and engagement with the mood, sleep, and other health signals. These apps host additional
Livongo for Diabetes Program demonstrated utility in predicting behavioral and emotional data similar to what we used in our
mental health risk among people with diabetes. model.
The results of our approach invite further exploration and Identifying potential mental health risk from passively collected
expansion. It is well understood that smartphones can be viewed signals is undoubtedly not a simple task, and our study has some
as vehicles for passive data collection and help identify digital limitations. First, because we limited our extracted signals to
phenotypes of mental health disorders, as shown previously interactions with Livongo devices and applications, we did not
[28]. However, it is time to move beyond focusing on have access to certain passive signals shown to be predictive in
smartphones as the only devices that enable passive sensing previous studies, such as mobile device accelerometer, ambient
and EMA and view other devices and services that people with light sensor, or GPS data. As a result, our model was given a
diabetes must use for their self-management as robust data somewhat restricted view of a member’s activity and sociability
warehouses. In this particular study, participants who enrolled patterns. Second, we had access to a limited volume of medical
in the Livongo for Diabetes Program had access to a and pharmacy claims data, which made it difficult to utilize the
Bluetooth-enabled blood glucose meter for measuring their data on their own. However, both limitations could also be seen
blood glucose levels, the Livongo mobile app and web platform as strengths of our study. Our inability to access previously
for tracking food intake and physical activity as well as receiving studied passive signals afforded us an opportunity to examine
health reminders, and Livongo coaches for coaching for diabetes new signals from devices and services that are unique to people
self-management. Each device and service offered valuable data with diabetes. It may also be more acceptable from a privacy
to input in our model. The blood glucose meters provided access perspective. Furthermore, we had limited claims data;
to the participants’ behavioral, emotional, and physiological nevertheless, the data enabled us to confidently label participants
data, such as how they were feeling at the time of measuring as cases versus controls. Finally, a major strength of our study
their blood glucose level and the reading itself. The Livongo was the fact that, by design, no data were collected with active
mobile app and web platform enabled us to understand when participant input for the express purpose of detecting mental
participants were awake, using their smartphones, and engaged health risk. In that regard, our proposed approach makes
in a health-related activity. Coaching allowed us to understand real-world deployment more readily feasible, in contrast to other
whether participants were actively communicating with others. studies of passive sensing and EMA for mental health, which
Together, these different data sources enabled us to create a required active participant participation and extensive sensor
data set that combined behavioral, emotional, and physiological infrastructure.
factors into a holistic predictive algorithm. Although these In sum, our model is a bold step toward detecting potential
particular devices and services are unique to Livongo members, mental health risk passively and autonomously. In its nascent
there are ways to obtain similar data in the real world. For stage, we recommend integrating such a model with existing
example, several commercially available wireless and systems and services, while continuing to improve the quality
Bluetooth-enabled blood glucose meters connect to mobile apps and completeness of care that can be offered to those dealing
that enable people with diabetes mellitus to track and receive with mental health needs.
Conflicts of Interest
The authors own stock in Teladoc Health and are employees of Livongo Health, Inc.
Multimedia Appendix 1
Demographics distribution across various data sets.
[DOCX File , 20 KB-Multimedia Appendix 1]
References
1. National Diabetes Statistics Report, 2020. Centers for Disease Control and Prevention. URL: https://www.cdc.gov/diabetes/
data/statistics-report/index.html [accessed 2020-12-01]
2. Holt RIG, de Groot M, Golden SH. Diabetes and Depression. Curr Diab Rep 2014 Apr 18;14(6):1-17. [doi:
10.1007/s11892-014-0491-3]
3. Grigsby AB, Anderson RJ, Freedland KE, Clouse RE, Lustman PJ. Prevalence of anxiety in adults with diabetes: a systematic
review. J Psychosom Res 2002 Dec;53(6):1053-1060. [doi: 10.1016/s0022-3999(02)00417-8] [Medline: 12479986]
4. Egede LE, Walker RJ, Bishu K, Dismuke CE. Trends in costs of depression in adults with diabetes in the united states:
Medical Expenditure Panel Survey, 2004-2011. J Gen Intern Med 2016 Jun;31(6):615-622. [doi: 10.1007/s11606-016-3650-1]
[Medline: 26969312]
https://www.jmir.org/2021/8/e27709 J Med Internet Res 2021 | vol. 23 | iss. 8 | e27709 | p. 10
(page number not for citation purposes)
XSL• FO
RenderXJOURNAL OF MEDICAL INTERNET RESEARCH Yu et al
5. Diabetes and mental health. Centers for Disease Control and Prevention. URL: https://www.cdc.gov/diabetes/managing/
mental-health.html [accessed 2020-12-01]
6. Owens-Gary MD, Zhang X, Jawanda S, Bullard KM, Allweiss P, Smith BD. The importance of addressing depression and
diabetes distress in adults with type 2 diabetes. J Gen Intern Med 2019 Feb;34(2):320-324 [FREE Full text] [doi:
10.1007/s11606-018-4705-2] [Medline: 30350030]
7. Cornet VP, Holden RJ. Systematic review of smartphone-based passive sensing for health and wellbeing. J Biomed Inform
2018 Jan;77:120-132 [FREE Full text] [doi: 10.1016/j.jbi.2017.12.008] [Medline: 29248628]
8. Shiffman S, Stone AA, Hufford MR. Ecological momentary assessment. Annu Rev Clin Psychol 2008;4:1-32. [doi:
10.1146/annurev.clinpsy.3.022806.091415] [Medline: 18509902]
9. Marsch LA. Digital health data-driven approaches to understand human behavior. Neuropsychopharmacology 2021
Jan;46(1):191-196 [FREE Full text] [doi: 10.1038/s41386-020-0761-5] [Medline: 32653896]
10. Sarda A, Munuswamy S, Sarda S, Subramanian V. Using passive smartphone sensing for improved risk stratification of
patients with depression and diabetes: cross-sectional observational study. JMIR Mhealth Uhealth 2019 Jan 29;7(1):e11041
[FREE Full text] [doi: 10.2196/11041] [Medline: 30694197]
11. AADE7 Self-Care Behaviors. Association of Diabetes Care & Education Specialists. URL: https://www.diabeteseducator.org/
living-with-diabetes/aade7-self-care-behaviors [accessed 2020-12-01]
12. Patton SR, Clements MA. Psychological reactions associated with continuous glucose monitoring in youth. J Diabetes Sci
Technol 2016 May;10(3):656-661 [FREE Full text] [doi: 10.1177/1932296816638109] [Medline: 26969141]
13. Fisher L, Polonsky W, Parkin CG, Jelsovsky Z, Amstutz L, Wagner RS. The impact of blood glucose monitoring on
depression and distress in insulin-naïve patients with type 2 diabetes. Curr Med Res Opin 2011 Nov;27 Suppl 3:39-46.
[doi: 10.1185/03007995.2011.619176] [Medline: 21916532]
14. Livongo.com. URL: https://www.livongo.com/ [accessed 2021-06-24]
15. Downing J, Bollyky J, Schneider J. Use of a connected glucose meter and certified diabetes educator coaching to decrease
the likelihood of abnormal blood glucose excursions: the Livongo for Diabetes Program. J Med Internet Res 2017 Jul
11;19(7):e234 [FREE Full text] [doi: 10.2196/jmir.6659] [Medline: 28698167]
16. Bollyky JB, Bravata D, Yang J, Williamson M, Schneider J. Remote lifestyle coaching plus a connected glucose meter
with certified diabetes educator support improves glucose and weight loss for people with type 2 diabetes. J Diabetes Res
2018;2018:3961730 [FREE Full text] [doi: 10.1155/2018/3961730] [Medline: 29888288]
17. Whaley CM, Bollyky JB, Lu W, Painter S, Schneider J, Zhao Z, et al. Reduced medical spending associated with increased
use of a remote diabetes management program and lower mean blood glucose values. J Med Econ 2019 Mar 08:1-9. [doi:
10.1080/13696998.2019.1609483] [Medline: 31012392]
18. Fleury M, Grenier G, Bamvita J, Perreault M, Jean-Caron. Typology of adults diagnosed with mental disorders based on
socio-demographics and clinical and service use characteristics. BMC Psychiatry 2011 Apr 20;11(67):1-11. [doi:
10.1186/1471-244x-11-67]
19. Lustman PJ, Anderson RJ, Freedland KE, de Groot M, Carney RM, Clouse RE. Depression and poor glycemic control: a
meta-analytic review of the literature. Diabetes Care 2000 Jul;23(7):934-942 [FREE Full text] [doi: 10.2337/diacare.23.7.934]
[Medline: 10895843]
20. Krishna P. Depression, anxiety, and stress levels in patients with type 2 diabetes mellitus. Natl J Physiol Pharm Pharmacol
2018;8(9):1570-1572. [doi: 10.5455/njppp.2018.8.0929117092018]
21. Saeb S, Lattie EG, Schueller SM, Kording KP, Mohr DC. The relationship between mobile phone location sensor data and
depressive symptom severity. PeerJ 2016;4:e2537 [FREE Full text] [doi: 10.7717/peerj.2537] [Medline: 28344895]
22. Ghandeharioun A, Fedor S, Sangermano L. Objective assessment of depressive symptoms with machine learning and
wearable sensors data. 2017 Presented at: Seventh International Conference on Affective Computing and Intelligent
Interaction; 2017; San Antonio, TX p. 325-332. [doi: 10.1109/acii.2017.8273620]
23. Abdullah S, Matthews M, Frank E, Doherty G, Gay G, Choudhury T. Automatic detection of social rhythms in bipolar
disorder. J Am Med Inform Assoc 2016 May;23(3):538-543. [doi: 10.1093/jamia/ocv200] [Medline: 26977102]
24. Japkowicz N, Shah M. Evaluating learning algorithms: a classification perspective. New York, NY: Cambridge University
Press; 2011.
25. Ke G, Meng Q, Finley T. LightGBM: a highly efficient gradient boosting decision tree. 2017 Presented at: 31st Conference
on Neural Information Processing Systems; 2017; Long Beach, CA.
26. Bergstra J, Yamins D, Cox D. Making a science of model search: hyperparameter optimization in hundreds of dimensions
for vision architectures. 2013 Presented at: Proceedings of the 30th International Conference on Machine Learning; 2013;
Atlanta, GA.
27. Lundberg S, Lee S. A unified approach to interpreting model predictions. 2017 Presented at: 31st Conference on Neural
Information Processing Systems; 2017; Long Beach, CA.
28. Zulueta J, Piscitello A, Rasic M, Easter R, Babu P, Langenecker SA, et al. Predicting mood disturbance severity with mobile
phone keystroke metadata: a BiAffect digital phenotyping study. J Med Internet Res 2018 Jul 20;20(7):e241 [FREE Full
text] [doi: 10.2196/jmir.9775] [Medline: 30030209]
https://www.jmir.org/2021/8/e27709 J Med Internet Res 2021 | vol. 23 | iss. 8 | e27709 | p. 11
(page number not for citation purposes)
XSL• FO
RenderXJOURNAL OF MEDICAL INTERNET RESEARCH Yu et al
Abbreviations
AUC: area under the curve
EMA: ecological momentary assessment
GAD: generalized anxiety disorder
SHAP: SHapley Additive exPlanations
Edited by R Kukafka; submitted 04.02.21; peer-reviewed by L Shen, P Nelson, E Sükei; comments to author 18.03.21; revised version
received 22.04.21; accepted 24.05.21; published 27.08.21
Please cite as:
Yu J, Chiu C, Wang Y, Dzubur E, Lu W, Hoffman J
A Machine Learning Approach to Passively Informed Prediction of Mental Health Risk in People with Diabetes: Retrospective
Case-Control Analysis
J Med Internet Res 2021;23(8):e27709
URL: https://www.jmir.org/2021/8/e27709
doi: 10.2196/27709
PMID:
©Jessica Yu, Carter Chiu, Yajuan Wang, Eldin Dzubur, Wei Lu, Julia Hoffman. Originally published in the Journal of Medical
Internet Research (https://www.jmir.org), 27.08.2021. This is an open-access article distributed under the terms of the Creative
Commons Attribution License (https://creativecommons.org/licenses/by/4.0/), which permits unrestricted use, distribution, and
reproduction in any medium, provided the original work, first published in the Journal of Medical Internet Research, is properly
cited. The complete bibliographic information, a link to the original publication on https://www.jmir.org/, as well as this copyright
and license information must be included.
https://www.jmir.org/2021/8/e27709 J Med Internet Res 2021 | vol. 23 | iss. 8 | e27709 | p. 12
(page number not for citation purposes)
XSL• FO
RenderXYou can also read