Regulating Subsidence and its uncertainty in the Dutch Wadden Sea
←
→
Page content transcription
If your browser does not render page correctly, please read the page content below

Tenth International Symposium on Land Subsidence (TISOLS)
Proc. IAHS, 382, 63–70, 2020
https://doi.org/10.5194/piahs-382-63-2020                                                                             Open Access
© Author(s) 2020. This work is distributed under
the Creative Commons Attribution 4.0 License.

                   Regulating Subsidence and its uncertainty in
                              the Dutch Wadden Sea
                                       Johannes A. de Waal and Mathijs W. Schouten
                              State Supervision of Mines, The Hague, 2290 AA, the Netherlands
                                Correspondence: Johannes A. de Waal (j.a.dewaal@sodm.nl)

                                                     Published: 22 April 2020

       Abstract. At the start of gas production its effects on land subsidence are not certain. There are uncertainties
       in mechanisms, models and parameters. Examples are non-linear deformation of reservoir rock, fault transmis-
       sibility, behaviour of overlaying salt and aquifer activity. Looking back at historical cases in the Netherlands, a
       factor two or three difference between initial prediction and final outcome is quite common. As the Dutch regu-
       lator, SSM is tasked with assuring proper management by operators of the risks associated with land subsidence
       from natural gas production in The Netherlands. Large initial uncertainties can only be tolerated if operators
       can demonstrate that timely actions can still be taken when predefined subsidence limits are at risk of being
       exceeded now or in the future. The applied regulatory approach is illustrated by the case history of gas produc-
       tion induced subsidence in the Dutch Wadden Sea area. This environmentally highly sensitive UNESCO World
       Heritage Site is a natural gas province. Extensive legal, technical and organisational frameworks are in place to
       prevent damage to its natural values. Initial uncertainties in the predicted subsidence (rate) were later exacerbated
       by the detection of strong non-linear effects in the observed subsidence behaviour, leading to new concerns. It
       was realised that – depending on the underlying physical cause(s) – there will be a different impact on future
       subsidence. To assure proper management of the additional uncertainty by the operator, several improvements
       in the regulatory approach have been implemented. Possible underlying mechanisms had to be studied in depth
       and improved data analysis techniques were requested to narrow down uncertainties as time progresses. The
       approach involves intensified field monitoring, scenario’s covering the full range of uncertainties and a particle
       filter approach to handle uncertainties in predictions and measurements. Spatial-temporal double differences,
       production data and the full covariance matrix are used to confront scenario predictions against measurements
       and to assess their relative probability. The regulator is actively involved in assuring this integrated control loop
       of predictions, monitoring, updating, mitigation measures and the closing of knowledge gaps. The regulator in-
       volvement is supported in the Mining law and by appropriate conditions in the production plan assent. With the
       approach it can be confidently assured that subsidence (rate) will remain within the allowed range.

1   Introduction                                                    production project is difficult. A 100 %–200 % deviation in
                                                                    outcome compared to what was considered the most likely
The Dutch regulator State Supervision of Mines (SSM) is,            scenario at the start of production is not unusual (de Waal
amongst other things, tasked with the supervision of the risk       et al., 2012, 2015b). From the perspective of the regulator,
associated with land subsidence due to natural gas produc-          initial predictions with such large uncertainties can only be
tion. With half the country near sea level and some of the pro-     accepted if the operator can demonstrate – at any moment
duction activities near the unique natural areas of the Wad-        during the production period – that timely actions can still be
den Sea tidal flats, land subsidence from gas production is         taken when predefined subsidence limits are at risk of being
not an issue that is taken lightly in the Netherlands. Experi-      exceeded now or in the future. A scenario-based approach
ence over the last 50 years demonstrates that accurate predic-      with uncertainties reducing as time progresses and a contin-
tion of induced land subsidence at the early stages of a gas

Published by Copernicus Publications on behalf of the International Association of Hydrological Sciences.
64               J. A. de Waal and M. W. Schouten: Regulating Subsidence and its Uncertainty in the Dutch Wadden Sea

                                                                   Figure 2. When subsidence and sea level rise are balanced by (ex-
                                                                   tra) sedimentation, the intertidal flats are maintained, and the natural
                                                                   values are likely preserved.

                                                                   cept of “effective subsidence capacity” was developed (van
                                                                   Herk et al., 2010). It is the maximum human-induced sub-
                                                                   sidence that the affected area can robustly sustain. To deter-
                                                                   mine this “effective subsidence capacity”, the maximum vol-
                                                                   umetric rate of relative sea level rise that can be accommo-
                                                                   dated in the long term, without damaging the natural values
Figure 1. The Dutch Wadden Sea is part of a semi-contiguous UN-    of the Wadden Sea area, was established first. The volume
ESCO world heritage site that spans the coastline of The Nether-   of sediment that can be transported and deposited by nature
lands, Germany and Denmark. (© UNESCO; source: http://whc.
                                                                   into the tidal basin where the subsidence occurs ultimately
unesco.org, last access: 28 March 2020).
                                                                   determines the “limit of acceptable average subsidence rate”.
                                                                   The capability of the tidal basins to “capture” sediment is the
ued demonstration that control can be retained if reality starts   overall rate-determining step (Fig. 2). Effective subsidence
to deviate outside the expected range are crucial elements of      capacity is then the maximum average subsidence rate avail-
the regulatory approach. To achieve this SSM has stimu-            able for human activities. It is obtained by subtracting the
lated the development and application of advanced monitor-         subsidence volume rate “consumed” by natural relative sub-
ing and data analysis tools by operators as integral part of       sidence in the area (sea-level rise plus natural shallow com-
the regulatory framework (de Waal et al., 2012, 2015b). The        paction) from the total long-term acceptable subsidence vol-
need and realisation of these further advances in the regula-      ume rate limit.
tory approach are illustrated in this paper by the case history       In the operational procedure for mining companies, six-
of gas production induced subsidence in the environmentally        years-average expectation values of subsidence rates are used
sensitive Wadden Sea area in the Netherlands.                      to calculate the maximum allowable production rates. This is
                                                                   done under the provision that production will be reduced or
                                                                   halted if the expected or actual subsidence rate (natural +
2    The Wadden Sea case history                                   man induced) cannot be guaranteed not to exceed the limit
                                                                   of the acceptable subsidence rate now or in the future. The
The Wadden Sea (Fig. 1) is a large temperate coastal wetland       approach is known as the “Hand on the Tap” method. Mon-
system behind a chain of coastal barrier islands. It is one of     itoring and management schemes ensure that predicted and
the world’s most important wetlands and it is on the UN-           actual subsidence rates stay within the limit of acceptable
ESCO world heritage list, based on its rich diversity, unique      subsidence rate and that no damage is caused to the protected
morphodynamical features and its wildlife values. It is one of     nature. For further details see (van Herk et al., 2010) and (de
the Netherlands most notable nature conservation areas pro-        Waal et al., 2012).
tected under the European Birds and Habitats Directives. Gas
production from fields underneath the Wadden Sea is never-
theless permitted, but only under very strict conditions.          4   Challenges from observed subsidence delay

3    Existing regulatory framework                                 Initial uncertainties in the predicted subsidence (rate) of the
                                                                   Ameland field underneath the Wadden Sea were exacerbated
The key question underpinning the applied approach for the         by the observation of strongly non-linear (delayed) subsi-
Wadden Sea has always been: how much subsidence is ac-             dence during later stages of the production period, see e.g.
ceptable and at which rate? And from the regulator perspec-        (Houtenbos, 2015). These were not accounted for in the orig-
tive: how can it be reliably assured that (future) subsidence      inal subsidence scenarios. Initially the operator assumed that
will stay within these limits? To address the issue the con-       the unexpected behaviour resulted from bi-linear elastic be-

Proc. IAHS, 382, 63–70, 2020                                                                             proc-iahs.net/382/63/2020/
J. A. de Waal and M. W. Schouten: Regulating Subsidence and its Uncertainty in the Dutch Wadden Sea                                  65

                                                                     Figure 4. The area around Ameland is measured using a variety of
                                                                     techniques, with different spatial and temporal coverage density (©
                                                                     NAM; source: NAM, 2017).

Figure 3. Prognosis for the deepest point on the Wadden Isle of      sophisticated data assimilation technique was developed and
Ameland over time. The current (2019) prognosis for the eventual     used to test if – using field and surveyance data – it can be
subsidence is some 40 cm. During the first decades of production,    determined which of the remaining post-LTS-I mechanisms
subsidence prognoses were strongly adjusted after each observation   factually plays a role in the observed delay in the subsidence
survey (© NAM; source: NAM, 1998; Eysink, 1995).                     above the fields underneath the Wadden Sea. Apart from ad-
                                                                     dressing the three main objectives listed above, the LTS stud-
                                                                     ies generated a number of valuable spin-offs:
haviour of the reservoir rock. Later, a continued more or less
constant subsidence rate at much reduced reservoir depletion             – Software to manage large volumes of geodetic data;
rates was observed, and it became clear that this is too limited
an approach (NAM, 2015).                                                 – A procedure to combine GPS and benchmark data;
   It was realised that – depending on the underlying (com-
bination of) physical cause(s) – the impact on future sub-               – Improved, more formal and objective methods to iden-
sidence could be very different. In addition, it had become                tify and manage outliers in the geodetic observations;
clear that the observed steepness of the edges of the subsi-
                                                                         – An objective method to take noise in the geodetic data
dence bowl was much larger than predicted and that the ap-
                                                                           from shallow movements into account;
parent reservoir poromechanical compressibilities required
to match the geodetic data substantially differed from labo-             – The use of spatio-temporal double-differences and the
ratory compaction data (NAM, 2017). To assure proper man-                  full covariance matrix to confront subsidence predic-
agement of the uncertainty, several improvements were re-                  tions against geodetic survey data, eliminating the need
quested by the regulator to be developed and implemented                   for (assumed) stable reference points;
by the operator:
                                                                         – A solution to prevent ensemble collapse from occur-
  – Identification and in-depth study of possible mecha-                   ring while testing scenario’s against field data using an
    nisms that could be the cause of the observed subsi-                   ensemble-based data assimilation technique;
    dence behaviour;
                                                                         – An improved workflow to derive in-situ compaction
  – Improved data assimilation techniques to test if field                 from time-lapse GR-logs of signals from radioactive
    data can be used to assess which of the above mecha-                   bullets shot into the formation.
    nisms play(s) a role in the field;

  – Testing of the newly developed approach against the 30-
    year-plus production/subsidence history of the Ameland           5    LTS study organisation
    gas field located underneath the Wadden Sea.
                                                                     The study had to be carried out to the satisfaction of the
The project was coined LTS (Long Term Subsidence). The               Inspector General of Mines (the head of the State Super-
first phase (LTS-I) focussed on identifying possible and cred-       vision of Mines of the Netherlands). Its execution was an
ible physical causes for the observed delayed subsidence.            official condition for the approval of a number of Wadden
The second phase (LTS-II) focussed on applying this knowl-           Sea Field Development Plan updates. The aim of the study
edge against an actual Wadden Sea field case (Ameland). A            was to improve knowledge of the physical background of

proc-iahs.net/382/63/2020/                                                                           Proc. IAHS, 382, 63–70, 2020
66              J. A. de Waal and M. W. Schouten: Regulating Subsidence and its Uncertainty in the Dutch Wadden Sea

the measured time-dependent effects in the subsidence be-
haviour and its possible influence on expected subsidence in
the long term. The study was to lead to a better understand-
ing of the physical processes that explain the subsidence that
had already occurred, with the aim of improving the fore-
casting of future subsidence. The study had to be based on
generally accepted rules of physics, objective measurement
data and proven scientific methods. The LTS study was car-
ried out on the basis of a proposal by the operator: “Proposed
Research Program for Higher Order Subsidence Modelling
of The Netherlands Gas fields” (NAM, 2015). The proposal
included an overview of the historical development of exist-
ing practices, their identified deficiencies and a proposed re-
search program and deliverables for the LTS study. The doc-
ument resulted from framing and brainstorm sessions within
the operator organisation and with experts from SSM and
the TNO AGE group (that exclusively advises SSM and the
Ministry of Economic Affairs and Climate). Given the impor-
tance of the study, it was decided to establish an independent    Figure 5. Four quadrant summary of the LTS elements. Both mod-
LTS Steering Committee (the SC LTS). The LTS study was            els and measurements are assigned a functional and a stochastic de-
carried out by the operator and external parties (public uni-     scription. The LTS study aims at confronting these. Images from ©
                                                                  NAM; source: NAM (2017).
versities and research laboratories) with oversight provided
by the SC LTS and SSM. The Wadden Sea Academy – es-
tablished in 2008 with the task of providing a scientific ba-
                                                                  could explain the observed non-linear subsidence behaviour.
sis for the management of the natural and social values of
                                                                  The following six credible explanations were initially identi-
the Wadden Sea Region – was asked to create, facilitate and
                                                                  fied:
chair the SC LTS. The committee consisted of six interna-
tionally renowned experts in the fields of Geodesy, Exper-          1. The non-linearity is not real but an artefact from noise
imental Rock Mechanics, Theoretical Rock Mechanics and                 and uncertainties in the data;
Mining induced Subsidence. The SC LTS members were pro-
posed partly by the operator and partly by the Wadden Sea           2. Salt flow in thick layers of rock salt overlaying the gas
Society (an independent NGO). They were subsequently also              reservoir causes the observed delays;
accepted by the Wadden Academy. Chairman and Technical
Secretary for the committee were provided by the Wadden             3. Slow (delayed) depletion in underlaying and adjacent
Academy. Representatives from SSM and TNO-AGE partic-                  aquifers not captured in the modelling;
ipated in the SC LTS as observers. The members met on a
bi-annual basis between April 2013 and June 2015 to dis-            4. Non-equilibrium pressure diffusion within the reservoir
cuss progress and to provide guidance to the first phase of            during the initial production period;
the LTS study. Between meetings, separate discipline meet-
                                                                    5. Intrinsic non-linear and/or non-elastic in-situ reservoir
ings took place as well as telephone discussions and emails.
                                                                       rock compaction against pressure drop;
Regular meetings were organised by the Wadden Academy
to inform stakeholders from nature conservation and public          6. Collapse of high porosity reservoir rock intervals after
organisations about the project progress and to address their          reaching a large depletion of the initially strongly over-
questions and suggestions. For further details see (Wadden             pressured gas in the reservoir.
Academy, 2015).
   At the end of the project a fully independent review           The hypotheses were addressed in a number of separate dis-
was carried out at the request of SSM by an internation-          cipline studies. In addition, several other possible influences
ally renowned expert not involved in the LTS study (Teatini,      on the surface subsidence were studied. These included dif-
2017).                                                            ferent influence functions relating reservoir compaction to
                                                                  surface subsidence, effects of upscaling and the effects of
                                                                  a strongly heterogeneous and spatially variable overburden.
6    LTS Phase I                                                  The results of all studies carried out have been published
                                                                  in technical reports and scientific publications (NAM, 2015,
During the first phase of the study (LTS-I) the emphasis was      2017) and references therein. The outcomes are briefly sum-
on the identification and study of potential mechanisms that      marised below and in Fig. 5.

Proc. IAHS, 382, 63–70, 2020                                                                         proc-iahs.net/382/63/2020/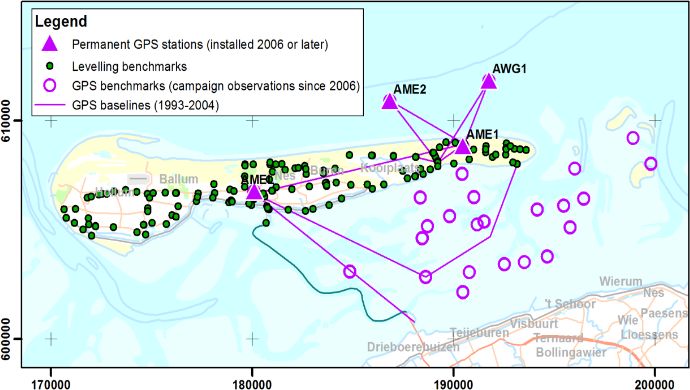
J. A. de Waal and M. W. Schouten: Regulating Subsidence and its Uncertainty in the Dutch Wadden Sea                            67

6.1   Noise and uncertainties                                      years) non-equilibrium gas pressure distribution within the
                                                                   reervoir rock that would strengthen its effective macroscopic
The studies carried out concluded that the observed non-
                                                                   compressibility (Mossop, 2012, 2015). Although not proven
linear subsidence behaviour is real and not an artefact of
                                                                   impossible, the mechanism seems unlikely and could not be
noise and/or uncertainties in the geodetic and other data. The
                                                                   made more plausible on the basis of the study. The hypothe-
hypothesis was therefore discarded. The studies did show
                                                                   sis was discarded.
that subsidence modelling precision can be improved signif-
icantly by taking correlation structures in the geodetic data
into account. Improved methods were developed for objec-           6.5    Non-linear and/or non-elastic reservoir rock
tive outlier identification and handling, data reduction tech-     Extensive long term (up to 12 weeks) laboratory compaction
niques for large geodetic data sets and for the processing         experiments under simulated in-situ conditions were carried
and use of GPS data (Samiei-Esfahany and Bähr, 2015),              out on Rotliegend reservoir rock samples: the gas-bearing
(Williams, 2015). The work was supported by the develop-           rock in the Wadden Sea gas fields (Hol et al., 2015). The
ment of a Bayesian framework to test and validate the quality      rock was sampled specifically for this study from the Wadden
of subsidence predictions against field measurements (Park         Sea Nes field. Results demonstrate that the compaction of the
and Bierman, 2015).                                                samples becomes increasingly inelastic (up to 80 %) at higher
                                                                   porosities and that the inelastic component remains consid-
6.2   Salt flow                                                    erable (some 50 %) at 20 % porosity (representative for the
                                                                   average in-situ reservoir rock). The laboratory derived inelas-
Extensive 1D and 3D modelling studies were carried out at
                                                                   ticity/creep turned out independent of temperature or the type
the University of Utrecht to assess the potential effect of salt
                                                                   of pore fluid over the ranges applied during the laboratory ex-
flow in the thick halite layers above the gas reservoirs in the
                                                                   periments. Overall, the compaction numbers measured dur-
Wadden Sea (Marketos et al., 2015). Results demonstrate that
                                                                   ing the laboratory measurements are comparable to those de-
– on its own – such salt flow cannot explain the observed
                                                                   rived from field data. To capture the observed inelastic creep
subsidence behaviour and in particular not its temporal be-
                                                                   behaviour a rate-type constitutive model (Pruiksma et al.,
haviour. Also, an observed translation of the subsidence bowl
                                                                   2015) was used in the subsequent (LTS2) subsidence mod-
over time is likely the result of changes in the reservoir de-
                                                                   elling to describe the constitutive behaviour of the Rotliegend
pletion pattern over time and not a result of salt flow. Nev-
                                                                   reservoir rock. Note that the degree of non-linear reservoir
ertheless, the studies demonstrate that salt flow can have an
                                                                   rock compaction (with pressure drop) in first order does not
effect on the shape of the subsidence bowl and on the time
                                                                   influence the shape of the subsidence model while it has a
evolution of subsidence, all very much depending on the val-
                                                                   large effect on the volume of the subsidence bowl at a given
ues of the in-situ salt material properties. Note that salt flow
                                                                   level of pressure depletion.
can influence the shape of the subsidence bowl but not its
volume.
                                                                   6.6    Pore collapse at high pressure depletion
6.3   Delayed aquifer depletion                                    The observed increase of subsidence rate would be due to
                                                                   “pore collapse” of weaker (high porosity) intervals in the
Aquifer pressure depletion and its uncertainty range play a
                                                                   reservoir at large amounts of pressure depletion during the
key role in the subsidence in the Wadden Sea. Important un-
                                                                   later stages of production. Such behaviour has been observed
certainties are how well the aquifers are connected to the
                                                                   during oil and gas production from chalk fields (Smits et al.,
gas bearing intervals, the permeability in the aquifers and
                                                                   1988), and in the laboratory for high porosity samples from
whether or not residual gas (significantly slowing down de-
                                                                   highly over-pressured sandstone gas fields (Schutjens and
pletion rates) is present. Existing reservoir engineering mod-
                                                                   de Ruig, 1997). At high enough effective stresses the phe-
els to calculate the effect of aquifer depletion were improved
                                                                   nomenon is observed for all porous rock but usually only at
taking new production and well data into account. Results
                                                                   stress levels far above the range that can occur in de Wadden
suggest that aquifer depletion is probably slower than origi-
                                                                   Sea gas fields. The option could be excluded by long term
nally assumed. Use of the reservoir engineering models un-
                                                                   laboratory experiments on high porosity Rotliegend reservoir
der different parameter assumptions allows the calculation of
                                                                   samples at effective stresses significantly exceeding those
alternative scenarios that can be tested against field produc-
                                                                   that can occur in-situ. The hypothesis was discarded (Hol et
tion and subsidence data.
                                                                   al., 2015).

6.4   Anomalous pressure diffusion within the reservoir
                                                                   7     LTS Phase II
The mechanism is based on the assumption that low perme-
ability areas within the reservoir and possibly even at the        During the second phase of the LTS study the emphasis was
microscopic pore level could result in a long-term (tens of        on testing the relevance of the credible explanations that sur-

proc-iahs.net/382/63/2020/                                                                       Proc. IAHS, 382, 63–70, 2020
68              J. A. de Waal and M. W. Schouten: Regulating Subsidence and its Uncertainty in the Dutch Wadden Sea

vived LTS-I in the real world and in particular for the ob-
served subsidence delays in the Wadden Sea. A probabilistic
Bayesian framework Ensemble based Subsidence Interpre-
tation and Prediction tool (ESIP), was developed by TNO
(Candela et al., 2017) to objectively confront a large set of
different scenarios against geodetic observations by calculat-
ing the match of the model with the data expressed by a χ 2
value. Next to delivering a probabilistic confrontation work-
flow, the tool also provides an objective statistical descrip-
tion of the outcome, i.e. an expectation case based on the
weighted average and a 95 % confidence interval of the pos-
terior model ensemble. TU Delft developed advanced geode-
tic processing software providing an interface between the
geodetic data and the confrontation workflow (van Leijen et
al., 2017).
   The operator subsequently tested a somewhat modified
version of the ESIP tool on the Ameland field underneath the
Wadden Sea (NAM, 2017) as recommended by the SC LTS
and as requested by SSM. The Ameland case was selected            Figure 6. Posterior scenarios within the 95 % confidence band stay
as the first test case given the long (30 year plus) production   below the long-term average subsidence rate limit (© NAM; source:
                                                                  NAM, 2017, Fig. 62).
history and the large set of reservoir, production and geodetic
survey data available for the field.

7.1   Scenarios tested

Some 58 history-matched pressure depletion scenarios were
tested. Each meets the (gas and water) production data and
the pressure data over the full Ameland field history while
covering a wide range of different aquifer depletion distri-
butions, with and without the presence of residual gas in the     Figure 7. The Wadden sea tidal flats just after sunset.
aquifers. For each of these pressure scenarios, parameter val-
ues of a generic RTICM subsidence model (Pruiksma et al.,
2015) and (van Thienen-Visser et al., 2015) and a (moving)           It is important to not only use the quality of fit of predic-
rigid basement influence function (Geertsma, 1966; van Op-        tions against double difference geodetic data as some simple
stal, 1973; Thienen-Visser and Fokker, 2017) were varied in       features of the misfit can then easily be missed. E.g. a rel-
a Monte Carlo simulation. The RTICM model was adapted             atively small lateral shift of the calculated subsidence bowl
to be able to handle the large amount of initial gas overpres-    relative to its measured position will result in none of the
sure in the Ameland field. A time dependent shape factor was      subsidence members achieving a good fit against the double
added to the influence function with a value dependent on the     difference geodetic data and ESIP’s discriminating capability
viscous behaviour of the salt layer above the reservoir. Each     will be lost. To identify and avoid such issues, visualisation
set of parameters drawn from the prior distributions during       and visual inspection of the predicted and measured subsi-
the Monte Carlo simulations results in a subsidence model         dence (contours) remains important.
member with the total set of members defining the ensemble.
When confronted against the geodetic data (the full covariant     8    Results
matrix of the spatio-temporal double differences), the result-
ing fit of each member defines its probability and thereby its    Using the ESIP, some 20 000 subsidence members, cover-
weight. The theory used to calculate the test metric accounts     ing the large range of possible parameter values were tested
for the uncertainties in both the geodetic data and the geo-      against the geodetic data for each of the 58 pressure scenarios
mechanical model and is based on a further development of         resulting in a total of more than one million members.
(Nepveu et al., 2010). Modifications were successfully made          The following results were obtained:
to the applied goodness-of-fit metric to avoid ensemble col-
lapse problems (Snyder et al., 2008) typical for particle fil-        1. Likely reservoir and aquifer depletion scenarios and pa-
tering methods involving a large number of independent vari-             rameter values for the subsidence model, salt flow and
ables (9 independent parameters in the present study).                   the influence function can be identified for Ameland;

Proc. IAHS, 382, 63–70, 2020                                                                          proc-iahs.net/382/63/2020/
J. A. de Waal and M. W. Schouten: Regulating Subsidence and its Uncertainty in the Dutch Wadden Sea 69
2. Posterior parameter uncertainties are much reduced rel- Acknowledgements. We thank the management of State Super-
ative to the prior distributions as more geodetic data be- vision of Mines for their permission to publish this paper. We also
comes available over time. In particular early measure- thank staff at TNO and NAM for stimulating discussions and sup-
ment campaigns already significantly narrow the uncer- port, although they may not agree with all the interpretations and
tainty for Ameland; conclusions of this paper.
3. Posterior RTICM parameters derived are consistent
with those derived from laboratory measurements (de References
Waal et al., 2015a);
Candela, T. G. G., Fokker, P. A., and Hegen, D.: Ensemble-based
4. The effect of lateral aquifers seems limited; subsidence interpretation and prediction ESIP: Technical Ref-
erence Manuel, TNO report R11278, January 2017, available
5. Salt flow alone cannot explain the observed time depen- at: https://nam-feitenencijfers.data-app.nl/download/rapport/
dent (delayed) subsidence; 630f8041-25d9-48cd-9329-1ef0d29fc708?open=true (last
access: 22 December 2019), 2017.
6. Extrapolations show that the likely scenarios within a de Waal, J. A., Roest, J. P. A., Fokker, P. A., Kroon, I. C., Breunese,
95 % confidence band will stay within the defined sub- J. N., Muntendam-Bos, A. G., Oost, A. P., and van Wirdum, G.:
sidence capacity including the longer term “acceptable The effective subsidence capacity concept: How to assure that
average subsidence rate” limit (Fig. 6); subsidence in the Wadden Sea remains within defined limits?,
Neth. J. Geosci., 91, 385–399, 2012.
7. Emergency stop scenarios demonstrate the feasibility of de Waal, J. A., van Thienen-Visser, K., and Pruiksma, J. P.: Rate
the “Hand on the Tap” approach with its effectiveness type isotach compaction of consolidated sandstone, in: Pro-
obviously decreasing towards the end of field life. ceedings 49th US Rock mechanics/Geomechanics symposium
(ARMA), San Francisco, 28 June–1 July, Volume: ARMA 15-
436, 2015a.
de Waal, J. A., Muntendam-Bos, A. G., and Roest, J. P. A.: Pro-
Data availability. This paper discusses the regulatory approach
duction induced subsidence and seismicity in the Groningen
developed to assure that gas production induced subsidence (rate)
gas field – can it be managed?, Proc. IAHS, 372, 129–139,
in the Dutch Wadden Sea area stays within pre-defined limits, de-
https://doi.org/10.5194/piahs-372-129-2015, 2015b.
spite large uncertainties in its prediction. The paper adds overview
Eysink, W. D., Dijkema, K. S., Smit, C. J., and van Dobben, H. J.:
and synthesis from the perspective of the regulator to the results of
Monitoring the effects of subsidence of the coastal island Ame-
studies carried out by or for the operator at the request of the regula-
land in the Wadden Sea, in: Proceedings 5th International Sym-
tor. No data other than that resulting from these studies is used. Data
posium on Land Subsidence, The Hague, 16–20 October 1995,
availability is via reference to the publications on these studies.
Balkema, Rotterdam, 259–267, 1995.
Geertsma, J.: Problems of Rock Mechanics in Petroleum Production
Engineering, in: Proceedings 1st Congress of the International
Author contributions. Both authors participated as observers on Society of Rock Mechanics, 25 September 1966, Lisbon, I, 585–
behalf of State Supervision of Mines on the LTS Steering Commit- 594, 1966.
tee. They provided regulatory perspective during the LTS studies Hol, S., van der Linden, A. J., Zuiderwijk P. M. M., and Marcelis,
carried out by the operator and external parties (public universities F. H. M.: Geomechanical experiments on Ten Boer rock samples
and research laboratories). Both authors were involved in reviewing from well Moddergat-3, Shell Report SR.15.11616, 2015.
the results of the LTS studies as they progressed and in assessing Houtenbos, A. P. E. M.: Bodemdaling Waddenzee 1997–
their consequences. The first author wrote the original draft with 2011, 38 pp., available at: http://www.waddenzee.nl/fileadmin/
data visualisation contributions, critical review, comments and revi- content/Bodemdaling/2007/AML07.pdf (last access: 22 Decem-
sions provided by the second author. ber 2019), 2015.
Marketos, G., Broerse, D. B. T., Spiers, C. J., and Govers,
R.: Long-term subsidence study of the Ameland gas field:
Competing interests. The authors declare that they have no con- time-dependence induced by rock salt flow, Report RUU,
flict of interest. Their employer SSM is an independent regulator 1874/328461, 2015.
concerned with the safety of people and the protection of the envi- Mossop, A.: An explanation for anomalous time dependent subsi-
ronment during energy extration and the exploitation of the subsur- dence, in: Proceedings. 46th US Rock Mechanics/Geomechanics
face, now and in the future. Symposium, 24–27 June 2012, Chicago, Illinois, USA, 12–518,
2012.
Mossop, A.: Derivation of a Scale Dependent Pressure Diffusion
Special issue statement. This article is part of the special issue Equation, NAM Report EP201506209300, 2015.
“TISOLS: the Tenth International Symposium On Land Subsidence NAM: Bodemdalingsprognose van Ameland – status rapport 1998,
– living with subsidence”. It is a result of the Tenth International NAM Report nr. 1998.09.000394, 1998.
Symposium on Land Subsidence, Delft, the Netherlands, 17–21 NAM: Wadden Sea Long term Subsidence Studies – Overview
May 2021. report, Report: EP201506209625, June 2015, available
proc-iahs.net/382/63/2020/ Proc. IAHS, 382, 63–70, 202070 J. A. de Waal and M. W. Schouten: Regulating Subsidence and its Uncertainty in the Dutch Wadden Sea at: http://feitenencijfers.namplatform.nl/download/rapport/ Thienen-Visser, K. and Fokker, P. A.: The future of subsidence mod- 2ca6c8d8-c0d4-4c10-8460-672f93b4cdaa?open=true (last elling: compaction and subsidence due to gas depletion of the access: 22 December 2019), 2015. Groningen gas field in the Netherlands, Neth. J. Geosci., 96, 105– NAM: Ensemble Based Subsidence application to the 116, 2017. Ameland gas field – long term subsidence study part van Herk, J., Roest, J. P. A., Kroon, I., Breunese, J. N., and de Waal, two (LTS II), Doc. nr. EP201710200509, available at: J. A.: How much subsidence is allowed: The introduction of the https://nam-feitenencijfers.data-app.nl/download/rapport/ effective subsidence capacity concept in The Netherlands, Proc. 2a2da56c-faee-4453-a8a7-c64c43b418a6?open=true (last IAHS, 339, 420–425, 2010. access: 22 December 2019), 2017. van Leijen, F., Esfahany, S. S., van der Marel, H., and Hanssen, R.: Nepveu, M., Kroon, I. C., and Fokker, P. A.: Hoisting a red flag: A standardized approach for the integration of geodetic data for An early warning system for exceeding subsidence limits, Math. deformation analysis, in: 2017 IEEE International Geoscience Geosci., 42, 187–198, 2010. and Remote Sensing Symposium: International Cooperation for Park, T. and Bierman, S.: A Bayesian framework for validating and Global Awareness, IGARSS 2017 – Proceedings. Vol. 2017-July comparing models for prediction of surface displacements due to Institute of Electrical and Electronics Engineers Inc., 8127112, reservoir compaction, Shell report SR13. 11680, 2015. 957–960 2017. Pruiksma, J. P., Breunese, J. N., Thienen-Visser, K., and de van Opstal, G. H. C.: The effect of base-rock rigidity on subsidence Waal, J. A.: Isotach formulation of the rate type compaction due to reservoir compaction, in: Proc. 3rd Congress of the Int. model for sandstone, I. J. Rock Mech. Min. Sci., 78, 127–132, Soc. of Rock Mech., Denver, II, Part B, 1102–1111, 1974. https://doi.org/10.1016/j.ijrmms.2015.06.002, 2015. van Thienen-Visser, K., Pruiksma, J. P., and Breunese, J. N.: Com- Samiei-Esfahany, S. and Bähr, H.: Research and Development paction and subsidence of the Groningen gas field in the Nether- Project for Geodetic Deformation Monitoring – Contribution lands, Proc. IAHS, 372, 367–373, https://doi.org/10.5194/piahs- to the research project: “Long-term study on anomalous time- 372-367-2015, 2015. dependent subsidence in the Wadden Sea Region”, NAM report Wadden Academy: Appraisal of the long-term subsidence study EP201505216980, 2015. of the Wadden Sea region, Technical Report, 14 pp., June Schutjens, M. T. M. and de Ruig, H.: The influence of stress path on 2015, available at: https://www.waddenacademie.nl/fileadmin/ compressibility and permeability of an overpressurised reservoir inhoud/pdf/03-Thema_s/Geowetenschap/Bodemdaling/ sandstone: Some experimental data, Phys. Chem. Earth, 22, 97– Appraisal-LTS-studydef30062015.pdf (last access: 22 De- 103 1997. cember 2019), 2015. Smits, R. M. M., de Waal J. A., and Kooten, J. F. C.: Prediction of Williams, S.: Description of GPS uncertainties within the Long- abrupt reservoir compaction and surface subsidence due to pore Term Study on Anomalous Time-Dependent Subsidence, Nat. collapse in carbonates, SPE Formation Evaluation, 3, June 1988. Oceanographic Centre, Liverpool, 2015. Snyder, C., Bengtsson, T., Bickel, P., and Anderson, J.: Obstacles to high-dimensional particle filtering, Mon. Weather Rev., 136, 4629–4640, 2008. Teatini, P.: The nog term subsidence study of the Wadden Sea Re- gion – review LTS2 final report – Comessa N3E 11/16, April 2017. Proc. IAHS, 382, 63–70, 2020 proc-iahs.net/382/63/2020/
You can also read