Space-Time Machine Learning Models to Analyze COVID-19 Pandemic Lockdown Effects on Aerosol Optical Depth over Europe
←
→
Page content transcription
If your browser does not render page correctly, please read the page content below
remote sensing
Article
Space-Time Machine Learning Models to Analyze COVID-19
Pandemic Lockdown Effects on Aerosol Optical Depth
over Europe
Saleem Ibrahim *, Martin Landa, Ondřej Pešek, Karel Pavelka and Lena Halounova

                                          Department of Geomatics, Faculty of Civil Engineering, Czech Technical University in Prague,
                                          166 29 Prague, Czech Republic; martin.landa@fsv.cvut.cz (M.L.); ondrej.pesek@fsv.cvut.cz (O.P.);
                                          karel.pavelka@fsv.cvut.cz (K.P.); lena.halounova@fsv.cvut.cz (L.H.)
                                          * Correspondence: saleem.ibrahim@fsv.cvut.cz

                                          Abstract: The recent COVID-19 pandemic affected various aspects of life. Several studies established
                                          the consequences of pandemic lockdown on air quality using satellite remote sensing. However, such
                                          studies have limitations, including low spatial resolution or incomplete spatial coverage. Therefore,
                                          in this paper, we propose a machine learning-based scheme to solve the pre-mentioned limitations
                                          by training an optimized space-time extra trees model for each year of the study period. The results
                                          have shown that our trained models reach a prediction accuracy up to 95% when predicting the
                                          missing values in the MODIS MCD19A2 Aerosol Optical Depth (AOD) product. The outcome of the
                                          mentioned scheme was a geo-harmonized atmospheric dataset for aerosol optical depth at 550 nm
                                with 1 km spatial resolution and full coverage over Europe. As an application, we used the proposed

                                          machine learning based prediction approach in AOD levels analysis. We compared the mean AOD
Citation: Ibrahim, S.; Landa, M.;
                                          levels between the lockdown period from March to June in 2020 and the mean AOD values of the
Pešek, O.; Pavelka, K.; Halounova, L.
                                          same period for the past 5 years. We found that AOD levels dropped over most European countries
Space-Time Machine Learning
                                          in 2020 but increased in several eastern and western countries. The Netherlands had the most
Models to Analyze COVID-19
                                          significant average decrease in AOD levels (19%), while Spain had the highest average increase (10%).
Pandemic Lockdown Effects on
Aerosol Optical Depth over Europe.
                                          Moreover, we analyzed the relationship between the relative percentage difference of AOD and four
Remote Sens. 2021, 13, 3027.              meteorological variables. We found a positive correlation between AOD and relative humidity and a
https://doi.org/10.3390/rs13153027        negative correlation between AOD and wind speed. The value of the proposed prediction scheme is
                                          further emphasized by taking into consideration that the reconstructed dataset can be used for future
Academic Editors: Maria João Costa        air quality studies concerning Europe.
and Daniele Bortoli
                                          Keywords: aerosol optical depth; CAMS; COVID-19; machine learning; MODIS
Received: 22 June 2021
Accepted: 29 July 2021
Published: 2 August 2021

                                          1. Introduction
Publisher’s Note: MDPI stays neutral
                                               The Severe Acute Respiratory Syndrome-COronaVIrus Diseases 2019 (SARS-COVID-
with regard to jurisdictional claims in
                                          19) pandemic made humanity reconsider how to adapt their daily activities. By late June
published maps and institutional affil-
                                          2020, the EU average infection rate was around 160 per million inhabitants [1]. In general,
iations.
                                          most European countries started applying restrictions in March 2020. These restrictions
                                          included lockdown, contain, various kinds of curfew, mandatory face masks, etc. By
                                          18 March 2020, more than 250 million people in Europe were in lockdown [2].
                                               Despite the unfortunate losses in human lives and the economy, there could be a bright
Copyright: © 2021 by the authors.
                                          side to this pandemic when it comes to air quality. Some studies showed that air quality
Licensee MDPI, Basel, Switzerland.
                                          has improved under the applied restrictions. For example, only two weeks of lockdown
This article is an open access article
                                          reduced urban air pollution in Spain, with essential differences among pollutants. The most
distributed under the terms and
                                          considerable reduction was in black carbon and Nitrogen Dioxide (NO2 ) by 45–51% [3].
conditions of the Creative Commons
Attribution (CC BY) license (https://
                                               According to data released in 2019–2020 by the National Aeronautics and Space
creativecommons.org/licenses/by/
                                          Administration (NASA) and the European Space Agency (ESA), NO2 was reduced up to
4.0/).                                    30% in some regions that were highly affected by COVID-19 lockdowns such as Wuhan in

Remote Sens. 2021, 13, 3027. https://doi.org/10.3390/rs13153027                                        https://www.mdpi.com/journal/remotesensing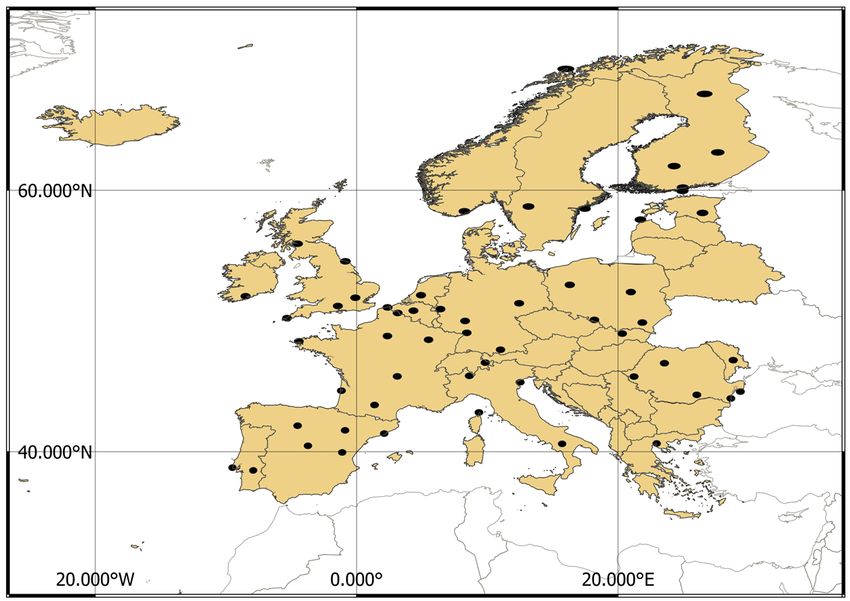
Remote Sens. 2021, 13, 3027                                                                                         2 of 13

                              China, Italy, Spain, and the USA [4]. Similar results were found in Poland when comparing
                              air quality observations for the year 2020 in five major cities with the same time periods
                              as in the previous two years. In addition, AOD concentrations were reduced in April and
                              May of 2020 by nearly 23% and 18% as compared to 2018–2019 [5].
                                    During the lockdown in China, there was a significant drop in NO2 (−37%), SO2
                              (−64%), and AOD (−8%) for the year 2020, when compared with the 11 year mean average
                              (2009–2019) [6]. Another study of the eastern part of China, where AOD levels are usually
                              high (AOD > 0.7), showed that the emission of pollutants in the first three months of
                              2020 has decreased when compared to the same period of the previous year [7]. In India,
                              the AOD level was greatly decreased (~45%) during the COVID-19 lockdown periods
                              compared to the mean AOD level in the previous 20 years [8]. Similarly, significant
                              reductions in black carbon concentration (~8.4%) and AOD (10.8%) were observed in
                              southern India during the first lockdown period (25 March–14 April 2020) when compared
                              to the pre-lockdown period (1–24 March 2020) over the selected measuring location [9].
                                    In this study, we focused on AOD, which is defined as a measure of the columnar
                              atmospheric aerosol content. High AOD concentrations have a negative impact on all
                              living things by affecting the respiratory system and reducing naked eye visibility. AOD is
                              measured either from ground-based stations or retrieved by satellites measurements. AOD
                              satellite-based products provide a vast spatial coverage compared to the limited number of
                              ground stations [10].
                                    Due to the correlation between AOD and particulate matter (PM), AOD satellite
                              products are commonly used to retrieve surface PM [11–13]. This justifies the increasing
                              interest in AOD satellite products. Many sensors retrieve AOD at different spatial and
                              temporal resolutions [14], such as the Total Ozone Mapping Spectrometer (TOMS) [15],
                              the Ozone Monitoring Instrument (OMI) [16], the Sea-viewing Wide Field-of-view Sensor
                              (SeaWiFS) [17], the Geostationary Operational Environmental Satellite (GOES) [18], the
                              Advanced Himawari Imager (AHI) [19], the Multi-angle Imaging SpectroRadiometer
                              (MISR) [20], and the widely used Moderate Resolution Imaging Spectroradiometer (MODIS)
                              which we used in our study.
                                    MODIS instrumentations have been carried on both the Terra and Aqua satellites in
                              sun-synchronous polar orbits, since 1999 and 2002, respectively. They can record the earth’s
                              surface reflectance and emittance with a 2330 km swath every one to two days [21]. MODIS
                              measures 36 spectral bands between 0.4 and 14.4 µm wavelengths at many different spatial
                              resolutions that provide a great opportunity to study the aerosol thickness and parameters
                              characterizing aerosol size from space with good accuracy and on a worldwide scale.
                                    MODIS provides various AOD products based on different aerosol retrieval algo-
                              rithms. The most common algorithms are the Dark Target (DT) [22,23], the Deep Blue
                              (DB) [24,25], and the Multi-Angle Implementation of Atmospheric Correction for MODIS
                              (MAIAC) [26] which is the algorithm used to generate the MODIS MCD19A2 product with
                              1 km spatial resolution.
                                    However, AOD satellite-based products have a great number of gaps due to cloud
                              cover and snow reflectance. An analysis of the spatial and temporal distribution of clouds
                              retrieved by MODIS over 12 years of continuous observations from the Terra satellite and
                              over 9 years from the Aqua satellite showed that clouds cover ~67% of the earth’s surface
                              worldwide and ~55% over land [27]. To solve this issue, it has become common to use
                              machine learning and deep learning algorithms in developing models that fill the gaps
                              in satellite-based products either by removing the clouds [28], applying spatiotemporal
                              interpolation [29], or merging different sources of data to predict gaps-free images [30].
                              Therefore, in this study, we propose a machine learning-based scheme to fill the gaps in
                              MODIS MAIAC AOD retrievals and to generate daily, full coverage, high-resolution AOD
                              maps over Europe. Such maps will minimize time series analysis bias and uncertainty
                              while investigating the influence of COVID-19 lockdown on AOD levels.
Remote Sens. 2021, 13, x FOR PEER REVIEW 3 of 14
Remote Sens. 2021, 13, 3027 3 of 13
maps over Europe. Such maps will minimize time series analysis bias and uncertainty
while investigating the influence of COVID-19 lockdown on AOD levels.
2. Material
2. Material and
and Data
Data
2.1. Study Area and Period
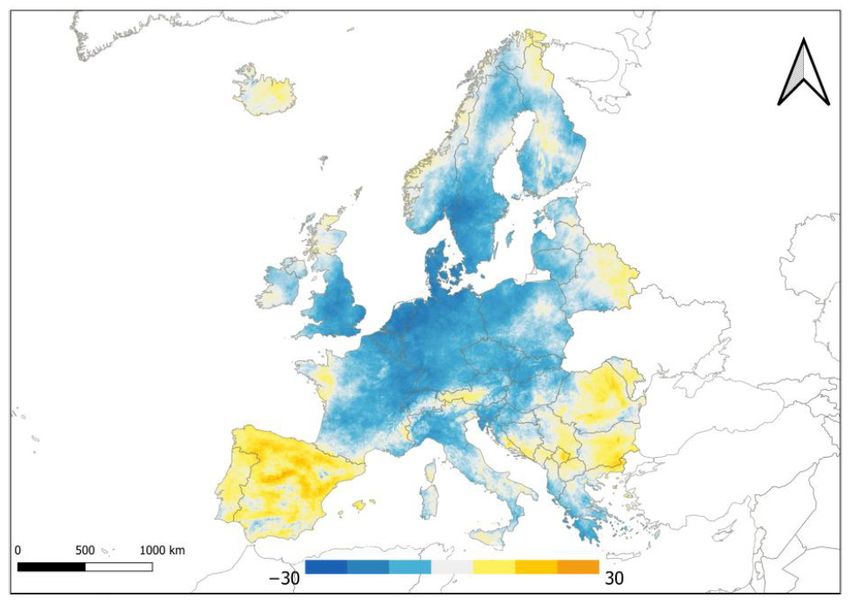
shown in
The study area is shown in Figure
Figure 1.
1. It includes
includes the
the “Continental
“Continental EU,” hence EEA EEA
(European Economic Area), and the the United
United Kingdom,
Kingdom, Switzerland,
Switzerland, Serbia,
Serbia, Bosnia
Bosnia and
and
Montenegro, Kosovo,
Herzegovina, Montenegro, Kosovo, North
North Macedonia,
Macedonia, and and Albania
Albania [31].
[31]. In this paper,
paper, we
we
refer to the area of study as “Europe”
“Europe” located
located inside
inside this
this coordinates
coordinatesbox
box26 ◦ W,
26° W,72 ◦ N,
72° N, 42 ◦
42°
E, and 36 ◦
36° S. The total study area covers 13,391,504 of 1 km grid cells; 5,450,009
5,450,009 of
of the
the total
total
located over
cell number are located over land.
land. The study period covers the the months
months of of March–June
March–June
from the years 2015–2020.
Figure 1. The study area with AERONET stations shown as black dots.
2.2. Data
2.2. Data
In
In this
this section,
section, we
we summarize
summarize different
different data
data used
used throughout
throughout our
our study.
study.
2.2.1. MODIS Data
2.2.1. MODIS Data
MCD19A2 daily product from MODIS collection 6 was released and made publicly
MCD19A2 daily product from MODIS collection 6 was released and made publicly
available on 30 May 2018. It was generated from both the Aqua and Terra satellites and
delivered on
available 30 May 2018.Data
in Hierarchical It was generated
Format from both the
[26]. MCD19A2 has Aqua
a 1 kmand Terraresolution
spatial satellites and
and
delivered in Hierarchical Data Format [26]. MCD19A2 has a 1 km spatial resolution
uses the MAIAC algorithm that utilizes time series (TMS) analyses, a set of image-based and and
uses the
pixel MAIACtoalgorithm
processing enhance thethat utilizes of
precision time series
cloud (TMS) analyses,
recognition, AOD, and a set of image-based
other atmospheric
rectification [32,33]. Daily MODIS MCD19A2 data were downloaded, andand
and pixel processing to enhance the precision of cloud recognition, AOD, twoother at-
science
mospheric rectification [32,33]. Daily MODIS MCD19A2 data were downloaded,
datasets (SDS) were extracted; AOD green band (at 550 nm) and AOD quality assurance and two
science
layer datasets (SDS)
(AOD_QA), whichwere
wasextracted; AOD green
used to retrieve band (at
only pixels with550 nm)
the bestand AODWe
quality. quality as-
created
surance layer (AOD_QA), which
daily mosaics that cover the study area.was used to retrieve only pixels with the best quality.
We created daily mosaics that cover the study area.
2.2.2. Copernicus Atmosphere Monitoring Service (CAMS) Data
In this study, modeled AOD at 550 nm data with 80 km spatial resolution produced
by the European center for medium-range weather forecasts Atmospheric Composition
Reanalysis 4 (EAC4) was used to fill the gaps in the MODIS MCD19A2 product. Reanalysis
merges model data with worldwide observations into a compatible dataset generated by an
atmospheric model that uses the laws of physics and chemistry. EAC4 estimates modeled
AOD every 3 h using the 4D-Var assimilation method [34].
2.2.3. Digital Elevation Model
The elevation of the grid cells was added as a land predictor in our study. The Japan
Aerospace Exploration Agency (JAXA) provides a worldwide digital surface model for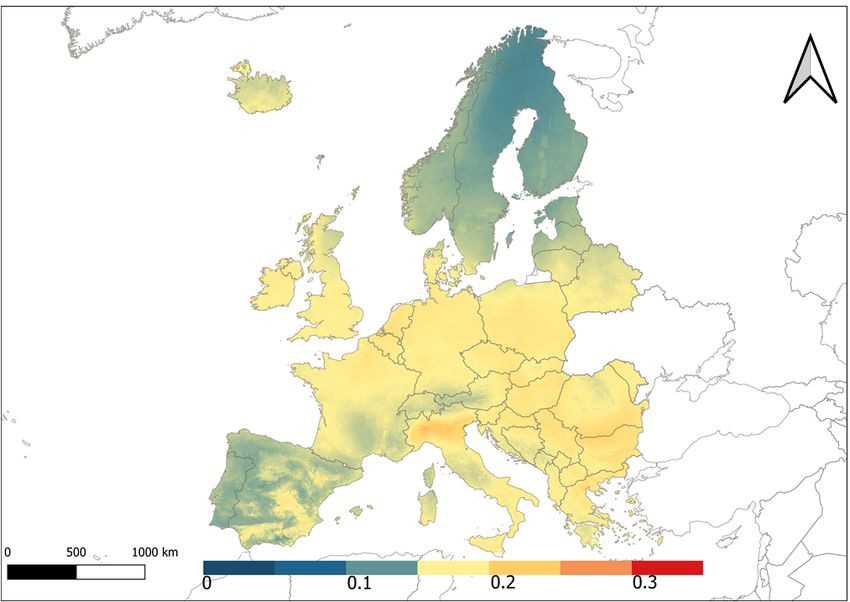
Remote Sens. 2021, 13, 3027                                                                                                  4 of 13

                              scientific research and other geospatial services. It provides a horizontal resolution (~30 m)
                              by the Panchromatic Remote-sensing Instrument for Stereo Mapping (PRISM), which was
                              carried on the Advanced Land Observing Satellite “ALOS” [35]. Data was accessed in
                              March 2021 from (https://www.eorc.jaxa.jp/ALOS/).

                              2.2.4. Ground-Based AOD Data
                                   NASA’s Aerosols Robotic Network (AERONET) is considered one of the most reliable
                              aerosol networks [36]. AERONET measures direct solar and sky radiance in various
                              channels every 15 min at the local point to compute columnar AOD at intervals from 350 to
                              1020 nm with low expected uncertainties ranging between 0.01 to 0.02 under cloud-free
                              conditions [37]. There are several categories of AERONET data: level 1.0 (unscreened),
                              level 1.5 (cloud screened), and level 2.0 (cloud screened and quality assured).
                                   In this study, AERONET level 2.0 quality assurance observations were used from
                              57 stations over Europe, as shown in Figure 1. Since AERONET stations do not measure
                              AOD at 550 nm, available measurements at the nearest two wavelengths to 550 nm (440 or
                              500 nm as λ1 and 675 nm as λ2 ) for each station were interpolated to 550 nm using the
                              Ångström’s turbidity equation represented in Equation (1) [21,38].

                                                                     τa (λ) = βλ−α                                                 (1)

                              where τa (λ) is the AOD at λ wavelength in micrometers, β is the Angstrom’s turbidity
                              coefficient, and α is the band index represented in Equation (2).

                                                                       ln(τa (λ1 )/τa (λ2 ))
                                                               α=−                                                                 (2)
                                                                           ln(λ1 /λ2 )

                                   AOD values at two different wavelengths λ1 , λ2 are related by Equation (3).
                                                                                              −α
                                                                                          λ1
                                                              τa (λ1 ) = τa (λ2 ) ∗                                                (3)
                                                                                          λ2

                              2.2.5. European Centre for Medium-Range Weather Forecasts reanalysis (ECMWF)
                                   ERA-5 is the fifth generation of ECMWF reanalysis for the global climate and weather.
                              Hourly data between 10 a.m. and 2 p.m. of U and V wind components, total precipitation,
                              and 2 m surface temperature for the months of March–June of the years 2015–2020 with
                              0.1◦ spatial resolution were extracted from the ERA-5 land hourly data. Relative humidity
                              data between 10 a.m. and 2 p.m. at 0.25◦ spatial resolution was extracted from the ERA-5
                              monthly averaged data.
                                   All used data shown in Table 1 were reprojected to the European Terrestrial Reference
                              System 1989 (EPSG:3035), using a 1 km grid cell with bilinear interpolation method for
                              CAMSAOD and ECMWF data and the cubic convolution for the ALOS elevation model. All
                              values of MODISAOD , CAMSAOD, and elevations were assigned to the closest grid cell.

                                       Table 1. Summary of data used in this study.

            Product            Spatial Resolution        Temporal Resolution                              Layer
           MODIS                                                                                         AOD-055
                                      1 km                       Daily
          MCD19A2                                                                                 Quality Assurance (QA)
            CAMS                     80 km                        3h                       Total aerosol optical depth at 550 nm
          ALOS DSM                    30 m                         -                                     Elevations
          AERONET                       -                       ~15 min                                   Level 2.0
                                                                                                Wind U and V components
            ECMWF
                                      0.1◦                      Hourly                               Total precipitation
             ERA-5
                                                                                                  2 m surface temperature
            ECMWF
                                     0.25◦                      Monthly                              Relative humidity
             ERA-5
Remote Sens. 2021, 13, 3027                                                                                             5 of 13

                              3. Methodology
                                    In this study, we created a Geo-Harmonized Atmospheric Dataset for Aerosol opti-
                              cal depth (GHADA) that covers the study area. Three stages were applied to generate
                              GHADA: first, we merged the Terra and Aqua datasets of the MODIS MCD19A2 prod-
                              uct by applying a simple average for all pixels that passed the quality assurance criteria
                              (QACloudMask = Clear and QAAdjacencyMask = Clear) of this product. Second, we created a
                              machine learning model for every year of the study period to predict AOD values over the
                              study area. MCD19A2 high-quality retrievals were used as the dependent variable, and
                              since the Terra satellite is passing locally around 10:30 a.m. and the Aqua satellite passes
                              around 1:30 p.m., we used the modeled AOD from CAMS at the closest three times per
                              day to the satellites passing (9 a.m., 12 p.m., and 3 p.m.). In addition, the spatiotemporal
                              information for the grid cells was used as independent variables. Finally, we filled MODIS
                              MCD19A2 gaps with the predicted AOD by merging the outputs from stages one and two.
                              We validated the daily maps of GHADA with ground-based observation, and then we
                              utilized this dataset to analyze how the COVID-19 lockdown has affected AOD levels over
                              Europe during the period of March–June 2020 by comparing AOD levels for this period
                              with the average AOD levels in the last five years (2015–2019) for the same months.

                              4. Space-Time Models
                                   In this section, we propose a novel approach based on the Extremely Randomized
                              Trees (ET) to predict the missing AOD values in the MODIS MCD19A2 product. First,
                              we illustrate the principles of the ETs and discuss their suitability for the AOD prediction
                              problem. Second, we describe in detail the proposed ET training and parameters setting
                              for AOD prediction.

                              4.1. Extra Trees Algorithm
                                   ET is a tree-based ensemble learning method used in our study to deal with the
                              supervised regression and create prediction models for AOD. The idea behind ET is to
                              strongly randomize the selection of both attributes and cut points while splitting a tree
                              node. Unlike the widely used random forest algorithm that chooses the optimum split, ET
                              chooses it randomly, which further reduces bias and variance. When needed, the latter
                              algorithm creates independent randomized trees of learning sample output values [38].
                                   The number of attributes that are randomly selected at each node (K) and the minimum
                              sample size for splitting a node (nmin ) are the two main parameters in the ET splitting
                              process. This procedure is applied several times with the whole learning dataset to create
                              an ensemble model that aggregates the predictions of the decision trees to obtain the final
                              estimation by majority vote in classification problems and arithmetic average in regression
                              problems. In addition to accuracy, ET has high computational efficiency [39], which is
                              required when dealing with big data problems.

                              4.2. Improved Spatiotemporal Information
                                   To determine the spatial and temporal correlation between MAIACAOD and CAMSAOD ,
                              we included the following independent variables. For space, we used both the elevations
                              of the grid cells and the great circle distance (D) between each grid cell and a reference
                              point on a sphere identified by their latitudes and longitudes using the haversine approach
                              (Equations (4)–(6)). For time, we used the day of the year (DOY) to calculate the radian
                              time (Rt) for the grid cells on different days in a year to improve model handling of the
                              seasonal cycle, Equation (7) [40].

                                  θ = ƒ(λi,t , ϕi,t ) = haversin(ϕ1 − ϕ2 ) + cos(ϕ1 ) ∗ cos(ϕ2 ) ∗ haversin(λ1 − λ2 )      (4)

                                                                             θ     1 − cos(θ)
                                                         haversin(θ) = sin2 ( ) =                                          (5)
                                                                             2           2
                                                                                               √
                                                    Di,t = r ∗ archaversin(θ) = 2 ∗ r ∗ arcsin   θ                         (6)
Remote Sens. 2021, 13, 3027                                                                                           6 of 13


                                                                                DOYi, t
                                                               Rti,t = cos 2π ∗                                          (7)
                                                                                  T
                              where θ is the central angle between two points in space, ϕ1 and ϕ2 denote the geographical
                              latitudes in radians of two points in space, λ1 and λ2 denote the geographical longitudes
                              in radians of two points in space, r denotes the earth’s radius in km, DOY represents the
                              day of the year, T represents the total number of days in the year, for every grid cell (i) on
                              day (t).
                                    For each year between 2015–2020, the model was built using Equation (8).

                                            AODi,t = ƒ(CAMS-9i,t , CAMS-12i,t , CAMS-15i,t , Di,t , Hi,t , Rti,t )       (8)

                              where for each grid cell (i) on day (t): AODi,t is the target AOD value, CAMS-x represents
                              the AOD value extracted from CAMS at hour x, Di,t represents the great circle distance,
                              Hi,t represents the elevation, Rti,t represents the temporal information identified by the
                              radian time.

                              5. Results
                                  In this section, we present the results of the space-time ET models when predicting
                              the MAIAC AOD values. Then we utilize these models to generate AOD maps over the
                              study area. The validation process is also stated below. Finally, these maps were used to
                              analyze the effects of COVID-19 lockdowns on AOD levels, as discussed in Section 5.4.

                              5.1. Models
                                    Due to the great number of MODISAOD -CAMSAOD pairs over land in the study
                              area (on average 380 million pairs per year), representative subsets consisting of ~10% of
                              the whole population (all MODISAOD -CAMSAOD pairs per year) were chosen using the
                              Kolmogorov–Smirnov test to be used as learning dataset for a space-time model for each
                              year. Then for each learning dataset, we used the k-fold cross-validation (where k = 5) to
                              train and validate each model. In this method, the learning dataset is divided into 5 folds,
                              which means 80% of the pairs in the learning dataset are used as a training set for the model,
                              and the remaining 20% are used for validation. This procedure was repeated five times
                              to test the model on each fold. Based on learning curve results, we found that increasing
                              the learning dataset size to 15% only increased the accuracy of the models by less than
                              1%, and the curve reaches a plateau beyond this percentage. Therefore, to decrease the
                              computational complexity, we used ~10% of the whole population as a learning dataset. In
                              other words, a learning dataset size of 10% is enough to reach satisfactory accuracy for each
                              year of the study period. The optimized models (number of trees = 30, maximum depth
                              of the tree = 50) were tested on the remaining ~90% (approximately 340 million pairs) of
                              the population.
                                    The results of the trained models for each year are summarized in Table 2. All models
                              achieved high accuracies when predicting MAIAC AOD with a correlation of determination
                              (R2 ) ranging between 92.5% to 95% and root mean squared errors from 0.016 to 0.02. These
                              high achieved accuracies with the relatively small errors show the efficiency of our space-
                              time models in predicting the missing AOD values and emphasize the appropriateness
                              of exploitation modeled AOD with improved spatiotemporal information in improving
                              satellite AOD data.
Table 2. Results of the space-time extremely randomized models used to predict the missing AOD
                              in the MODIS MCD19A2 product for each year of the study period.

                                    Year                   R-Squared (%)                        RMSE               MAE
Remote Sens. 2021, 13, 3027                                                                                                7 of 13
                                    2015                          95                            0.017              0.011

                                    2016                         94.3                           0.018              0.011
                              Table 2. Results of the space-time extremely randomized models used to predict the missing AOD in
                              the MODIS
                                    2017 MCD19A2 product for each   93.8year of the study period. 0.018             0.011

                                    2018Year               R-Squared
                                                                92.5 (%)               RMSE     0.02            MAE
                                                                                                                  0.012
                                       2015                      95                     0.017                   0.011
                                    2019
                                       2016                      92.9
                                                                94.3                    0.018   0.019              0.012
                                                                                                                0.011
                                       2017                     93.8                    0.018                   0.011
                                       2018
                                    2020                        92.5
                                                                 94.1                    0.02   0.016           0.012
                                                                                                                   0.010
                                       2019                     92.9                    0.019                   0.012
                                       2020                     94.1                    0.016                   0.010
                                   Feature importance was calculated based on the reduction in sum of squared errors
                              whenever a variable is chosen to split. Mean importance scores were calculated for all
                                   Feature importance was calculated based on the reduction in sum of squared errors
                              selected input variables of the models (see Figure 2). CAMSAOD at 12:00 p.m. is the most
                              whenever a variable is chosen to split. Mean importance scores were calculated for all
                              influential variable, accounting for ~33% of MODISAOD estimates. The other two modeled
                              selected input variables of the models (see Figure 2). CAMSAOD at 12:00 p.m. is the most
                              AOD at 9:00 a.m. and 3:00 p.m. contributed by 18% and 24%, respectively. The radian time
                              influential variable, accounting for ~33% of MODISAOD estimates. The other two modeled
                              and the great circle distance had almost the same influence (10–10.4%). Finally, the eleva-
                              AOD at 9:00 a.m. and 3:00 p.m. contributed by 18% and 24%, respectively. The radian
                              tion had
                              time andthe
                                        thelowest   influence,
                                            great circle       withhad
                                                         distance   ~5%  on MODIS
                                                                       almost      AOD estimates.
                                                                              the same  influence (10–10.4%). Finally, the
                              elevation had the lowest influence, with ~5% on MODISAOD estimates.

                              Figure 2. Mean importance scores (%) of independent variables to AOD estimates for the space-time
                              Figure 2. Mean
                              extremely      importance
                                        randomized      scores (%) of independent variables to AOD estimates for the space-time
                                                    models.
                              extremely randomized models.
                              5.2. AOD Maps
                                   We used the optimized space-time models to predict the missing values in the daily
                              MCD19A2 data of the study period. Then we used these predictions to fill the gaps in
                              this product. The outputs of the previous processes were daily AOD maps with 1 km
                              spatial resolution and full coverage over Europe for the period of March–June in the years
                              2015–2020. To analyze the COVID-19 lockdown effects on AOD levels, we calculated the
                              average AOD levels for the months’ March–June of the years 2015–2019 and compared
                              these levels with the same period of the year 2020 (see Figure 3). Moreover, we generated
                              daily AOD maps for the period of January 2018–June 2020 to validate GHADA through all
                              seasons and not solely during the chosen lockdown months.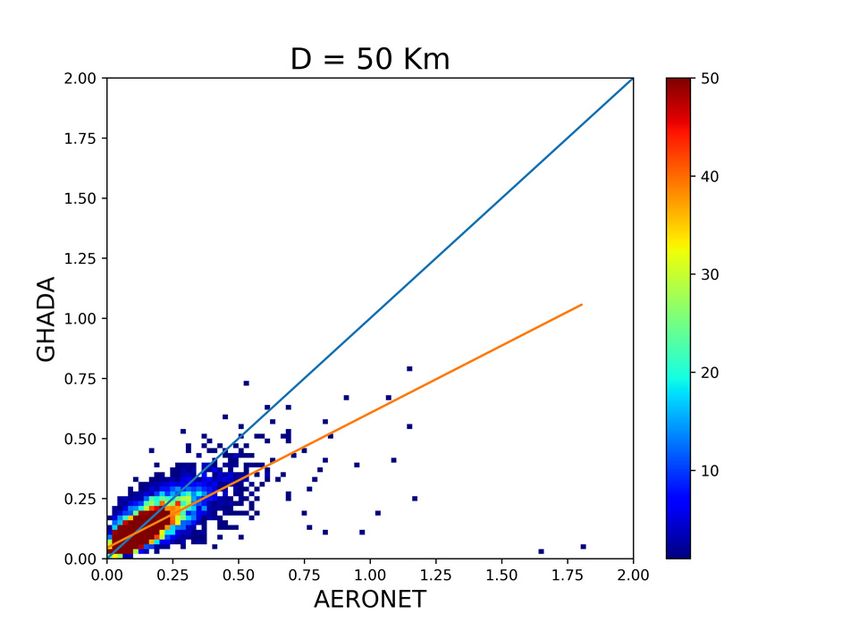
product. The outputs of the previous processes were daily AOD maps with 1 km spatial
resolution and full coverage over Europe for the period of March–June in the years 2015–
2020. To analyze the COVID-19 lockdown effects on AOD levels, we calculated the aver-
age AOD levels for the months’ March–June of the years 2015–2019 and compared these
levels with the same period of the year 2020 (see Figure 3). Moreover, we generated daily
Remote Sens. 2021, 13, 3027 8 of 13
AOD maps for the period of January 2018–June 2020 to validate GHADA through all sea-
sons and not solely during the chosen lockdown months.
(a) (b)
Figure
Figure3.3.The
Theaverage
averageAOD
AODvalues
valuesfor
forthe
themonths
monthsMarch–June
March–Juneofof(a)
(a)the
theyears
years2015–2019
2015–2019and
and(b)
(b)ofofthe
theyear
year2020
2020during
during
the
thechosen
chosenlockdown
lockdownperiod.
period.
5.3.
5.3.Validation
Validationwith
withAERONET
AERONET
Withthe
With theassumption
assumptionthat thatthe
theaerosol
aerosolcolumn
columnisisrelatively
relativelyuniform
uniformwithin
withinaacertain
certain
time-spaceboundary
time-space boundary[41],
[41],the
thevalidation
validationofofsatellite-based
satellite-basedAODAODproducts
productsisisusually
usuallyper-
per-
formedbetween
formed betweenAOD AOD retrievals
retrievals within the spatiotemporal
spatiotemporalwindow
windowand andthe
thecorresponding
correspond-
AERONET
ing AERONET observations [42].[42].
observations An acceptable accuracy
An acceptable of AOD
accuracy of products can be achieved
AOD products can be
when 66%
achieved whenof retrievals fall within
66% of retrievals fallexpected error envelopes
within expected (EE) [23,43].
error envelopes (EE) We usedWe
[23,43]. for
validation the average AERONET level 2.0 quality assurance observations
used for validation the average AERONET level 2.0 quality assurance observations be- between 10 a.m.
and 2 10
tween p.m. from
a.m. 57 2stations
and across
p.m. from 57Europe
stationsduring
acrossthe periodduring
Europe of January
the 2018–June 2020. We
period of January
chose two spatial diameters, 20 km and 50 km, with AERONET
2018–June 2020. We chose two spatial diameters, 20 km and 50 km, with AERONET stations in the center forsta-
val-
idation
tions andcenter
in the statistical analysis that
for validation andextensively
statistical uses root-mean-square
analysis that extensivelyerror (RMSE),
uses mean
root-mean-
absolute
square error
error (MAE),mean
(RMSE), expected errorerror
absolute (EE) (MAE),
envelopes, and the
expected fraction
error (EE) of AOD retrievals
envelopes, and theof
the totalofnumber
fraction (N) falling
AOD retrievals of within
the totalEEnumber
envelope(N)(Equations (9)–(13)).
falling within EE envelope (Equations
(9)–(13)). r
1
RMSE =
N ∑( AODGH ADA − AOD AERONET )2 (9)
RMSE = ∑( − ) (9)
1
MAE = ∑| AODGH ADA − AOD AERONET | (10)
MAE = N ∑| − | (10)
1
Bias =
Bias =N ∑∑(( AODGH ADA −− AOD AERONET )) (11)
(11)
EE = ± (0.05 + 0.15 ∗ AODAERONET ) (12)
EE = ± (0.05 + 0.15 ∗ AODAERONET) (12)
AODAERONET − |EE| ≤ AODGHADA ≤ AODAERONET + |EE| (13)
AODAERONET − |EE| ≤ AODGHADA ≤ AODAERONET + |EE| (13)
The statistical analysis between daily GHADA maps and AERONET observations
has shown similar validation results for the two chosen spatial diameters with ~84% of
the samples falling within the EE, good correlations R ~ 76–77%, and relatively small
RMSE ~ 0.066–0.067, refer to Table 3.
Table 3. Validation results of GHADA with AERONET at two spatial diameters, where N is the total
number of sample points.
D (Km) N R MAE RMSE Bias EE(%)
20 10916 0.762 0.043 0.067 −0.014 83.7
50 12212 0.767 0.043 0.066 −0.014 83.7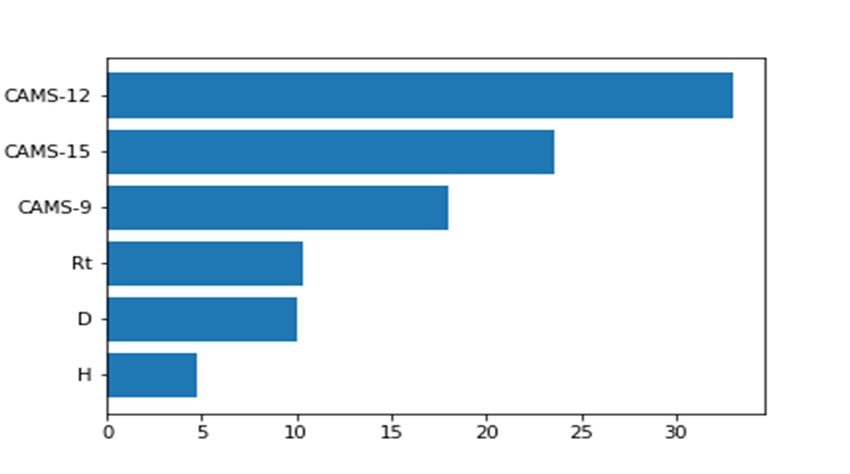
The statistical analysis between daily GHADA maps and AERONET observations
                                   has shown similar validation results for the two chosen spatial diameters with ~84% of
Remote Sens. 2021, 13, 3027        the samples falling within the EE, good correlations R ~ 76–77%, and relatively     9 ofsmall
                                                                                                                            13
                                   RMSE ~ 0.066–0.067, refer to Table 3.
                                        Figure 4 represents the density scatter plots for the validation of AOD at 550 nm from
                                   GHADA with the AERONET stations at the two chosen spatial diameters.
                                     Figure 4 represents the density scatter plots for the validation of AOD at 550 nm from
                                  GHADA with the AERONET stations at the two chosen spatial diameters.

      Figure 4. Density scatter plots of validation AOD at 550 nm from GHADA with 57 AERONET stations between 10 a.m. and
         Figure
      2 p.m.     4. Density
             at two         scatter plots
                    spatial diameters     of km
                                       of 20 validation AODThe
                                                 and 50 km.  at 550 nm from
                                                                colored scale GHADA
                                                                              bar standswith  57 AERONET
                                                                                         for the frequency ofstations between 10 a.m.
                                                                                                               occurrence.
         and 2 p.m. at two spatial diameters of 20 km and 50 km. The colored scale bar stands for the frequency of occurrence.
                                  5.4. AOD Relative Percentage Difference
                                     Table 3. Validation results of GHADA with AERONET at two spatial diameters, where N is the
                                        The variations in AOD levels were calculated for each grid cell using the Relative
                                     total number of sample points.
                                    Percentage Difference (RPD) Equation (14).
                                           D (Km)          N           R        MAE        RMSE         Bias        EE(%)
                                                                     AOD2020 − AOD2015–2019
                                             20          10916RPD = 0.762       0.043         ∗100
                                                                                            0.067      −0.014           (14)
                                                                                                                      83.7
                                                                            AOD2015–2019
                                             50          12212       0.767      0.043       0.066      −0.014         83.7
                                   where AOD2020 is the mean AOD value in the study period of 2020 and AOD2015–2019 is the
Remote Sens. 2021, 13, x FOR PEER REVIEW                                                                             10 of 14
                                       5.4.AOD
                                    mean   AOD value
                                                Relative
                                                      forPercentage
                                                          the studyDifference
                                                                    period covering 2015–2019. The changes are presented in
                                    Figure 5.
                                            The variations in AOD levels were calculated for each grid cell using the Relative
                                     Percentage Difference (RPD) Equation (14).
                                                                                                 –
                                                                   RPD =                                ∗ 100                           (14)
                                                                                            –

                                     where AOD2020 is the mean AOD value in the study period of 2020 and AOD2015–2019 is the
                                     mean AOD value for the study period covering 2015–2019. The changes are presented in
                                     Figure 5.

                                  Figure 5. Relative percentage
                                         5. Relative percentage difference
                                                                difference of AOD over Europe for the months March–June of the year
                                  2020 and the same months of the previous 5 years.

                                  6. Discussion
                                  6. Discussion
                                        In this
                                       In  this study,
                                                study,aamachine
                                                         machinelearning-based
                                                                  learning-basedscheme
                                                                                 schemewas
                                                                                         wasused toto
                                                                                              used  overcome
                                                                                                      overcomethethe
                                                                                                                   limitations in
                                                                                                                     limitations
                                  time  series  analysis concerning AOD.  A new  dataset for AOD  at 550 nm with   full
                                  in time series analysis concerning AOD. A new dataset for AOD at 550 nm with full cov-coverage
                                  over Europe
                                  erage           and with
                                         over Europe     and1with
                                                              km spatial resolution
                                                                  1 km spatial      (GHADA)
                                                                               resolution      was built.
                                                                                          (GHADA)         We trained
                                                                                                      was built.         an extra
                                                                                                                 We trained    an
                                  extra trees model for each year (2015–2020) using the MODIS MCD19A2 as the target var-
                                  iable and CAMS modeled AOD with improved spatiotemporal information as the inde-
                                  pendent variables. Results showed that the trained models had high accuracies ranging
                                  between 92.5–95% when estimating the missing MAIACAOD retrievals. We compared the
Remote Sens. 2021, 13, 3027 10 of 13
trees model for each year (2015–2020) using the MODIS MCD19A2 as the target variable
and CAMS modeled AOD with improved spatiotemporal information as the independent
variables. Results showed that the trained models had high accuracies ranging between
92.5–95% when estimating the missing MAIACAOD retrievals. We compared the AOD550
from GHADA and surface observations at 57 AERONET sites over Europe, with two spatial
diameters around these AERONET stations within the period of January 2018–June 2020.
The overall comparison with ground-based measurements showed a good correlation,
with a bias as low as 0.014 and R ~ 0.76. Then we used GHADA to study the influence of
COVID-19 pandemic lockdown on AOD levels over Europe in the months March–June by
comparing it to AOD levels in the same months for the past five years (2015–2019). The
most important advantage of our study when compared to similar work is that we used
daily full-coverage AOD maps with high spatial resolution when calculating the average
AOD values before and after the lockdown. Such complete coverage reduces bias and
uncertainty in such time-series analyses. As shown above, in Figure 5, we have found that
AOD levels decreased by 10–30% over most countries of the study area in 2020, mainly the
countries located at the center of the analyzed area, while AOD levels increased over the
countries that are located on the boundaries of the study area. In the west, AOD increased
over Spain and Portugal; in the east, AOD increased over Romania, Bulgaria, Moldova,
and Kosovo; in the north, the level slightly increased over Iceland. The decrease in AOD
levels was the greatest in the Netherlands, with an average decrease of 20%, while Spain
had the highest average increase in AOD levels by 10%. It must be noted that the five
AERONET stations in Spain included in this study did not reflect the average increase in
AOD over the whole country due to their limited spatial coverage.
As an attempt to justify the findings in areas of increased AOD, we investigated the
relationship between the RPD in AOD for the months March–June of the year 2020 and the
previous five years and the RPD for four meteorological variables (relative humidity, wind
speed, surface temperature, and total precipitation) calculated for the times of MODIS
satellites overpassing (10 a.m. to 2 p.m.). We found a close trend between relative humidity
and AOD. Spain, Portugal, northern Norway, eastern Belarus, and southern Bulgaria had
higher RPD in both AOD and relative humidity. Spain and Portugal had the highest
increase of 10–23% in relative humidity. In agreement, areas of decreased humidity had
lower RPD of AOD; however, such correlation is to a lower extent than the effect of
increased humidity. An exception to this finding is Romania, where RPD in humidity was
decreased however AOD was increased. Regarding wind speed, RPD decreased by ~18%
in Spain and Portugal, where AOD had a significant increase. Also, the northern part of
Italy and the western part of Austria had a clear inverse trend between AOD and wind
speed. The average relative humidity over Spain was 65% during the lockdown period
of the year 2020. High relative humidity combined with a low average wind speed of
less than ~3 m/s play an important role in increasing AOD. Our findings are consistent
with [44], where they associated higher humidity and lower wind speed with higher AOD.
We found no direct relationship between RPD of neither surface temperature nor total
precipitation and RPD of AOD, all of which strengthens the argument that lowering AOD
is a consequence of the lockdown. Although we proved that AOD levels increased over
Spain, other pollutants such as NO2 were decreased, which is attributed to the difference
in the source of these pollutants as discussed elsewhere [44]. Figure 6 shows the RPD of
relative humidity and RPD of wind speed between the lockdown months of the year 2020
and the same period of the previous five years.AOD. We found no direct relationship between RPD of neither surface temperature nor
total precipitation and RPD of AOD, all of which strengthens the argument that lowering
AOD is a consequence of the lockdown. Although we proved that AOD levels increased
over Spain, other pollutants such as NO2 were decreased, which is attributed to the dif-
ference in the source of these pollutants as discussed elsewhere [44]. Figure 6 shows the
Remote Sens. 2021, 13, 3027 11 of 13
RPD of relative humidity and RPD of wind speed between the lockdown months of the
year 2020 and the same period of the previous five years.
(a) (b)
Figure 6.
Figure 6. Relative Relative percentage
percentage difference
difference of of (a)
(a) relative relativeand
humidity humidity andspeed
(b) wind (b) wind
overspeed
Europeover Europe10 a.m. and
between
between
2 p.m. for the months10March–June
a.m. and 2 p.m. foryear
of the the months
2020 andMarch–June of the year
the same months of the2020 and the
previous same months of the
5 years.
previous 5 years.
Nevertheless, it must be noted that the average AOD levels over Europe are rela-
Nevertheless, it must
tively be noted
low (AOD thatcompared
< 0.3) the average to AOD
other levels over Europe
more polluted are relatively
regions, where more prominent
low (AOD < 0.3) comparedin
differences toAOD
otherlevels
more polluted regions, where
can be observed, more prominent
for example, as published differ-
in [8] where AOD
ences in AOD levels
levels can
overbeIndia
observed, for example,In
were investigated. asaddition,
published theinextent
[8] where AOD levels
of restrictions imposed and the
over India wereadherence
investigated. In addition,
to them the extent
may contribute of significance
to the restrictions imposed and the
of the change ad- levels.
in AOD
herence to them may contribute to the significance of the change in AOD levels.
7. Conclusions
7. Conclusions The advancement of machine learning algorithms provides solutions for AOD satellite-
based
The advancement data drawbacks
of machine such asalgorithms
learning low spatialprovides
resolution and gaps
solutions forcaused by persistent clouds,
AOD satel-
lite-based data drawbacks such as low spatial resolution and gaps caused by persistentfor studies that
cloud contamination, and high surface reflectance and opens new horizons
can influence decision
clouds, cloud contamination, and high making.
surfaceAreflectance
machine learning-based
and opens new scheme
horizonswasfor
used to enhance
studies that can influence decision making. A machine learning-based scheme was used randomized
time series analysis of AOD over the study period. Space-time extremely
to enhance timetrees models
series were
analysis of built
AODtooverfill the
the gaps
studyinperiod.
the MCD19A2
Space-time product of theran-
extremely moderate imaging
spectroradiometer (MODIS). The output was a geo-harmonized
domized trees models were built to fill the gaps in the MCD19A2 product of the moderate atmospheric dataset for
aerosol optical depth (GHADA) with complete coverage
imaging spectroradiometer (MODIS). The output was a geo-harmonized atmospheric da- of 1 km spatial resolution over
Europe. To the best of our knowledge, GHADA is the first
taset for aerosol optical depth (GHADA) with complete coverage of 1 km spatial resolu- dataset with this coverage and
resolution for Europe, and we are the first to analyze how
tion over Europe. To the best of our knowledge, GHADA is the first dataset with this COVID-19 affected AOD levels
over Europe with gaps-free AOD maps at high spatial resolution.
coverage and resolution for Europe, and we are the first to analyze how COVID-19 af-
We compared AOD levels during the chosen lockdown period to the mean AOD
fected AOD levels over Europe with gaps-free AOD maps at high spatial resolution.
values during the same period in the previous five years. We found a general decrease
We compared AOD levels during the chosen lockdown period to the mean AOD val-
trend in the countries located at the center of the study area, with the Netherlands scoring
ues during the same period in the previous five years. We found a general decrease trend
the highest average decrease. In contrast, AOD levels increased in the eastern and western
European countries as it is distinctly visible in Kosovo and Spain, respectively. We found a
correlation between high humidity and low wind speed with AOD increase, which justifies
such an increase in countries like Spain and Portugal. We excluded surface temperature
and total precipitation as contributing factors to the detected changes in AOD levels, which
in return makes COVID-19 lockdown the major cause for the decrease in AOD levels.
Once GHADA is made publicly accessible, it can be used to investigate air quality
over Europe with 1 km spatial resolution and improve time series analysis, overcoming the
gaps encountered during such studies. The lockdown that happened due to the pandemic
generally lowered AOD levels; however, such lockdown is not the ultimate solution to
control AOD levels. Cleaner sources of energy and road transport are needed to maintain
lower levels of AOD and good air quality. Based on our obtained results, we recommend
utilizing machine learning to solve time series analysis limitations and to conduct various
applications concerning air quality.
Author Contributions: S.I. and L.H. conceptualized the work. S.I., M.L. and O.P. designed and
implemented the workflow and processed the data. M.L., O.P., K.P. and L.H. contributed to the
improvement of the draft manuscript. Saleem Ibrahim wrote the paper. All authors have read and
agreed to the published version of the manuscript.Remote Sens. 2021, 13, 3027 12 of 13
Funding: This work is co-financed under Grant Agreement Connecting Europe Facility (CEF) Tele-
com project 2018-EU-IA-0095 by the European Union and by the Grant Agency of the Czech Technical
University in Prague, grant No. SGS21/054/OHK1/1T/11.
Institutional Review Board Statement: Not applicable.
Informed Consent Statement: Not applicable.
Data Availability Statement: The data and data analysis methods are available upon request.
Acknowledgments: The authors sincerely thank NASA EOSDIS for providing the daily MODIS
MAIAC AOD product (MCD19A2) available from the Land Processes Distributed Active Archive
Center (LPDAAC), AERONET (https://aeronet.gsfc.nasa.gov/) for providing AOD ground-based
observation data (was last accessed in May 2021), the European Center for Medium-Range Weather
Forecasts (ECMWF) for providing global reanalysis of atmospheric composition, and the Japan
Aerospace Exploration Agency (JAXA) for providing the digital surface model used in this study.
Conflicts of Interest: Authors declare no conflict of interest.
References
1. Boffey, D. US Visitors Set to Remain Banned from Entering EU. Guardian 2020. Available online: https://www.theguardian.com/
world/2020/jun/29/us-visitors-set-to-remain-banned-from-entering-eu (accessed on 1 May 2021).
2. Henley, J.; Oltermann, P. More Than 250 m People Now in Lockdown in EU as Germany and Belgium Adopt Measures. Guardian
2020. Available online: https://www.theguardian.com/world/2020/mar/18/coronavirus-lockdown-eu-belgium-germany-
adopt-measures (accessed on 1 May 2021).
3. Tobias, A.; Carnerero, C.; Reche, C.; Massague, J.; Via, M.; Minguillon, M.C.; Alastuey, A.; Querol, X. Changes in air quality during
the lockdown in Barcelona (Spain) one month into the SARS-CoV-2 epidemic. Sci. Total Environ. 2020, 726, 138540. [CrossRef]
4. Muhammad, S.; Long, X.; Salman, M. COVID-19 pandemic and environmental pollution: A blessing in disguise? Sci. Total
Environ. 2020, 728, 138820. [CrossRef]
5. Filonchyk, M.; Hurynovich, V.; Yan, H. Impact of COVID-19 lockdown on air quality in the Poland, Eastern Europe. Environ. Res.
2021, 198, 110454. [CrossRef] [PubMed]
6. Soni, M.; Verma, S.; Jethava, H.; Payra, S.; Lamsal, L.; Gupta, P.; Singh, J. Impact of COVID-19 on the Air Quality over China and
India Using Long-term (2009–2020) Multi-satellite Data. Aerosol Air Qual. Res. 2020, 21, e200295. [CrossRef]
7. Filonchyk, M.; Hurynovich, V.; Yan, H.; Gusev, A.; Shpilevskaya, N. Impact Assessment of COVID-19 on Variations of SO2 , NO2 ,
CO and AOD over East China. Aerosol Air Qual. Res. 2020, 20, 1530–1540. [CrossRef]
8. Ranjan, A.K.; Patra, A.K.; Gorai, A.K. Effect of lockdown due to SARS COVID-19 on aerosol optical depth (AOD) over urban and
mining regions in India. Sci. Total Environ. 2020, 745, e141024. [CrossRef] [PubMed]
9. Kalluri, R.O.R.; Gugamsetty, B.; Tandule, C.R.; Kotalo, R.G.; Thotli, L.R.; Rajuru, R.R.; Palle, S.N.R. Impact of aerosols on surface
ozone during COVID-19 pandemic in southern India: A multi-instrumental approach from ground and satellite observations,
and model simulations. J. Atmos. Sol. Terr. Phys. 2021, 212, 105491. [CrossRef]
10. Liu, Y.; Sarnat, J.A.; Coull, B.A.; Koutrakis, P.; Jacob, D.J. Validation of Multiangle Imaging Spectroradiometer (MISR) aerosol
optical thickness measurements using Aerosol Robotic Network (AERONET) observations over the contiguous United States. J.
Geophys. Res. 2004, 109. [CrossRef]
11. Shen, H.; Li, T.; Yuan, Q.; Zhang, H. Estimating Regional Ground-Level PM2.5 Directly from Satellite Top-of-Atmosphere
Reflectance Using Deep Belief Networks. J. Geophys. Res. Atmos. 2018, 123, 13875–13886. [CrossRef]
12. Yang, Q.; Yuan, Q.; Yue, L.; Li, T.; Shen, H.; Zhang, L. The relationships between PM2.5 and aerosol optical depth (AOD) in
mainland China: About and behind the spatio-temporal variations. Environ. Pollut. 2019, 248, 526–535. [CrossRef]
13. Zhang, H.; Hoff, R.M.; Engel-Cox, J.A. The relation between Moderate Resolution Imaging Spectroradiometer (MODIS) aerosol
optical depth and PM2.5 over the United States: A geographical comparison by U.S. Environmental Protection Agency regions. J.
Air Waste Manag. Assoc. 2009, 59, 1358–1369. [CrossRef]
14. Ajtai, N.; Mereuta, A.; Stefanie, H.; Radovici, A.; Botezan, C.; Zawadzka-Manko, O.; Stachlewska, I.S.; Stebel, K.; Zehner, C.
SEVIRI Aerosol Optical Depth Validation Using AERONET and Intercomparison with MODIS in Central and Eastern Europe.
Remote Sens. 2021, 13, 844. [CrossRef]
15. Torres, O.; Bhartia, P.K.; Sinyuk, A.; Welton, E.J.; Holben, B.N. Total Ozone Mapping Spectrometer measurements of aerosolab-
sorption from space: Comparison to SAFARI 2000 ground-based observations. J. Geophys. Res. 2005, 110. [CrossRef]
16. Torres, O.; Tanskanen, A.; Veihelmann, B.; Ahn, C.; Braak, R.; Bhartia, P.K.; Veefkind, P.; Levelt, P. Aerosols and surface UV
products from Ozone Monitoring Instrument observations: An overview. J. Geophys. Res. 2007, 112. [CrossRef]
17. Sayer, A.M.; Hsu, N.C.; Bettenhausen, C.; Ahmad, Z.; Holben, B.N.; Smirnov, A.; Thomas, G.E.; Zhang, H. SeaWiFS Ocean Aerosol
Retrieval (SOAR): Algorithm, validation, and comparison with other data sets. J. Geophys. Res. 2012, 117. [CrossRef]
18. Knapp, K.R.; Frouin, R.; Kondragunta, S.; Prados, A. Toward aerosol optical depth retrievals over land from GOES visible
radiances: Determining surface reflectance. Int. J. Remote Sens. 2005, 26. [CrossRef]Remote Sens. 2021, 13, 3027 13 of 13
19. Lim, H.; Choi, M.; Kim, J.; Kasai, Y.; Chan, P.W. AHI/Himawari-8 Yonsei Aerosol Retrieval (YAER): Algorithm, Validation and
Merged Products. Remote Sens. 2018, 10, e699. [CrossRef]
20. Kahn, R.A.; Gaitley, B.J.; Garay, M.J.; Diner, D.J.; Eck, T.F.; Smirnov, A.; Holben, B.N. Multiangle Imaging SpectroRadiometer
global aerosol product assessment by comparison with the Aerosol Robotic Network. J. Geophys. Res. 2010, 115. [CrossRef]
21. Sun, L.; Wei, J.; Bilal, M.; Tian, X.; Jia, C.; Guo, Y.; Mi, X. Aerosol Optical Depth Retrieval over Bright Areas Using Landsat 8 OLI
Images. Remote Sens. 2016, 8, 23. [CrossRef]
22. Levy, R.C.; Mattoo, S.; Munchak, L.A.; Remer, L.A.; Sayer, A.M.; Patadia, F.; Hsu, N.C. The Collection 6 MODIS aerosol products
over land and ocean. Atmos. Meas. Tech. 2013, 6, 2989–3034. [CrossRef]
23. Remer, L.A.; Kaufman, Y.J.; Tanré, D.; Mattoo, S.; Chu, D.A.; Martins, J.V.; Li, R.-R.; Ichoku, C.; Levy, R.C.; Kleidman, R.G.; et al.
The MODIS Aerosol Algorithm, Products, and Validation. J. Atmos. Sci. 2005, 62, 947–973. [CrossRef]
24. Hsu, N.C.; Jeong, M.J.; Bettenhausen, C.; Sayer, A.M.; Hansell, R.; Seftor, C.S.; Huang, J.; Tsay, S.C. Enhanced Deep Blue aerosol
retrieval algorithm:The second generation. J. Geophys. Res. 2013, 118, 9296–9315. [CrossRef]
25. Hsu, N.C.; Tsay, S.; King, M.D.; Herman, J.R. Aerosol Properties Over Bright-Reflecting Source Regions. IEEE Trans. Geosci.
Remote Sens. 2004, 42, 557–569. [CrossRef]
26. Lyapustin, A.; Wang, Y.; Laszlo, I.; Kahn, R.; Korkin, S.; Remer, L.A.; Levy, R.; Reid, J.S. Multiangle implementation of atmospheric
correction (MAIAC): 2. Aerosol algorithm. J. Geophys. Res. 2011, 116. [CrossRef]
27. King, M.D.; Platnick, S.; Menzel, W.P.; Ackerman, S.A.; Hubanks, P.A. Spatial and Temporal Distribution of Clouds Observed by
MODIS Onboard the Terra and Aqua Satellites. IEEE Trans. Geosci. Remote Sens. 2013, 51, 3826–3852. [CrossRef]
28. Meraner, A.; Ebel, P.; Zhu, X.X.; Schmitt, M. Cloud removal in Sentinel-2 imagery using a deep residual neural network and
SAR-optical data fusion. ISPRS J. Photogramm. Remote Sens. 2020, 166, 333–346. [CrossRef]
29. Yang, J.; Hu, M. Filling the missing data gaps of daily MODIS AOD using spatiotemporal interpolation. Sci. Total Environ. 2018,
633, 677–683. [CrossRef]
30. Schneider, R.; Vicedo-Cabrera, A.M.; Sera, F.; Masselot, P.; Stafoggia, M.; de Hoogh, K.; Kloog, I.; Reis, S.; Vieno, M.; Gasparrini, A.
A Satellite-Based Spatio-Temporal Machine Learning Model to Reconstruct Daily PM2.5 Concentrations across Great Britain.
Remote Sens. 2020, 12, 3803. [CrossRef]
31. Open Data Science Europe. Geo-Harmonizer Project Implementation Plan 2020–2022; Open Data Science Europe: Wageningen, The
Netherlands, 2020.
32. Lyapustin, A.; Wang, Y.; Korkin, S.; Huang, W. MODIS Collection 6 MAIAC algorithm. Atmos. Meas. Tech. 2018, 11, 5741–5765.
[CrossRef]
33. Lyapustin, A.; Wang, Y.; Laszlo, I.; Korkin, S. Improved cloud and snow screening in MAIAC aerosol retrievals using spectral and
spatial analysis. Atmos. Meas. Tech. 2012, 5, 843–850. [CrossRef]
34. Inness, A.; Ades, M.; Agustí-Panareda, A.; Barré, J.; Benedictow, A.; Blechschmidt, A.; Dominguez, J.J.; Engelen, R.; Eskes, H.;
Flemming, J.; et al. The CAMS reanalysis of atmospheric composition. Atmos. Chem. Phys. 2019, 19, 3515–3556. [CrossRef]
35. Tadono, T.; Ishida, H.; Oda, F.; Naito, S.; Minakawa, K.; Iwamoto, H. Precise Global DEM Generation by Alos Prism. ISPRS Ann.
Photogramm. Remote Sens. Spat. Inf. Sci. 2014, 2, 71. [CrossRef]
36. Holben, B.N.; Eck, T.F.; Slutsker, I.; Tanré, D.; Buis, J.P.; Setzer, A.; Vermote, E.; Reagan, J.A.; Kaufman, Y.J.; Nakajima, T.; et al.
AERONET—A Federated Instrument Network and Data Archive for Aerosol Characterization. Remote Sens. Environ. 1998, 66,
1–16. [CrossRef]
37. Holben, B.N.; Tanre, D.; Smirnov, A.; Eck, T.F.; Slutsker, I.; Abuhassan, N.; Newcomb, W.W.; Schafer, J.S.; Chatenet, B.; Lavenu,
F.; et al. An emerging ground-based aerosol climatology: Aerosol optical depth from AERONET. J. Geophys. Res. 2001, 106,
12067–12097. [CrossRef]
38. Ångström, A. The parameters of atmospheric turbidity. Tellus 1964, 16, 64–75. [CrossRef]
39. Geurts, P.; Ernst, D.; Wehenkel, L. Extremely randomized trees. Mach. Learn. 2006, 63, 3–42. [CrossRef]
40. Wei, J.; Li, Z.; Cribb, M.; Huang, W.; Xue, W.; Sun, L.; Guo, J.; Peng, Y.; Li, J.; Lyapustin, A.; et al. Improved 1 km resolution
PM2.5 estimates across China using enhanced space-time extremely randomized trees. Atmos. Chem. Phys. 2020, 20, 3273–3289.
[CrossRef]
41. Anderson, T.L.; Charlson, R.J.; Winker, D.M.; Ogren, J.A.; Holmén, K. Mesoscale Variations of Tropospheric Aerosols. J. Atmos.
Sci. 2003, 60, 119–136. [CrossRef]
42. Martins, V.S.; Lyapustin, A.; de Carvalho, L.A.S.; Barbosa, C.C.F.; Novo, E.M.L.M. Validation of high-resolution MAIAC aerosol
product over South America. J. Geophys. Res. Atmos. 2017, 122. [CrossRef]
43. Levy, R.C.; Remer, L.A.; Kleidman, R.G.; Mattoo, S.; Ichoku, C.; Kahn, R.; Eck, T.F. Global evaluation of the Collection 5 MODIS
dark-target aerosol products over land. Atmos. Chem. Phys. 2010, 10, 10399–10420. [CrossRef]
44. Acharya, P.; Barik, G.; Gayen, B.K.; Bar, S.; Maiti, A.; Sarkar, A.; Ghosh, S.; De, S.K.; Sreekesh, S. Revisiting the levels of Aerosol
Optical Depth in south-southeast Asia, Europe and USA amid the COVID-19 pandemic using satellite observations. Environ. Res.
2021, 193, 110514. [CrossRef] [PubMed]You can also read