Residential Property Behavior Forecasting in the Metropolitan City of Milan: Socio-Economic Characteristics as Drivers of Residential Market Value ...

Page created by Marcus Wang
 
CONTINUE READING
Residential Property Behavior Forecasting in the Metropolitan City of Milan: Socio-Economic Characteristics as Drivers of Residential Market Value ...
sustainability

Article
Residential Property Behavior Forecasting in the Metropolitan
City of Milan: Socio-Economic Characteristics as Drivers of
Residential Market Value Trends
Marzia Morena * , Genny Cia                    , Liala Baiardi       and Juan Sebastián Rodríguez Rojas

                                          Department of Architecture, Built Environment and Construction Engineering, Politecnico di Milano,
                                          Via Bonardi 9, 20133 Milan, Italy; genny.cia@polimi.it (G.C.); liala.baiardi@polimi.it (L.B.);
                                          juansebastian.rodriguez@mail.polimi.it (J.S.R.R.)
                                          * Correspondence: marzia.morena@polimi.it; Tel.: +39-02-2399-5189

                                          Abstract: The phenomenon of urbanization of cities has been the subject of numerous studies
                                          and evaluation protocols proposing to analyze the degree of economic and social sustainability of
                                          development projects. Through careful research and synthesis of the theoretical framework regarding
                                          residential properties’ performance measurement and forecasting, this paper goes deeper into the
                                          proposition of property development as an asset class that represents the biggest share of the Italian
                                          property market and yet is avoided by the big portfolios. The analysis model was applied to the city
                                          of Milan and its Metropolitan Area. The method is based on the development of correlation indices
                                to evaluate different behaviors, through time and a Geographic Information System (GIS) based on
         
                                          the Hedonic Price Method (HPM). Results from a hedonic model estimated for several recent years
Citation: Morena, M.; Cia, G.;            suggest that, depending on the particular view, the relation between the rent/price performance
Baiardi, L.; Rodríguez Rojas, J.S.
                                          and the different external and intrinsic variables can represent a useful parameter for evaluating the
Residential Property Behavior
                                          feasibility of different real estate investments.
Forecasting in the Metropolitan City
of Milan: Socio-Economic
                                          Keywords: real estate market; residential property; hedonic price method (HPM); urban sustainabil-
Characteristics as Drivers of
                                          ity; urban transformation
Residential Market Value Trends.
Sustainability 2021, 13, 3612.
https://doi.org/10.3390/su13073612

Academic Editors: Jorge Chica-Olmo        1. Introduction
and Ángeles Sánchez                            The nature of the property market causes the construction of predictions to be de-
                                          pendent on many factors that are often ignored or undervalued, as well as on the already
Received: 1 February 2021                 existing factors that determine less perceptible changes. According to various international
Accepted: 17 March 2021                   research works carried out at an urban level, the true nature of the change in real estate
Published: 24 March 2021                  values lies in trends that may be due to the simple perception of the population [1,2], a
                                          complex urban process [3,4], or, on occasion, situations where the price system may not
Publisher’s Note: MDPI stays neutral      immediately reflect the changes suffered by the area in recent times [5,6].
with regard to jurisdictional claims in
                                               The possibility that residential Real Estate might not be efficiently upraised was
published maps and institutional affil-
                                          given a strong foundation by Case and Shiller (1989) [7]. The authors state that there is a
iations.
                                          correlation and predictability in the average cost of housing prices but establishes the idea
                                          of a possible correlation between future prices with immediate rents as a natural behavior
                                          of residential real estate. When considering residential properties, predictability states and
                                          reinforces the idea of a sequential correlation [8].
Copyright: © 2021 by the authors.              The susceptibility of house prices, and the model with which such prices are calculated,
Licensee MDPI, Basel, Switzerland.        are presented by Poterba (1984) [9] stating that a perfectly informed model of house prices
This article is an open access article
                                          may have positive shocks followed by declining prices and vice versa; this is related to the
distributed under the terms and
                                          lags in the supply of new assets. Even if these scenarios are known and incorporated into
conditions of the Creative Commons
                                          the model, the nature of the market creates a serial correlation and then, even if these lags
Attribution (CC BY) license (https://
                                          are well known and fully incorporated into expectations, “they still create serial correlation
creativecommons.org/licenses/by/
                                          and (somewhat) predictable house price movements in reaction to shocks” [10].
4.0/).

Sustainability 2021, 13, 3612. https://doi.org/10.3390/su13073612                                     https://www.mdpi.com/journal/sustainability
Residential Property Behavior Forecasting in the Metropolitan City of Milan: Socio-Economic Characteristics as Drivers of Residential Market Value ...
Sustainability 2021, 13, 3612                                                                                               2 of 25

                                      Poterba [9] presents an asset market model for residential real estate and he estimates
                                how changes and inflation rates affect the equilibrium of prices. Then, making a model for
                                deducting changes in Real Estate, he includes the effectiveness of the market, like Campbell
                                (1999) [11]; if markets are efficient, value/income proportions ought to be decidedly
                                connected with resulting profit (and value) growth.
                                      Over the past 10 years, extensive research has attempted to evaluate the dynamics
                                involved in metropolitan cities by comparing them. Most of these studies have defined
                                synthetic indicators to measure urban smartness [12] as well as its dimensions and produc-
                                tivity. Kitchin et al. (2015) and Vanolo, (2015) [13,14] have found that although indicators
                                are an effective means of describing complex phenomena and supporting decision-making
                                processes to define adequate urban strategies and actions, sometimes they do not allow
                                measurable elements such as social, demographic, and cultural differences between cities.
                                      The behavior of the real estate market and, in particular, the residential sector, in a large
                                city varies from that of small, medium-sized, and large cities; it is necessary to consider
                                the main differences due to the size of the sector and the dynamics of a metropolitan
                                city. Moreover, it is necessary to add that housing markets are not homogenous across
                                metropolises. Aggregating data at the national level may disguise the true volatility at
                                a local level that homeowners face and care about [15]. In the same way, the areas of a
                                metropolitan city may not reflect the general behavior of the neighborhood or even the
                                sector.
                                      It is precisely this context that the Research Project of Relevant National Interest (PRIN)
                                “Metropolitan cities: territorial economic strategies, financial constraints and circular
                                regeneration” includes their research results (the Projects of Relevant National Interest
                                (PRIN) Are Research Projects Funded by the Italian Ministry of Education, University and
                                Research (MIUR) with the Aim of Strengthening the National Scientific Bases, Also in
                                View of a More Effective Participation in European Initiatives Relating to the Framework
                                Programs).
                                      This research project involved four different research units (UdR): Architecture, Built
                                Environment and Construction Engineering Department of Politecnico di Milano, Iuav
                                University of Venice, University of Bari Aldo Moro and the University of Naples Federico
                                II. The three-year research project aims to investigate the evolution over time of the rela-
                                tionships between the central city and the metropolitan suburbs through census data of the
                                functions and activities hosted. It also intends to deepen the trend of public investments,
                                taxation relating to the metropolitan city, and finally the analysis of the profile of land and
                                real estate income from the center to the periphery of the metropolitan cities.
                                      One of the aims of the research is to demonstrate the trends in ten Italian metropolitan
                                cities and, for Politecnico di Milano research unit, the in-depth study and analysis of the
                                trend of real estate values in the Metropolitan City of Milan.
                                      The analysis of land and real estate trends started in one of the first phases of PRIN
                                Project (Baiardi et al. 2019) [16], within which the variations in price and rental value were
                                analyzed, as well as the capitalization rate.
                                      The research continued with an in-depth analysis of the trends in real estate values
                                in the residential sector and of the factors that can influence them. It is precisely on this
                                theme that this paper focuses.
                                      The research therefore provided the preparation and processing of data through the
                                creation of special indices used to monitor and map residential real estate performance
                                given by data pertinent to the Real Estate Market, making use of data provided by the
                                Agenzia delle Entrate (Agenzia delle Entrate—Revenue Agency—is the Italian Revenue
                                Agency, a non-economic public body that operates to ensure the highest level of tax
                                compliance. It is mainly responsible for collecting tax revenues, providing services and
                                assistance to taxpayers and carrying out assessment and inspections aimed at countering
                                tax evasion. It also provides cadastral and geocartography services, manages all the
                                payment to public administration, handles the e-invoice for all the public authorities and
                                the Health Insurance Card); as well as the identification of socioeconomic factors related
Residential Property Behavior Forecasting in the Metropolitan City of Milan: Socio-Economic Characteristics as Drivers of Residential Market Value ...
Sustainability 2021, 13, 3612                                                                                              3 of 25

                                to these trends. Using real observations of housing transactions in the residential market,
                                from 2006 to 2017, the analysis conducted aims to identify the possible future scenarios
                                of the residential property market of the metropolitan city of Milan in specific areas of
                                interest.

                                2. Methodology
                                      The paper aims to identify, through an analysis of price variations, external and
                                intrinsic characteristics, the possible future scenarios of the residential real estate market
                                of the metropolitan city of Milan in specific areas of interest, building-specific tools for
                                decision-making, and analysis of risk.
                                      The construction of a model to analyze trends and investment opportunities in the real
                                estate market of the metropolitan city of Milan involves several steps: The analysis of the
                                previous conditions that have led to the current market situation through the evaluation
                                of the series of existing data (Residential transactions occurred between 2006 and 2017),
                                the assumption of certain parameters and general conditions as well as the analysis of
                                the dynamics existing between the city and its metropolitan area; thus determining the
                                areas of greatest potential to carry out a specific analysis of the expected future changes in
                                these areas, determined by the city’s urban plans as well as by investment trends, private
                                projects, and changes in the inhabitants perception of each zone.
                                      Understanding the dynamics of public and private investment in the city was initially
                                evident through the analysis of real estate growth or reduction trends [17] and performance
                                of different factors external and intrinsic to the market, and then proposing an investment
                                scenario [18].
                                      In order to achieve this aim, the research involves the adoption of Hedonic Pricing
                                Method (HPM) proposed by Rosen [19] in the city of Milan in order to quantify the impact
                                that the features (structural, neighborhood, and accessibility characteristics) of a residential
                                property have on its real market price. For this purpose, a set of 352 transactions occurred
                                in the third quarter of 2019 within the urban limits of the metropolitan city of Milan have
                                been used. GIS (Geographic Information System) has been used to analyze the location
                                properties on the map and to measure distances between each property and the variables
                                described in Section 6. Subsequently, the model will be used for evaluating the impact on
                                prices and rents (the model will be run with both) that selected private and public urban
                                projects will have in the behavior of the city. In this scenario, once the initial model is built,
                                the current situation will be modified with a second scenario and prices and rents will be
                                recalculated according with the results of the first model, and these results will be used in
                                the investment scenarios.
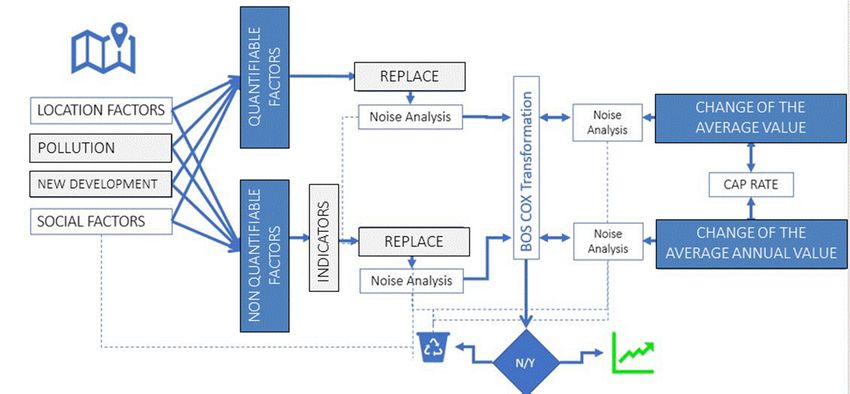
                                      Through a statistical regression in cases where a total or partial mapping of the
                                information is possible, a model was constructed (Figure 1).
                                      In addition to the hedonic model, an important starting point for the completion of
                                the analysis was to analyze not only prices but also rent, thanks to the document presented
                                by Lee, Seslen, and Wheaton [20], where a direct relationship between rent and prices is
                                established throughout subsequent prices.
                                      In the proposition of this analysis, the main idea is that prices and rents are the correct
                                comparison for a test of autocorrelation. The rent is considered as a linear combination of
                                its various attributes (hedonic equation). Subsequent price appreciations will be considered
                                in a specific area, in a panel of at least 5 years.
                                      The first endeavor to use value/rent proportions for testing housing market efficiency
                                was developed by Meese and Wallace [21]. These authors examine the ratio of average
                                between house prices and average rents and find some positive correlation to subsequent
                                price appreciations.
Residential Property Behavior Forecasting in the Metropolitan City of Milan: Socio-Economic Characteristics as Drivers of Residential Market Value ...
Sustainability 2021, 13, 3612                                                                                                                               4 of 25
Sustainability 2021, 13, x FOR PEER REVIEW                                                                                                                  4 of 26

                                                           Figure
                                                           Figure 1.
                                                                  1. Model
                                                                     Model algorithm.
                                                                           algorithm.

                                         In  addition
                                         A study          to the hedonic
                                                     by Campbell                 model,
                                                                        et al. [11]         an important
                                                                                      attempts      an exhaustivestartingtimepoint    for the completion
                                                                                                                                examination       of value/rent   of
                                  the  analysis
                                   rates           was to analyze
                                          and presumes         that therenotisonly
                                                                                 solid prices
                                                                                         proofbut of aalso   rent, thanks
                                                                                                         time-relation      into  the document
                                                                                                                                metropolitan           presented
                                                                                                                                                   cities.   At the
                                  by   Lee,
                                   point      Seslen,
                                           when    rentsandareWheaton
                                                                 high, they  [20],
                                                                                 willwhere     a direct
                                                                                       in general     fall,relationship
                                                                                                             with most ofbetween            rent and
                                                                                                                                the alteration       beingprices
                                                                                                                                                              made is
                                  established      throughout
                                   by prices instead                subsequent prices.
                                                            of rents.
                                         In
                                         If the
                                             rentsproposition
                                                     change over   of this
                                                                        time,analysis,     the mainofidea
                                                                                  the volatility                is that
                                                                                                           prices         prices
                                                                                                                     should     beandlessrents
                                                                                                                                           thanare    theof
                                                                                                                                                   that     correct
                                                                                                                                                               rents
                                  comparison        for a test the
                                   since they represent          of autocorrelation.
                                                                       discounted value       Theofrent    is considered
                                                                                                       expected       future as     a linear
                                                                                                                                rents.    Rentscombination
                                                                                                                                                   play a more    of
                                  its  various role
                                   important      attributes
                                                        when (hedonic
                                                                 adjustingequation).           Subsequent
                                                                                 actual conditions                price
                                                                                                           efficient       appreciations
                                                                                                                        price   rent ratios will
                                                                                                                                               are thebe consid-
                                                                                                                                                           highest
                                  ered
                                   wheninoscillations
                                             a specific area,haveindriven
                                                                      a panel      of attoleast
                                                                                rents             5 years. bottom, and lowest when rents are
                                                                                            a (temporary)
                                   at a (temporary)
                                         The first endeavorpeak. to According
                                                                        use value/rentto Abel,     Andrew for
                                                                                              proportions        andtesting
                                                                                                                        Blanchard,
                                                                                                                               housing  Olivier
                                                                                                                                            market  [22]   “Hence
                                                                                                                                                        efficiency
                                   regardless
                                  was    developedof whether
                                                         by Meese  the and
                                                                         rentsWallace
                                                                                  in question[21]. are
                                                                                                    These smoothly
                                                                                                               authorstrending
                                                                                                                           examineup    theorratio
                                                                                                                                               down,      or oscil-
                                                                                                                                                      of average
                                   lating in house
                                  between      some manner,
                                                        prices and  efficient
                                                                        average   price/rent
                                                                                     rents andratiosfind are
                                                                                                           some  positively
                                                                                                                    positive correlated
                                                                                                                                correlationwith         near-term
                                                                                                                                                 to subsequent
                                   subsequent       rental
                                  price appreciations.       movements.          When     prices    are   the   present    value    of  rents   the   correlation
                                   will extend
                                         A study   to prices    as well”. et al. [11] attempts an exhaustive time examination of
                                                       by Campbell
                                         According
                                  value/rent      rates toandLee,  Seslen, and
                                                                presumes        thatWheaton         [20] aproof
                                                                                       there is solid         unit’s ofpredicted      price using
                                                                                                                        a time-relation                its current
                                                                                                                                              in metropolitan
                                   characteristics
                                  cities.  At the point in awhen
                                                               hedonic
                                                                     rentsmodel
                                                                              are high, hasthey
                                                                                              a rent
                                                                                                   willas ininput.
                                                                                                              generalHence,
                                                                                                                         fall, withthemost
                                                                                                                                         residuals      from this
                                                                                                                                              of the alteration
                                   hedonic     equation     should     reflect
                                  being made by prices instead of rents.          the  omitted      determinants        of  rent   and   the  expected       future
                                   growth.
                                         If rents change over time, the volatility of prices should be less than that of rents sincea
                                                This   way    of  modelling         will  test  if  housing      Hedonic       equation      residuals      have
                                   significant
                                  they represent  positive    correlationvalue
                                                       the discounted           with of subsequent
                                                                                           expected futureprice growth.
                                                                                                                   rents. Rents play a more important
                                         The    simulations      are   raised    specifically
                                  role when adjusting actual conditions efficient price            for  the   areas
                                                                                                                 rentofratios
                                                                                                                          interest
                                                                                                                                 areandthe are   applied
                                                                                                                                            highest     when  to the
                                                                                                                                                                 os-
                                   models built
                                  cillations    havetodriven
                                                        identify     possible
                                                                  rents            changes in real
                                                                          to a (temporary)                estateand
                                                                                                    bottom,       or rental
                                                                                                                       lowestvalues.      For such
                                                                                                                                 when rents       are at scenarios
                                                                                                                                                           a (tem-
                                   a risk study
                                  porary)     peak.was     developed,
                                                       According           considering
                                                                       to Abel,     Andrew    theandaccuracy
                                                                                                        Blanchard,of theOlivier
                                                                                                                           models      and
                                                                                                                                    [22]     characteristics
                                                                                                                                          “Hence       regardless of
                                   the  area,   the  feasibility    of  investments         analyzed       depending
                                  of whether the rents in question are smoothly trending up or down, or oscillating in someon   capital   expenditures,         and
                                   the profiles
                                  manner,          of possible
                                               efficient           investment
                                                            price/rent      ratios funds       or individual
                                                                                      are positively                investors.
                                                                                                             correlated      with near-term subsequent
                                         The    model     permits    us   to:
                                  rental movements. When prices are the present value of rents the correlation will extend
                                   • prices
                                  to     Identify    and interpret the general trends of the residential property market and identify
                                               as well”.
                                         Accordingthat
                                         the   areas          are most
                                                         to Lee,   Seslen, interesting
                                                                              and Wheaton    for an    in-depth
                                                                                                    [20]   a unit’sanalysis
                                                                                                                       predicted  of price
                                                                                                                                      trends    through
                                                                                                                                             using            a self-
                                                                                                                                                       its current
                                         constructed       forecasting     model.
                                  characteristics in a hedonic model has a rent as input. Hence, the residuals from this he-
                                   •
                                  donic  Identify
                                           equation  and    quantify
                                                         should          the impact
                                                                    reflect   the omittedof thedeterminants
                                                                                                   different socio-economic
                                                                                                                       of rent and and  the spatial
                                                                                                                                              expected   variables
                                                                                                                                                             future
                                  growth.on theThisprice
                                                      waytreated      in the areas
                                                             of modelling          will of  interest,
                                                                                         test   if housingunderHedonic
                                                                                                                   the critical    issues and
                                                                                                                              equation             constraints.
                                                                                                                                             residuals      have a
                                   •     By simulating
                                  significant     positive future       scenarios
                                                              correlation      with in     the real estate
                                                                                        subsequent        priceforecasting
                                                                                                                  growth. model, pose the different
                                         The simulations are raised specifically for the areaspresent,
                                         future    situations     that   the   residential     market       could     of interestas and
                                                                                                                                      wellareas develop
                                                                                                                                                 applied to   a risk
                                                                                                                                                                 the
                                         analysis     within    the  different      areas   of interest.
                                  models built to identify possible changes in real estate or rental values. For such scenarios
                                  a• riskIdentify
                                           study was  in which     areasconsidering
                                                          developed,        price/rent ratios          are positively
                                                                                              the accuracy                   correlated
                                                                                                                  of the models        and with      subsequent
                                                                                                                                             characteristics      of
                                         rent   (and   hence    price)    growth,      raising    future    investment
                                  the area, the feasibility of investments analyzed depending on capital expenditures, and   scenarios.
                                  the profiles of possible investment funds or individual investors.
Residential Property Behavior Forecasting in the Metropolitan City of Milan: Socio-Economic Characteristics as Drivers of Residential Market Value ...
Sustainability 2021, 13, 3612                                                                                            5 of 25

                                •    Identify the different possible responses that the residential property market may
                                     suffer in the future due to general changes in the city, its socio-economic conditions,
                                     and moreover under the effect of public and private projects, in order to build a series
                                     of investment scenarios.
                                     Through the use of GIS tools and regression models it was possible to identify areas
                                of interest and general trends, in addition to identifying the main challenges for the
                                elaboration of a more detailed study that would allow future analysis.
                                     The paper is partitioned into following sections:
                                •   Real estate forecasting will analyze different methods for predicting prices and trends,
                                    defining its limitations and advantages depending on the availability of data. More-
                                    over, a method for deducting general behaviors from price/earnings ratios and its
                                    positive correlation with subsequent earnings (and price) growth will be introduced.
                                •   Data gathering and description summarize the sources and treatments that were given
                                    to data, the entities in charge of providing real estate official information, and the
                                    sources of different crucial variables that were considered in the model.
                                •   Econometric modeling of the residential properties in the metropolitan city of Milan is
                                    a statistical assessment of the real estate profile in the Metropolitan City of Milan, only
                                    focused on the micro areas that were already identified in the PRIN “Metropolitan
                                    cities: territorial economic strategies, financial constraints and circular regeneration”
                                    project, analyzing also the current situation of residential properties in Italy and Milan.
                                    This section defines the parameters used in the creation of a model able to be modified
                                    with further assumptions for future investment scenarios that will be postulated.
                                •   Analysis and interpretation of the results in order to evaluate future scenarios and
                                    investment opportunities in residential properties in the metropolitan City of Milan.
                                    This last section completes the paper with investment scenarios using the analysis
                                    framework for the real estate profile. The different scenarios consider public invest-
                                    ment in new infrastructure, the impact of new urban developments in the city, and
                                    also the effect of private projects that strongly affect the current state of specific areas
                                    in the city raising different opportunities for investing in specific areas. This effect as
                                    is seen might already be happening since the effect price/rent ratio reflects a faster re-
                                    sponse of the market than just analyzing the timeline of acquisition prices. This section
                                    provides evidence of investment properties with indications about the advantages
                                    and risks of the transactions.

                                3. The Metropolitan City of Milan (MCM) as a Privileged Study Context
                                      The importance of geographically defining the study to be performed is based in the
                                light of overall regional economic conditions. In this sense, the analysis should “provide
                                background on the location of the site within the metropolitan area, for example, the
                                distance to downtown, to the airport, and to other regional draws” [23].
                                      In order to analyze the Metropolitan City residential market, it is important to under-
                                stand the scale of the analysis and the specificity of the information available [24] as well
                                as the scale of the objectives of this research.
                                      The Metropolitan City of Milan (MCM) was established on 8 April 2014 lying inside the
                                Province of Milan as a result of the entry into force of Law 56/2014 (art. 12) [25]. According
                                to its metropolitan city charter [26], the MCM aims to express the best of the culture of
                                government and the administrative experience of the municipalities of its territory, each
                                carrying stories and traditions in an integrated and polycentric framework that respects
                                their identity and enhances their participation. The MCM wants to make administrative
                                simplification its working method. The role of the new body and our common political
                                and civil commitment are defined around these challenges.
                                      The fundamental functions of the MCM are established by Section 85 of the Law n.
                                56 of 7 April 2014 [25], in force since 8 April 2014, and by Regional Law 92/2015 [27],
                                amended into Law 32/2015, published in the Regional Official Bulletin on 16 October
                                2015. In particular, Law no. 56 of 2014 [25] (in articles 85 and 86) underlines that among
Sustainability 2021, 13, 3612                                                                                                6 of 25

                                the fundamental actions exercised by metropolitan cities, there are: Provincial territorial
                                planning for coordination, as well as protection and enhancement of the environment, for
                                the aspects of competence (letter a) of art. 85); and the care of the strategic development
                                of the territory and management of services in associated form based on the specific
                                characteristics of the territory itself (letter a) of art. 86).
                                      The former Metropolitan City of Milan (MCM) is made up of 134 Municipalities,
                                covering an area of 6827 square kilometers and has 3,196,825 inhabitants, almost a third of
                                the regional population. There are 1,337,155 inhabitants in the municipality of Milan (over
                                40 percent of the former provincial population) and the territory is classified as entirely
                                flat; with 1500 kmq of surface, the MCM is the second urban area in Italy [28].
                                      The MCM is divided into different homogeneous areas with similar socioeconomical
                                characteristics and equivalent to areas with similar rent and sell value characteristics [26].
                                      Given that the behavior of the residential sector in a large city varies in a different way
                                from that of a small, medium-sized, and large cities, it is necessary to consider the main
                                differences due to the size of the sector and the dynamics of a metropolitan city. Besides,
                                housing markets are not homogenous across metropolises [29].
                                      It is critical to have a full model when considering costs and value changes across
                                jurisdictional submarkets in a metropolitan area that is subdivided in homogeneous areas
                                like Milan. A standard model of metropolitan housing submarkets accepts that a pre-
                                determined number of households look for a market over a set number of areas. Every
                                area has a fixed amount of supply. Family units get utility from the market, an amenity
                                associated with being located in a determined area, in other words, each homogeneous
                                area has special characteristics that make it attractive to house buyers [30].
                                      The flexibility of the metropolitan market is an important issue to be considered, since
                                offer and demand may vary asymmetrically. Moreover, for a product as diverse as real
                                estate, in metropolitan cities a considerable reduction in population and the relative low
                                elasticities of supply and demand might be expected. “It is common in metropolitan areas
                                that asymmetric price reactions growth in population numbers has no significant effect on price”,
                                whereas declining population significantly lowered prices, hence “rental and the property
                                sectors are characterized by low price elasticity of demand, indicating that significant real estate
                                price decreases can result” [31].
                                      The dynamics in metropolitan urban communities in western cities as Milan are
                                not the same as in developing nations, since critical beneficial outcomes are shown for
                                disposable income and construction costs, and the reaction to the creation of supply is
                                asymmetrical, meaning that population growth and the resulting increases in demand
                                have no significant effect on price. However, a declining population leads to significantly
                                reduced prices [25].
                                      Several factors influence the attractiveness of one real estate asset compared to others
                                in the same metropolitan market. Some analysts start with an overview of the demographic
                                indicators of the metropolitan area or add indicators that describe the conditions of the
                                local market, thus facilitating the comparison and the regional or metropolitan contrast
                                with the conditions of a specific submarket, or the area of interest for a project. “At a
                                minimum, demographic and economic data should go back as far as the preceding decennial census.
                                However, once the most recent census is more than a few years in the past, the analyst will need
                                to provide more current estimates and projections”. This is the main reason why this analysis
                                also considers transactions made after the main database available (OMI transactions until
                                2017) needs to be updated to the latest available [23].
                                      A metropolitan diagram must incorporate data on the construction sector. For hous-
                                ing, real estate studies, building permits, and construction volumes have to be tracked,
                                ideally with isolated arrangements for single-family and multifamily projects. The eco-
                                nomic conditions of each neighborhood may not accurately reflect national patterns: Not
                                every metropolitan homogeneous zone profits by a national financial blast. Accordingly,
                                Real estate market studies give more importance to regional and metropolitan economic
                                indicators than to nationwide statistics [23].
Sustainability 2021, 13, 3612                                                                                             7 of 25

                                4. Data Gathering and Description
                                     Even if residentially focused, the Italian market has no records for specific subsectors
                                or neighborhoods of a city delivered by institutional bodies. Analyzing who produces Real
                                Estate Information in Italy, governmental entities in charge of compiling the information,
                                trade associations, and consulting companies are the most interesting data providers.
                                The main problem being the low level of connection among all these bodies, there is no
                                systematic trade of information. Among the official entities, there is the Osservatorio del
                                Mercato Immobiliare (OMI) an institution that is reliant on the Agenzia delle Entrate.
                                     The OMI is responsible for collecting and processing technical and economic informa-
                                tion relating to property values, the rental market and annuity rates, and the publication
                                of studies and calculations for the statistical enhancement of the Agenzia delle Entrate’s
                                archives [32].
                                     In the OMI’s dataset structure, in order to homogenize the data, the metropolitan
                                city of Milan (and the city of Milan) has been divided into different areas (OMI zones),
                                which are defined as a continuous portion of the municipal territory that reflects a homoge-
                                neous sector of the local property market, in which there is uniformity of appreciation for
                                economic and socio-environmental conditions [33].
                                     The area is defined as a homogeneous segment of the local real estate market, in which
                                there is uniformity of appreciation for economic and socio-environmental conditions. It is
                                formed on the basis of the deviation, between the minimum value and the maximum value,
                                not exceeding 50%, found for the prevailing typology, within the residential destination.
                                     After the 2014 update, the municipality of Milan was divided into 41 reference real
                                estate areas, the so-called “OMI Zones”, 14 less than in 2006 (The territorial areas of the
                                OMI areas are subject to a ten-year review process, in order to verify their consistency with
                                the urban development of the territory and with the rules for the formation of municipal
                                zoning. The updating of the articulation of the municipal territory by homogeneous areas
                                must be justified exclusively in structural changes of the territory and / or in a changed
                                reality of the local market, found through appropriate and detailed territorial analysis,
                                following the criteria and operating methods set out in the Manual.The updating of the
                                municipal zoning is released every semester with the validation of the cartographic archives
                                according to the following terms and can take place in the following ways: Partial update;
                                10-year update.The updating of the perimeters of the OMI areas must also be ensured in
                                the event of changes in the cadastral map and / or in the presence of errors. In such cases,
                                the following procedures are applied: Realignment; grinding) (Figure 2).
                                     In 2014, a general review was carried out of the territorial areas (OMI areas) within
                                which the prices of the properties are defined. This operation, which ended in the second
                                half of 2014, was necessary to incorporate the changes in the urban and economic fabric.
                                     On that occasion, improvements were made in terms of a uniform methodological
                                approach, internal controls, and fine-tuning in the boundary delimitations, starting from
                                the second half of 2014.
                                     For this reason, the comparison between the quotations for the second half of 2014
                                and those of the previous semesters for individual areas is not always possible, where the
                                perimeters of the territorial areas of reference have changed substantially.
                                     The change of the homogeneous divisions is evident in the figure below. Given the
                                considerable change in the area and their shape and coverage, the average prices from
                                2006 to 2013 will not be considered for the analysis in this dissertation. A study of the
                                consequences of the change of OMI areas was already presented in the context of Research
                                Project of Relevant National Interest—PRIN “Metropolitan cities: territorial economic strategies,
                                financial constraints and circular regeneration” [34].
Sustainability2021,
Sustainability        13,x3612
                2021,13,   FOR PEER REVIEW                                                                                                                  88ofof26
                                                                                                                                                                   25

                                                                                                                                                  .
                                   Figure 2. Difference between Osservatorio del Mercato Immobiliare (OMI) areas in 2006 and 2014.
                                  Figure 2. Difference between Osservatorio del Mercato Immobiliare (OMI) areas in 2006 and 2014.
                                           The real estate value in the municipality of Milan is given by the type, age, and
                                         In 2014, acharacteristics
                                   architectural          general review        thatwas  carried out
                                                                                       distinguish    theofsingle
                                                                                                              the territorial
                                                                                                                     area of the areas    (OMI areas)
                                                                                                                                     municipality             within
                                                                                                                                                          of Milan.
                                  whichInthe      prices
                                              order      to of  the properties
                                                             build      the econometric are defined.
                                                                                                model,This      operation,
                                                                                                            it was   important which     ended
                                                                                                                                     to find     theinrelationship
                                                                                                                                                        the second
                                  half  of 2014,
                                   between       thewas      necessary
                                                       variation              to incorporatefactors
                                                                      of socio-economic           the changes
                                                                                                            with thein the   urban
                                                                                                                         change    in and
                                                                                                                                       the realeconomic      fabric.in
                                                                                                                                                    estate value
                                         On that occasion,
                                   the residential         category    improvements          were made inCity
                                                                          of the entire Metropolitan              terms     of a uniform
                                                                                                                        of Milan    with anmethodological
                                                                                                                                                  analysis period
                                  approach,
                                   of 11 years,   internal
                                                      from 2006controls,       andevaluating
                                                                        to 2017,      fine-tuningthe in the    boundary
                                                                                                          importance       ofdelimitations,         starting from
                                                                                                                               the various socio-economic
                                  the  second      half    of 2014.
                                   characteristics as drivers of the change in the real estate value.
                                         For
                                           Thisthis   reason,
                                                  analysis         the comparison
                                                               attempted                    between
                                                                                  to evaluate            the quotations
                                                                                                 the change      from yearfor       the second
                                                                                                                                to year               half of 2014
                                                                                                                                            in the average      sales
                                  and
                                   valuethose     of the previous
                                            of residential                 semesters
                                                                  real estate             forwhich
                                                                                     units,   individual
                                                                                                      is why   areas   is not alwaystransaction
                                                                                                                 a standardized            possible, where       the
                                                                                                                                                           database,
                                  perimeters
                                   provided by     of the
                                                        the Agenzia
                                                             territorialdelle areas    of reference
                                                                                    Entrate,   is used.have changed substantially.
                                           As presented
                                         The    change of in    the the   paper “Real estate
                                                                        homogeneous                 market
                                                                                             divisions         values and
                                                                                                           is evident          land
                                                                                                                          in the       revenue
                                                                                                                                   figure           analysis
                                                                                                                                               below.    Giveninthe
                                                                                                                                                                  the
                                   Metropolitanchange
                                  considerable           city of inMilan”the area[16],and
                                                                                        the their
                                                                                             division
                                                                                                   shape of the
                                                                                                              andmetropolitan
                                                                                                                    coverage, the     city   into homogeneous
                                                                                                                                         average      prices from
                                   zones
                                  2006    toshows
                                             2013 will   a high
                                                              notheterogeneity
                                                                     be consideredoffor      characteristics
                                                                                                the analysis between           the 2006–2013
                                                                                                                  in this dissertation.              classification
                                                                                                                                                 A study      of the
                                   and that of 2014–2017.
                                  consequences           of the change   Thisofphenomenon
                                                                                  OMI areas was    is present     for all groups.
                                                                                                       already presented         in theThe      analysis
                                                                                                                                           context          must be
                                                                                                                                                      of Research
                                   concentrated
                                  Project   of Relevant  only on     the variation
                                                                National                 in the periods
                                                                                Interest—PRIN                 before and
                                                                                                      “Metropolitan          afterterritorial
                                                                                                                          cities:   the update,       and the
                                                                                                                                                  economic       data
                                                                                                                                                              strate-
                                   for the
                                  gies,       yearsconstraints
                                        financial        2018 and and    the circular
                                                                               first halfregeneration”
                                                                                            of 2019 will[34]. also be taken into consideration by the
                                   revenue      agency
                                         The real            forvalue
                                                        estate    greater   inaccuracy.      In this sense,
                                                                                the municipality        of Milanthe new      analysis
                                                                                                                      is given    by the and     model
                                                                                                                                              type,  age,wasandbuilt
                                                                                                                                                                  ar-
                                   only    with    the   most    recent      data,   and   no  data   before    2014    were
                                  chitectural characteristics that distinguish the single area of the municipality of Milan.   considered.
                                         InAsorder
                                                for the      analysis
                                                        to build      the on       the influence
                                                                             econometric       model, of itsome
                                                                                                              was geographical,
                                                                                                                    important to find    physical,        and socio-
                                                                                                                                                the relationship
                                   economic        factors,    the    state   of   conservation     of  the   building
                                  between the variation of socio-economic factors with the change in the real estate value is undoubtedly          the   factor  with
                                                                                                                                                                   in
                                   the  most     significant      impact,       followed     by  the quality     of the   neighborhood,
                                  the residential category of the entire Metropolitan City of Milan with an analysis period                      and   the  distance
                                  ofto11
                                       theyears,
                                            center      is confirmed
                                                     from     2006 to 2017,   as anevaluating
                                                                                      importantthe  exchange
                                                                                                         importancerate factor
                                                                                                                          of the for    listing;
                                                                                                                                    various         the proximity
                                                                                                                                                 socio-economic
                                   to  the  city’s     large   parks      and     the   metro   have
                                  characteristics as drivers of the change in the real estate value.    an   important       positive    effect    on  prices. The
                                   changeThis analysis attempted to evaluate the change from year to year in the averageare
                                              in    status    of  the     neighborhood,         along    with    green    areas   and     accessibility,          the
                                                                                                                                                               sales
                                   geographical          factors     identified       that  could   mean      a change
                                  value of residential real estate units, which is why a standardized transaction database, in prices,    given     that   the  other
                                   spatial characteristics
                                  provided       by the Agenzia       aredelle
                                                                           fixed.Entrate,
                                                                                     Other exchange
                                                                                              is used. factors must be seen individually for each
                                   district   (e.g.,    large   real    estate    developments,
                                         As presented in the paper “Real estate market                market values
                                                                                                                 dynamics). and land revenue analysis in
                                           However,        following         this   analysis,   the  limitations
                                  the Metropolitan city of Milan” [16], the division of the metropolitan               given   by the citylackintoof punctual
                                                                                                                                                      homogene-   ref-
                                   erence for transactions were evident. Although the database of the Real Estate Market
                                  ous zones shows a high heterogeneity of characteristics between the 2006–2013 classifica-
                                  tion and that of 2014–2017. This phenomenon is present for all groups. The analysis must
Sustainability 2021, 13, 3612                                                                                                       9 of 25

                                    Observatory aims to provide guidelines for all operators in the sector, it is necessary to
                                    study geolocated data in a point to better study the phenomenon.
                                         Within the project, the division of the city into neighborhoods was considered, given
                                    that the databases and sources of qualitative data are based on this division to report
                                    results.
                                         The municipality of Milan is divided into 88 districts, not directly connected to the
                                    delimitation of homogeneous areas except in some cases (e.g., Tre Torri). For this reason, it
                                    was necessary to take into consideration the division into city districts; the same methodol-
                                    ogy used to compare the OMI areas before and after the update was therefore applied to
                                    the districts (Figure 3):

                                    Figure 3. Discretization of real estate values of Zona OMI 2017 in the 88 districts of Milan.

                                         Although there are a wide range of techniques for managing the way towards building
                                    a real estate model, the following methodology was implemented, as performed in the
                                    Hedonic study by Vries et.al. (2009) [35]:
                                    1.    Economic Real Estate theory.
                                    2.    Data gathering.
                                    3.    Formulation of the econometric model.
                                    4.    Modeling prove and noise data elimination.
                                    5.    Representativeness evaluation.
                                    6.    Reformulate model/Interpret model
                                    7.    Use model for investment proposals.

                                    5. Econometric Modeling of the Residential Properties in the Metropolitan City of Milan
                                         For confronting statistical deficiencies recently experienced and connected with
                                    transaction-based indices, two methods have been developed: The Hedonic Price Method-
                                    ology and the repeat-sales regression methodology [36]. The hedonic pricing method
                                    depends on the principle that a property is a complex with plenty of sections which, re-
                                    gardless of whether or not they can be traded independently, have their very own valuable
                                    elements. Computing the value of all attributes for every trade, everything being equal—
                                    both physical (size of the land, size of the building, development period, number of rooms,
                                    construction quality, and so on) and localization (area, quality of the area, accessibility,
                                1
                                    noise, and so forth)—it is conceivable to generate an index by researching the value for a
                                    given property and by regression to gauge each characteristic [37].
Sustainability 2021, 13, 3612                                                                                            10 of 25

                                      Fundamentally, the process depends on the representation of the market through
                                econometric models. The reliant variable is the cost of the property or the relative price of
                                utilization at various occasions of time. The simplest model is to consider the state of the
                                buildings, their location, and so on.
                                      We can compose y = f(X) + ε, indicating with y the value per sqm of the real estate
                                units, with X the vector of the specific attributes observed and with ε the stochastic errors
                                of the model with the theory that they are regularly distributed with consistent variance,
                                ε~N (0, σ2).
                                      The calculated parameters, achieved as inherent costs ascribed by the market to
                                individual characteristics, can be applied to a lot of standard attributes to acquire a value
                                that gives a gauge of the cost that would have been seen without fluctuation in the features
                                of the properties. The valuation of a specific housing unit can be acquired by applying the
                                intrinsic costs to the attributes of the residence.
                                      The utilization of this methodology allows one to develop indices of steady quality
                                dependent on transaction costs, with, however, the utilization of a regression model that
                                permits the attributes and consequently the heterogeneity of real estate to be considered.
                                From an econometric perspective, the building quality is studied and thus the value variety
                                of a property whose qualities would be consistent after some time is featured.
                                      There are two fundamental techniques for the construction of a real estate index
                                dependent on the hedonic method:
                                (a)   Regression model will be determined for every period;
                                (b)   Single regression model utilized for all periods concerned.
                                      The principal strategy includes performing a hedonic regression for every period by
                                following the development by time of the estimation of a common property (or a portfolio
                                of properties) and evaluating the value in every period, utilizing the coefficients of hedonic
                                regressions.
                                      The principle limitation of the hedonic technique is connected to the complexity of the
                                econometric models that must be applied to guarantee the nature of an index. What is more,
                                specific consideration ought to be paid to the utilization of these techniques: Specifically, it
                                ought to be guaranteed that all the most significant factors have been incorporated into the
                                model, yet additionally the model’s illustrative factors are not very interrelated and that
                                the estimations of the diverse variables are estimated precisely. The subsequent restriction
                                concerns the quantity of the databases necessary for the advancement of such indices:
                                The market inclusion ought to be as significant as would be prudent. It is subsequently
                                important to persuade the holders of this data (specifically public accountants, mortgage
                                banks and real estate experts) that it is helpful to make it accessible so as to know value
                                increases on the residential markets.
                                      The general objective of the model built by this dissertation is to interpret residential
                                real estate prices as a variable dependent of several characteristics, the theoretical model
                                follows the alignments of a Hedonic Price Model (HPM) and several variables will be
                                defined, indexes for residential real estate performance will be used, as well as a new
                                indicator for reflecting the independent variables. The information will be collected from
                                official institutions and other sources that gather other types of information. The estimation
                                indexes were built in a such a way that they could reflect the current situation of every
                                location in the most suitable way. The statistical evaluation of the model considers the
                                assumptions made in it and describes data properly, that will be then interpreted and
                                analyzed.
                                      The model required for the most significant part of the analysis includes various
                                distinctive general arrangements of tasks:
                                (a)   An assortment of record organizations and information sources.
                                (b)   Normalizing data and avoiding inclusion of non-significant information in the model.
                                (c)   Transformation applying scientific and factual tasks to gatherings of datasets to infer
                                      new datasets (e.g., amassing a huge table by bunch factors).
Sustainability 2021, 13, 3612                                                                                              11 of 25

                                (d)   Modeling and calculation. Associating the information to the model, AI calculations,
                                      and other computational tools as GIS, used several times in this dissertation.
                                (e)   Presentation. Making intuitive graphical representations of the results.
                                      This project performs an HPM in the city of Milan in order to quantify the impact that
                                the features (structural, neighborhood, and accessibility characteristics) of a residential
                                property have on its real market price. For this purpose, a set of transactions within the
                                urban limits of the metropolitan city of Milan has been used. GIS has been used to analyze
                                the location properties on the map and to measure distances and areas of the neighborhood
                                characteristics of the transactions. Subsequently, the model will be used for evaluating
                                the impact on prices and rents (the model will be run with rents and costs) that selected
                                private and public urban projects will have in the behavior of the city. In this scene, once
                                the initial model is built, the current situation will be modified with a second scenario and
                                prices and rents will be recalculated according with the results of the first model. These
                                results will be used in the investment scenarios.
                                      Through a Box Cox statistical regression in cases where a total or partial mapping of
                                the information is possible, a model was constructed.
                                      In addition to the hedonic model, rent has also been analyzed, referring to what
                                is presented by Lee et al. (2015), where a direct relationship between rent and prices is
                                established throughout subsequent prices. The main idea of authors is that prices and rents
                                are the correct comparison for a test of autocorrelation. The rent is considered as a linear
                                combination of its various attributes (hedonic equation). Subsequent price appreciations
                                will be considered in a specific area, in a panel of at least five years.
                                      The first endeavor to utilize value/rent proportions for the testing of housing market
                                efficiency was developed by Meese and Wallace (1995) [21]. These authors examine the ratio
                                of average between house prices and average rents and do find some positive correlation
                                to subsequent price appreciations.
                                      If rents change over time, the volatility of prices should be less than the one of rents
                                since they represent the discounted value of expected future rents. Rents play a more
                                important role when adjusting actual conditions, efficient price rent ratios are the highest
                                when oscillations have driven rents to a (temporary) bottom, and lowest when rents are
                                at a (temporary) peak. “Hence regardless of whether the rents in question are smoothly
                                trending up or down, or oscillating in some manner, efficient price/rent ratios are positively
                                correlated with near-term subsequent rental movements. When prices are the present value
                                of rents the correlation will extend to prices as well” [38].
                                      According to Lee et. al. (2015) [20] a unit’s predicted price using its current character-
                                istics in a hedonic model has rent as input. Hence, the residuals from this hedonic equation
                                should reflect the omitted determinants of rent and the expected future growth. This way
                                of modelling will test if housing Hedonic equation residuals have a significant positive
                                correlation with subsequent price growth.
                                      The methodology worked with three categories of independent variables: Structural
                                characteristics of the house, neighborhood environmental characteristics, and accessibility
                                characteristics, following the categorization of Fanhua et.al. [39,40].
                                      The data collection process consisted of private housing transactions in the city of
                                Milan, occurred in the third quarter of 2019, taking into account the price per square meter
                                of the properties, their condition, the internal characteristics of the property, and its location,
                                together with the capitalization values obtained from the OMI analysis, in addition to the
                                average yearly increase of a stable area x (Table 1).
                                      For the calculation of an initial cash flow, the following parameters must be considered:
                                •     Taxes correspondent for a secondary house: 10.156% of the gross annual rent.
                                •     An average of the market for administration fee of about 0.8% of the gross annual rent.
                                •     Indexation at 100% of ISTAT values, taken from the Focus economics magazine
                                •     Sale cost 3% of the final price.
Sustainability 2021, 13, 3612                                                                                                              12 of 25

                                     Table 1. Definition of the average yearly (example).

                                                                                         Indexation
                                                    Year    Year     Year    Year       Year    Year       Year    Year    Year    Year     Year
                                       Period
                                                     1       2        3       4          5       6          7       8       9       10       11
                                       Value        0.78%   1.02%    1.23%   1.41%   1.58%     2.00%      2.00%   2.00%   2.00%    2.00%   2.00%

                                          A Geographical Information System (GIS) has been used to analyze the location
                                     properties on the map [41] and to measure distances and areas of the neighborhood
                                     characteristics of the transactions.
                                          Several variables were introduced into the model: Demographic, economic, spatial,
                                     structural (intended as intrinsic to the property), considerations of taxation, and other
                                     variables [37].
                                          The demographic variables are defined based on data provided by ISTAT (2017) [28]
                                     (Table 2). They are represented in the following table where the correlation of these
                                     indicators has been defined and studied for each neighborhood. For changing quotations
                                     from neighborhood to areas and vice versa, GIS software was used.

                                     Table 2. Demographical variables considered (Source: ISTAT, 2017).

    ID                Scope                DEN                          Indicator                                    Definition
                                                                                                      Ratio between the population resident in
     1             Territorial                 D               Housing density-Ab/Km2
                                                                                                        the area and the relative area in Km2
                                                                                                    Ratio between the number of commuter
                                                                                                   flows entering the area (net of commuters
     2              Mobility                   Ic                    Centrality index              residing and working in the area) and the
                                                                                                  number of commuter flows leaving the area
                                                                                                           (net of the same amount).
                                                                                                        Percentage ratio between the resident
     3           Demographic                   Iv                       Age index                       population aged 65 and over and the
                                                                                                             population in the class 0–14
                                                                                                      Ratio between the foreign population and
     4           Demographic                   Is            Incidence of foreign residents
                                                                                                        the resident population per thousand
                                                                                                  Percentage ratio between the population in
                                                             Index of non-completion of the       the age group 15–52 who did not graduate
     5             Education               Insm
                                                               first-cycle secondary school        from the lower secondary school and the
                                                                                                    total population of the same age group
                                                                                                  Percentage ratio between jobseekers and the
     6              Economic                   Td                   Unemployment rate
                                                                                                                   labor force
                                                                                                  Percentage ratio of the resident population
                                                               Incidence of young people          in the 15–29 age group in non-professional
     7        Social vulnerability         Neet               outside the labor market and          condition other than a student and the
                                                                        training                      resident population in the same age
                                                                                                            group-enlarged NEETs
                                                                                                      Percentage ratio of the number of families
                                                               Incidence of families with
     8        Social vulnerability          Fde                                                         with children whose reference person
                                                                potential economic risk
                                                                                                                       has until

                                          Two variables defining the economic situation of the householder and the area were
                                     introduced into the mode: Average income and the commercial vocation of the area.
                                          Average income of the residents: The model first analyzes the relationship between
                                     price and rents with the average income of residents. After the analysis of income and
                                     rent, even the change in income declared IRPEF does not seem to have a general direct
                                     correlation for all the municipalities of the Metropolitan City of Milan with the change in
                                     the residential real estate value; it can be seen how the territorial generalization cannot be
Sustainability 2021, 13, 3612                                                                                                                                                             13 of 25

                                                             applied in this context. As can be seen in the graph (Figure 4) where every municipality
                                      integrating the Metropolitan City of Milan was represented as a point considering its14IRPEF
Sustainability 2021, 13, x FOR PEER REVIEW                                                                                    of 26
                                                             and its average housing price, there is no direct relation between the IRPEF and the average
                                                             price of residences.

                                       2400
                                                                                                                                                      34
                                                                                                                                                                                    111
                                       2200                                                                                                                          104

                                                                                                              78                                                                4
                                                                                                    113 17
          Average price(2016) [€/m2]

                                       2000                                      39
                                                                                   41                                49       80         6
                                                                                   91
                                                                                   46      87                                           19
                                                                                 102             71
                                                                                                 6444 70
                                       1800                                              37 106        97
                                                                                                      83        55
                                                                                                                    21
                                                                                              38 279 52                                31                  88
                                                                                                       128
                                                                                                 16 45  85
                                       1600                   7                            53 603089
                                                                                         112                      11554 62
                                                                                             63 184   92 65 130 124
                                                                                                    107          61
                                                                                        90      1108 94
                                                                                                      76  59
                                                                                      116 3134        29
                                                                                                      95               132
                                                                                      75 50   36125
                                                                                                2 691016826
                                                                                                          5743
                                                                                                             126
                                                                                    20 25    121114    109
                                                                                                       96                                    67
                                       1400                                                    8666
                                                                                          119123
                                                                                               131   5 1511 118
                                                                                                    117
                                                                                                  14133
                                                                                                  93           32 514035
                                                                                     77
                                                                           74        13 7233108  105 42 12
                                                                                                28
                                                                                 12256
                                                                                 82     18 814798 2358 99 24
                                                                                              22                                      100
                                                                                            129 127             120
                                       1200                                                       103         79

                                       1000
                                          16,000   18,000         20,000        22,000            24,000       26,000        28,000          30,000         32,000     34,000
                                                                                                    IRPEF (2016) [€/dich.]

      Figure 4. IRPEF (Imposta sul Reddito delle Persone Fisiche) vs. OMI average price, municipalities of the Metropolitan city.
     Figure 4. IRPEF (Imposta sul Reddito delle Persone Fisiche) vs. OMI average price, municipalities of the Metropolitan city.
                                                                    Commercial aim: This variable represents the importance that is given to areas that
                                                              are Commercial        aim: This
                                                                  active for shopping,             variable
                                                                                                stores,         represents
                                                                                                           restaurants,       theand
                                                                                                                            etc.,   importance
                                                                                                                                        is measuredthat by
                                                                                                                                                         is given    to areasofthat
                                                                                                                                                             the presence        the
                                                            are  active for
                                                             “Districts        shopping, stores,
                                                                          of Commerce”,                  restaurants,
                                                                                                 as defined               etc., and of
                                                                                                                  in the geoportal    is measured
                                                                                                                                          the city of by    the presence of the
                                                                                                                                                       Milan.
                                                            “Districts   of Commerce”,
                                                                    As regards     the spatial  as variables,
                                                                                                    defined inthe   theresearch
                                                                                                                        geoportal     of the city
                                                                                                                                   adopted         of Milan.
                                                                                                                                              the same     variables adopted by
                                                                  As regards
                                                              the IMO.            the spatial
                                                                          Therefore:              variables,
                                                                                         condition;      distancethetoresearch    adopted
                                                                                                                        the center;   averagetheyear
                                                                                                                                                 sameofvariables      adopted
                                                                                                                                                           construction;         by
                                                                                                                                                                            average
                                                              number
                                                            the          of floors; presence
                                                                 IMO. Therefore:         condition; of commercial
                                                                                                         distance to the services;
                                                                                                                             center;presence
                                                                                                                                       average of   green
                                                                                                                                                  year       spaces; presence
                                                                                                                                                         of construction;     aver-of
                                                              public
                                                            age  numbertransportation;        parkingofavailability;
                                                                            of floors; presence             commercialroad         connections;
                                                                                                                            services;   presence commercial
                                                                                                                                                    of green spaces;vocation;   and
                                                                                                                                                                          presence
                                                            offinally,
                                                                publicquality     of the area.
                                                                        transportation;        parking availability; road connections; commercial vocation; and
                                                            finally,Therefore,
                                                                      quality ofitthe is important
                                                                                          area.           to understand in which magnitude each of these charac-
                                                              teristics  affect  the  price    of  the   area:
                                                                  Therefore, it is important to understand       Hence the      single magnitude
                                                                                                                           in which     transaction,eachthe ofcharacteristics   that
                                                                                                                                                                 these character-
                                                            istics affect the price of the area: Hence the single transaction, the characteristics that referof
                                                              refer to  the  intrinsic     state  of  each     individual    property     (prevailing     state,  average    year
                                                            toconstruction,
                                                                the intrinsicaverage
                                                                                 state of area,
                                                                                              each and      averageproperty
                                                                                                     individual        number (prevailing
                                                                                                                                   of floors) are   already
                                                                                                                                                 state,  averageconsidered
                                                                                                                                                                     year of in  the
                                                                                                                                                                               con-
                                                             “condition”
                                                            struction,       of thearea,
                                                                         average       building.     The other
                                                                                              and average            characteristics
                                                                                                                number                  depend
                                                                                                                           of floors) are         on considered
                                                                                                                                            already   the spatial arrangement
                                                                                                                                                                      in the “con-
                                                              of eachoftransaction,
                                                            dition”       the building.   to identify
                                                                                               The other  which     factors are more
                                                                                                              characteristics     depend important     a qualitative
                                                                                                                                             on the spatial              analysisofis
                                                                                                                                                                 arrangement
                                                              proposed     for  the city    of Milan.
                                                            each transaction, to identify which factors are more important a qualitative analysis is
                                                            proposedThisfor
                                                                          analysis
                                                                              the city is of
                                                                                           conducted
                                                                                              Milan. with the aim of identifying the factors that, in addition to
                                                              the special   characteristics
                                                                  This analysis is conducted     of each withdistrict  (new
                                                                                                                 the aim   of developments
                                                                                                                               identifying theand      real that,
                                                                                                                                                  factors    estateinprojects),
                                                                                                                                                                       additioncan
                                                                                                                                                                                 to
                                                              influence   the   price   change     in  some     way.
                                                            the special characteristics of each district (new developments and real estate projects), can
                                                                    According
                                                            influence    the price to change
                                                                                      Istat (2017)
                                                                                                 in somethe quotations
                                                                                                              way.          of neighborhoods, zones, and municipalities
                                                              are closely
                                                                  According correlated
                                                                                 to Istatwith(2017)their
                                                                                                      the distance
                                                                                                            quotations from   the city center. zones, and municipalities
                                                                                                                          of neighborhoods,
                                                                    Presence     of public      services     is measured
                                                            are closely correlated with their distance from the city center.  through     the presence of public healthcare
                                                              infrastructures,     schools,     and   universities,
                                                                  Presence of public services is measured through the   as reported     in thepresence
                                                                                                                                               geoportal   of of the municipality
                                                                                                                                                               public   healthcare
                                                              of Milan.
                                                            infrastructures, schools, and universities, as reported in the geoportal of the municipality
                                                                    Presence of public green space is measured through different indicators: Parks Prox-
                                                            of Milan.
                                                              imity Index: Influence of each green area classified as Urban Park (ParkP) over the distance
                                                                  Presence of public green space is measured through different indicators: Parks Prox-
                                                              to each transaction.
                                                            imity Index: Influence of each green area classified as Urban Park (ParkP) over the dis-
                                                                    Urban vegetation proximity index (GrVegP): Influence of the areas classified as urban
                                                            tance to each transaction.
                                                              vegetation (ISTAT4) over the distance of each transaction.
                                                                  Urban vegetation proximity index (GrVegP): Influence of the areas classified as ur-
                                                            ban vegetation (ISTAT4) over the distance of each transaction.
                                                                  Special Green areas proximity index (SGrAP): Influence of the areas classified as
                                                            school gardens, vegetable gardens, cemeteries, and public gardens (ISTAT 5) on the dis-
                                                            tance of each transaction.
Sustainability 2021, 13, 3612                                                                                            14 of 25

                                      Special Green areas proximity index (SGrAP): Influence of the areas classified as school
                                gardens, vegetable gardens, cemeteries, and public gardens (ISTAT 5) on the distance of
                                each transaction.
                                      Urban Green area index: Influence of the areas classified as equipped green areas and
                                historic green areas (ISTAT 1,3) on the distance of each transaction.
                                      Regarding the level of transport services, this is measured as Metro Proximity Index
                                (Metro PI): Indicator of the proximity of metro stations.
                                      Status of the area: Weights from 1 to 6 (the highest, plus status) classify the different
                                areas of Milan, based on their status considerations, in function of urban land use.
                                      Iconic Places Proximity Index (IconPI): Proximity to iconic attractions for tourists in
                                the city, with a weight of 5 to 1 based on the number of their annual visitors.
                                      Regarding the intrinsic property variables or structural characteristics, as said before,
                                one limitation of the model is the fact that several characteristics of each house are in every
                                OMI area are reduced to one single state where buildings were given a number for their
                                corresponding condition (state); 4 for new, 3 for Perfect (renovated), 2 for Good, 1 for Bad
                                (to be renovated).
                                      The data administered by the Agenzia delle Entrate is measured according to their
                                ‘status’: Poor, normal, and excellent. The listing is then associated with this status. This is
                                an important factor, since it defines the only characteristic that refers to the condition of the
                                apartment. As can be seen in the two maps below, quotations change drastically due to
                                this factor.
                                      Finally, regarding other variables research considered: Contaminated areas Index
                                (ContAI): Influence of each site with soil and/or groundwater contamination (caused
                                by accidental events, spills, and illegal activity. Potentially Contaminated Areas Index
                                (PContAI): Influence of each potentially contaminated site (defined as a site where one
                                or more concentration values of the polluting substances detected in the environmental
                                matrices are higher than the concentration threshold values of contamination) over the
                                distance to each transaction.
                                      Furthermore, Air Quality Indexes: According to the 2018 air quality measuring sta-
                                tions, a density map was built through GIS, assigning a value of pollution for different
                                contaminant agents: C6 H6 (Benzene, a monocyclic aromatic hydrocarbon), CO_8H (Carbon
                                monoxide (CO), indicates the average concentration over 8 h), NO2 (Nitrogen dioxide),
                                PM10 (Powders with diameter less than 10 µm). Values were measured in g/m3 .

                                6. Model’s Goodness of Fit: Results Analysis
                                     All the collected information from official sources and from the definition of the
                                variables mentioned was modelled through a hedonic model. The sample for the dependent
                                variable, namely the price per square meter of a residential property in Milan, consisted
                                of 352 residential transactions that occurred in the city during the third quarter of 2019 as
                                shown in Figure 5, all properties distributed across the city to give the highest possible
                                coverage, and discretizing all the information into a GIS supported platform.
                                     The discretization of the intrinsic characteristics of each property consisted in the
                                definition of a scale to describe the state of conservation of the property: The house
                                State (State), from 1 to 5, 1 being a decadent state and 5 as an optimal state, the spatial
                                distribution of the property was evidenced through the number of Rooms (Rooms), the
                                year of construction of the building was discretized as Old coefficient (OldCo), the lower
                                the value the older the building, the Distance to the city Center (DistCBD), Distance to a
                                Metro Station (MetroPi), and finally the socio-economic characteristics of the neighborhood
                                were described through the variable Status of neighborhood (NeighSt).
You can also read