Heterogeneity and chemical reactivity of the remote troposphere defined by aircraft measurements
←
→
Page content transcription
If your browser does not render page correctly, please read the page content below
Atmos. Chem. Phys., 21, 13729–13746, 2021
https://doi.org/10.5194/acp-21-13729-2021
© Author(s) 2021. This work is distributed under
the Creative Commons Attribution 4.0 License.

Heterogeneity and chemical reactivity of the remote troposphere
defined by aircraft measurements
Hao Guo1 , Clare M. Flynn2 , Michael J. Prather1 , Sarah A. Strode3 , Stephen D. Steenrod3 , Louisa Emmons4 ,
Forrest Lacey4,5 , Jean-Francois Lamarque4 , Arlene M. Fiore6 , Gus Correa6 , Lee T. Murray7 , Glenn M. Wolfe3,8 ,
Jason M. St. Clair3,8 , Michelle Kim9 , John Crounse10 , Glenn Diskin10 , Joshua DiGangi10 , Bruce C. Daube11,12 ,
Roisin Commane11,12 , Kathryn McKain13,14 , Jeff Peischl14,15 , Thomas B. Ryerson13,15 , Chelsea Thompson13 ,
Thomas F. Hanisco3 , Donald Blake16 , Nicola J. Blake16 , Eric C. Apel4 , Rebecca S. Hornbrook4 , James W. Elkins14 ,
Eric J. Hintsa13,14 , Fred L. Moore13,14 , and Steven Wofsy11
1 Department  of Earth System Science, University of California, Irvine, CA 92697, USA
2 Department  of Meteorology, Stockholm University, Stockholm 106 91, Sweden
3 Atmospheric Chemistry and Dynamics Laboratory, NASA Goddard Space Flight Center, Greenbelt, MD 20771, USA
4 Atmospheric Chemistry Observations and Modeling Laboratory, National Center for Atmospheric Research,

Boulder, CO 80301, USA
5 Department of Mechanical Engineering, University of Colorado, Boulder, CO 80309, USA
6 Department of Earth and Environmental Sciences and Lamont-Doherty Earth Observatory,

Columbia University, Palisades, NY 10964, USA
7 Department of Earth and Environmental Sciences, University of Rochester, Rochester, NY 14611, USA
8 Joint Center for Earth Systems Technology, University of Maryland, Baltimore County, Baltimore, MD 21228, USA
9 Department of Geological and Planetary Sciences, California Institute of Technology, Pasadena, CA 91125, USA
10 Atmospheric Composition, NASA Langley Research Center, Hampton, VA 23666, USA
11 John A. Paulson School of Engineering and Applied Sciences, Harvard University, Cambridge, MA 02138, USA
12 Department of Earth and Planetary Sciences, Harvard University, Cambridge, MA 02138, USA
13 Cooperative Institute for Research in Environmental Sciences, University of Colorado, Boulder, CO 80309, USA
14 Global Monitoring Division, Earth System Research Laboratory, NOAA, Boulder, CO 80305, USA
15 Chemical Sciences Division, National Oceanic and Atmospheric Administration Earth System Research Laboratory,

Boulder, CO 80305, USA
16 Department of Chemistry, University of California, Irvine, CA 92697, USA

Correspondence: Hao Guo (haog2@uci.edu) and Michael J. Prather (mprather@uci.edu)

Received: 13 May 2021 – Discussion started: 19 May 2021
Revised: 20 August 2021 – Accepted: 24 August 2021 – Published: 16 September 2021

Abstract. The NASA Atmospheric Tomography (ATom)               organic nitrates), consisting of 146 494 distinct air parcels
mission built a photochemical climatology of air parcels       from ATom deployments 1 through 4. Six models calculated
based on in situ measurements with the NASA DC-8 air-          the O3 and CH4 photochemical tendencies from this model-
craft along objectively planned profiling transects through    ing data stream for ATom 1. We find that 80 %–90 % of the
the middle of the Pacific and Atlantic oceans. In this paper   total reactivity lies in the top 50 % of the parcels and 25 %–
we present and analyze a data set of 10 s (2 km) merged and    35 % in the top 10 %, supporting previous model-only studies
gap-filled observations of the key reactive species driving    that tropospheric chemistry is driven by a fraction of all the
the chemical budgets of O3 and CH4 (O3 , CH4 , CO, H2 O,       air. In other words, accurate simulation of the least reactive
HCHO, H2 O2 , CH3 OOH, C2 H6 , higher alkanes, alkenes,        50 % of the troposphere is unimportant for global budgets.
aromatics, NOx , HNO3 , HNO4 , peroxyacetyl nitrate, other     Surprisingly, the probability densities of species and reactiv-

Published by Copernicus Publications on behalf of the European Geosciences Union.
13730                                       H. Guo et al.: Heterogeneity and chemical reactivity of the remote troposphere

ities averaged on a model scale (100 km) differ only slightly         Models also reported the change in O3 over 24 h, and these
from the 2 km ATom data, indicating that much of the het-          match the P-O3 minus L-O3 values over the Pacific basin
erogeneity in tropospheric chemistry can be captured with          (a focus of this study). The models showed a wide range
current global chemistry models. Comparing the ATom reac-          in the three Rs average profiles across latitudes over the Pa-
tivities over the tropical oceans with climatological statistics   cific basin, as well as 2D probability densities (PDs) for key
from six global chemistry models, we find excellent agree-         species such as NOx (NO + NO2 ) versus HOOH. A large
ment with the loss of O3 and CH4 but sharp disagreement            part of the model differences was attributed to the large dif-
with production of O3 . The models sharply underestimate O3        ferences found in chemical composition. We found that sin-
production below 4 km in both Pacific and Atlantic basins,         gle transects from a model through the tropical Pacific at dif-
and this can be traced to lower NOx levels than observed. At-      ferent longitudes produced nearly identical 2D PDs, but these
taching photochemical reactivities to measurements of chem-        PDs were distinctly different across models. This result sup-
ical species allows for a richer, yet more constrained-to-         ported the premise that the ATom PDs would provide a useful
what-matters, set of metrics for model evaluation.                 metric for global chemistry models.
                                                                      In P2017, we established a method for running the chem-
                                                                   istry modules in the CTMs and CCMs with an imposed
1       Prologue                                                   chemical composition from aircraft data: the ATom run, or
                                                                   “A run”. In the A run, the chemistry of each grid cell does not
This paper is based on the methods and results of papers           interact with its neighbors or with externally imposed emis-
that established an approach for analyzing aircraft mea-           sion sources. Effectively the CTM/CCM is initialized and run
surements, specifically the NASA Atmospheric Tomogra-              for 24 h without transport, scavenging or emissions. Aerosol
phy Mission (ATom), with global chemistry models. Here             chemistry is also turned off in the A runs. This method al-
we present a brief overview of those papers to help the            lows each parcel to evolve in response to the daily cycle of
reader understand the basis for this paper. The first ATom         photolysis in each model and be assigned a 24 h integrated
modeling paper (“Global atmospheric chemistry – which air          reactivity. The instantaneous reaction rates at the time an air
matters”, Prather et al., 2017, hence P2017) gathered six          parcel is measured (e.g., near sunset at the end of a flight) do
global models, both chemistry–transport models (CTMs) and          not reflect that parcel’s overall contribution to the CH4 or O3
chemistry–climate models (CCMs). The models reported a             budget; a full diel cycle is needed. The A run assumption that
single-day snapshot for mid-August (the time of the first          parcels do not mix with neighboring air masses is an approx-
ATom deployment, ATom-1), and these included all species           imation, and thus for each model we compared the A runs
relevant for tropospheric chemistry and the 24 h reactivities.     using the model’s restart data with a parallel standard 24 h
We limited our study to three reactivities (Rs) controlling        simulation (including transport, scavenging, and emissions).
methane (CH4 ) and tropospheric ozone (O3 ) using specific         Because the standard grid-cell air moves and mixes, we com-
reaction rates to define the loss of CH4 and the production        pared averages over a large region (e.g., tropical Pacific). We
and loss of O3 in parts per billion (ppb) per day. The critical    find some average biases of order ±10 % but general agree-
photolysis rates (J values) are also reported as 24 h averages.    ment. The largest systematic biases in the A runs are caused
                                                                   by buildup of HOOH (no scavenging) and decay of NOx (no
L-CH4 : CH4 + OH → CH3 + H2 O(1)                            (1)    sources). The A runs are relatively easy to code for most
                                                                   CTM/CCMs and allow each model’s chemistry module, in-
                                                                   cluding photolysis package, to run normally. The A runs do
                                                                   not distinguish between CTMs and CCMs, except that each
P-O3 : HO2 + NO → NO2 + RO                                 (2a)
                                                                   model will generate/prescribe its own cloud fields and pho-
RO2 + NO → NO2 + RO,                                       (2b)    tolysis rates. Our goal is to create a robust understanding of
where NO2 + hν → NO + O and O + O2 → O3                    (2c)    the chemical statistics including the reactivities with which to
O2 + hν → O + O(x2)                                        (2d)    test and evaluate the free-running CCMs, and thus we do not
                                                                   try to model the specific period of the ATom deployments.
                                                                   Others may use the ATom data with hindcast CTMs to test
                                                                   forecast models, but here we want to build a chemical clima-
L-O3 : O3 + OH → O2 + HO2                                  (3a)    tology.
O3 + HO2 → HO + O2 + O2                                    (3b)       The first hard test of the A runs came with the second
    1
O( D) + H2 O → OH + OH                                     (3c)    ATom modeling paper (“How well can global chemistry
                                                                   models calculate the reactivity of short-lived greenhouse
                                                                   gases in the remote troposphere, knowing the chemical com-
J-O1D : O3 + hν → O(1 D) + O2                               (4)    position”, Prather et al., 2018, hence P2018). The UCI CTM
J-NO2 : NO2 + hν → NO + O                                   (5)    simulated an aircraft-like data set of 14 880 air parcels along
                                                                   the International Date Line from a separate high-resolution

Atmos. Chem. Phys., 21, 13729–13746, 2021                                          https://doi.org/10.5194/acp-21-13729-2021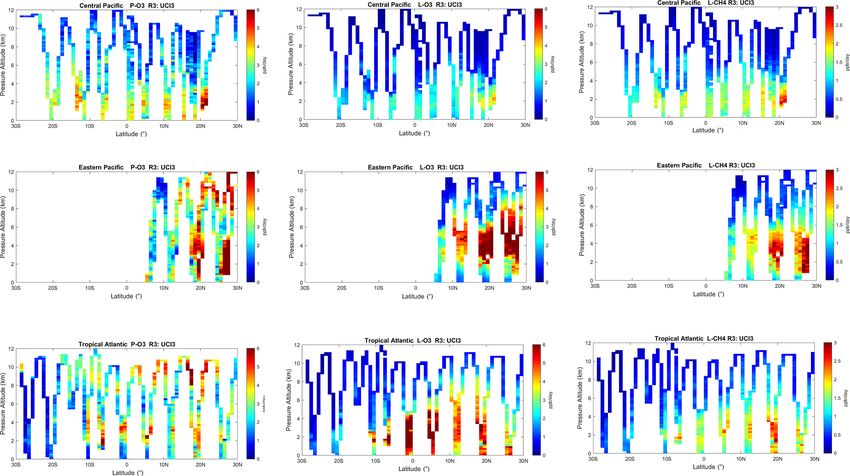
H. Guo et al.: Heterogeneity and chemical reactivity of the remote troposphere                                                 13731

(0.5◦ ) model. Each parcel is defined by the following core          through the middle of the Pacific Ocean, across the South-
species: H2 O, O3 , NOx , HNO3 , HNO4 , PAN (peroxyacetyl            ern Ocean and then north through the Atlantic Ocean, with
nitrate), CH3 NO3 , HOOH, CH3 OOH, HCHO, CH3 CHO (ac-                near-constant profiling of the marine troposphere from 0.2
etaldehyde), C3 H6 O (acetone), CO, CH4 , C2 H6 , alkanes            to 12 km altitude (see Fig. S1 in the Supplement). The DC8
(C3 H8 and higher), C2 H4 , aromatics (benzene, toluene, xy-         was equipped with in situ instruments that documented the
lene) and C5 H8 (isoprene), plus temperature. Short-lived rad-       chemical composition and conditions at time intervals rang-
icals (e.g., OH, HO2 , CH3 OO) were initialized at small con-        ing from < 1 to about 100 s (Wofsy et al., 2018). ATom mea-
centrations and quickly reached daytime values determined            sured hundreds of gases and aerosols, providing information
by the core species. The six CTM/CCMs overwrote the                  on the chemical patterns and reactivity in the vast remote
chemical composition of a restart file, placing each pseudo-         ocean basins, where most of the destruction of tropospheric
observation in a unique grid cell according to its latitude,         ozone (O3 ) and methane (CH4 ) occurs. Reactivity is defined
longitude, and pressure. If another parcel is already in that        here as in P2017 to include the production and loss of O3 (P-
cell, then it is shifted east–west or north–south to a neighbor-     O3 and L-O3, ppb/d) and loss of CH4 (L-CH4, ppb/d). Here
ing model cell. For coarse-resolution models, multiple restart       we report on this model-derived product that was proposed
files and A runs were used to avoid large location shifts.           for ATom, the daily averaged reaction rates determining the
CTM/CCMs usually have a locked in 24 h integration step              production and loss of O3 and the loss of CH4 for 10 s aver-
starting at 00:00 UTC that is extremely difficult to modify in       aged air parcels. We calculate these rates with 3D chemical
order to try to match the local solar time of observation, espe-     models that include variations in clouds and photolysis and
cially as it changes along aircraft flights. We tested the results   then assemble the statistical patterns describing the hetero-
with a recoded UCI CTM to start at 12:00 UTC but retain the          geneity (i.e., high spatial variability) of these rates and the
same clouds fields over the day and found only percentage-           underlying patterns of reactive gases.
level differences between a midnight or noon start.                     Tropospheric O3 and CH4 contribute to climate warm-
   These A runs averaged over cloud conditions by simu-              ing and global air pollution (Stocker et al., 2013). Their
lating 5 d in August at least 5 d apart. Assessment of the           abundances in the troposphere are controlled largely by tro-
modeled photolysis rates and comparison with the ATom-               pospheric chemical reactions. Thus, chemistry–climate as-
measured J values is presented in Hall et al. (2018, hence           sessments seeking to understand past global change and
H2018). All models agreed that a small fraction of chemi-            make future projections for these greenhouse gases have fo-
cally hot air parcels in the synthetic data set controlled most      cused on the average tropospheric rates of production and
of the total reactivity. Some models had difficulty in imple-        loss and how these reactivities are distributed in large semi-
menting the A runs because they overwrote the specified wa-          hemispheric zones throughout the troposphere (Griffiths et
ter vapor with the modeled value, but this problem is fixed          al., 2021; Myhre et al., 2014; Naik et al., 2013; Prather et
here. In both P2017 and P2018, the GISS-E2 model stood               al., 2001; Stevenson et al., 2006, 2013, 2020; Voulgarakis
out with the most unusual chemistry patterns and sometimes           et al., 2013; Young et al., 2013). The models used in these
illogical correlations. Efforts by a co-author to clarify the        assessments disagree on these overall CH4 and O3 reactiv-
GISS results or identify errors in the implementation have not       ities (a.k.a. the budgets), and resolving the cause of such
been successful. GISS results are included here for complete-        differences is stymied because of the large number of pro-
ness in the set of three papers but are not reconciled. Overall,     cesses involved and the resulting highly heterogeneous dis-
three models showed remarkable inter-model agreement in              tribution of chemical species that drive the reactions. Simply
the three Rs with less than half of the RMSD (root-mean-             put, the models use emissions, photochemistry and meteoro-
square difference) as compared with the other models. UCI            logical data to generate the distribution of key species such
also tested the effect of different model years (1997 and 2015       as nitrogen oxides (NOx = NO + NO2 ) and hydrogen per-
versus reference year 2016), which varies the cloud cover and        oxide (HOOH) (step 1) and then calculate the CH4 and O3
photolysis rates, and found an inter-year RMSD about half of         reactivities from these species (step 2). There is no single
that of the core model’s RMSD. Thus, there is a fundamental          average measurement that can test the verisimilitude of the
uncertainty in this approach due to the inability to specify the     models. Stratospheric studies such as Douglass et al. (1999)
cloud/photolysis history seen by a parcel over 24 h, but it is       have provided a quantitative basis for testing chemistry and
less than the inter-model differences among the most similar         transport and defining model errors, but few of these studies
models.                                                              have tackled the problem of modeling the heterogeneity of
                                                                     tropospheric chemistry. The major model differences lie in
                                                                     the first step because when we specify the mix of key chemi-
2   Introduction                                                     cal species, most models agree on the CH4 and O3 chemical
                                                                     budgets (P2018). The intent of ATom was to collect an at-
The NASA Atmospheric Tomography (ATom) mission com-                  mospheric sampling of all the key species and the statistics
pleted a four-season deployment, each deployment flying              defining their spatial variability and thus that of the reactivi-
from the Arctic to Antarctic and back, traveling south               ties of CH4 and O3 .

https://doi.org/10.5194/acp-21-13729-2021                                          Atmos. Chem. Phys., 21, 13729–13746, 2021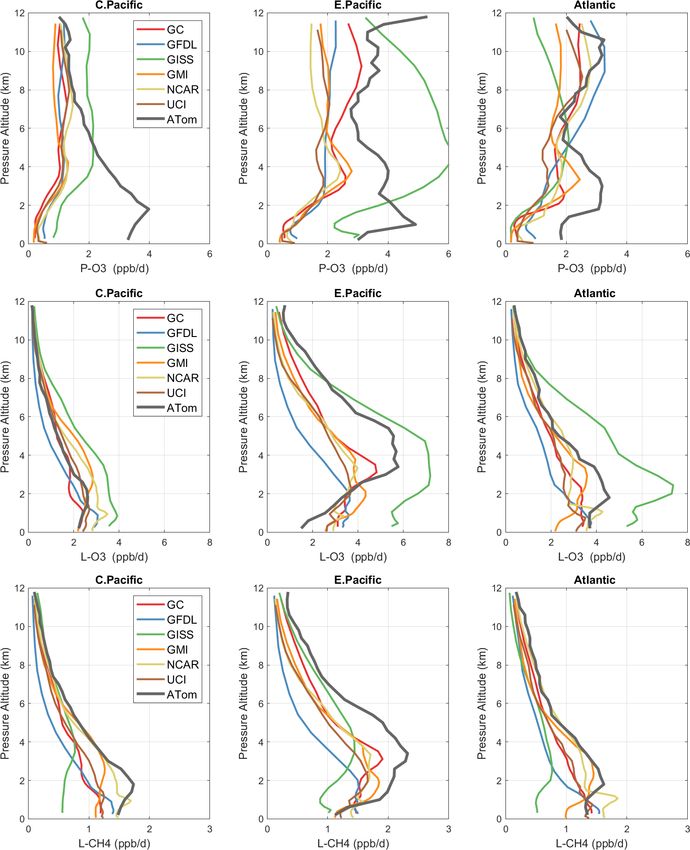
13732                                       H. Guo et al.: Heterogeneity and chemical reactivity of the remote troposphere

   Many studies have explored the ability of chemistry–            3     Models and data
transport models (CTMs) to resolve finer scales such as pol-
lution layers (Eastham and Jacob, 2017; Rastigejev et al.,         3.1    The modeling data stream (MDS)
2010; Tie et al., 2010; Young et al., 2018; Zhuang et al.,
2018), but these have not had the chemical observations            The ATom mission was designed to collect a multi-species,
(statistics) to evaluate model performance. In a great use of      detailed chemical climatology that documents the spatial pat-
chemical statistics, Yu et al. (2016) used 60 s data (∼ 12 km)     terns of chemical heterogeneity throughout the remote tropo-
from the SEAC4 RS aircraft mission to compare cumulative           sphere. Figure S1 in the Supplement maps the 48 research
probability densities (PDs) of NOx , O3 , HCHO and isoprene        flights, and the Supplement has tables summarizing each
over the Southeast US with the GEOS-Chem CTM run at                flight. We required a complete set of key species in each
different resolutions. They identified clear biases at the high    air parcel to initialize the models that calculate the CH4 and
and low ends of the distribution, providing a new test of mod-     O3 reactivities. We choose the key reactive species (H2 O,
els based on the statistics rather than mean values. Heald         O3 , CO, CH4 , NOx , PSSNOx (photostationary state NOx ),
et al. (2011) gathered high-resolution profiling of organic        HNO3 , HNO4 , PAN, CH2 O, H2 O2 , CH3 OOH, acetone, ac-
and sulfate aerosols from 17 aircraft missions and calculated      etaldehyde, C2 H6 , C3 H8 , i-C4 H10 , n-C4 H10 , alkanes, C2 H4 ,
statistics (mean, median, quartiles) but only compared with        alkenes, C2 H2 , C5 H8 , benzene, toluene, xylene, CH3 ONO2 ,
the modeled means. The HIAPER Pole-to-Pole Observations            C2 H5 ONO2 , RONO2 , CH3 OH) directly from the ATom mea-
(HIPPO) aircraft mission (Wofsy, 2011) was a precursor to          surements and then add corollary species or other observa-
ATom with regular profiling of the mid-Pacific including           tional data indicative of industrial or biomass burning pol-
high-frequency 10 s sampling that identified the small scales      lution or atmospheric processing (HCN, CH3 CN, SF6 , rel-
of variability throughout the troposphere. HIPPO measure-          ative humidity, aerosol surface area (four modes) and cloud
ments were limited in species, lacking O3 , NOx and many           indicator). We choose 10 s averages for our air parcels as a
of the core species needed for reactivity calculations. ATom,      compromise and because the 10 s merged data are a standard
with a full suite of reactive species and profiling through the    product (Wofsy et al., 2018). A few instruments measure at
Atlantic basin, provides a wealth of chemical statistics that      1 s intervals, but the variability at this scale is not that differ-
challenge the global chemistry models.                             ent from 10 s averages (Fig. S2). Most of the key species are
   Our task here is the assembly of the modeling data stream       reported as 10 s values, with some being averaged or sampled
(MDS), which provides flight-wise continuous 10 s data (air        at 30 s or longer such as ∼ 90 s for some flask measurements.
parcels) for the key reactive species. The MDS is based on            Throughout ATom, gaps occur in individual species on a
direct observations and interpolation methods to fill gaps as      range of timescales due to calibration cycles, sampling rates
documented the Supplement. Using the MDS, we have six              or instrument malfunction. The generation of the MDS uses
chemical models calculating the 24 h reactivities, producing       a range of methods to fill these gaps and assigns a flag index
a reactivity data stream (RDS) using protocols noted in the        to each species and data point to allow users to identify pri-
Prologue (P2017) and described further in Sect. 2. There, we       mary measurements and methods used for gap-filling. Where
describe the updated modeling protocol RDS∗ necessary to           two instruments measure the same species, the MDS selects
address measurement noise in key species that can be very          a primary measurement and identifies which instrument was
short-lived. In Sect. 4, we examine the statistics of reactivity   used with a flag. The methodology and species-specific in-
over the Atlantic and Pacific oceans, focusing on air parcels      formation on how the current MDS version 2 (MDS-2) is
with high reactivity; for example, 10 % of the parcels pro-        constructed, plus statistics on the 48 research flights and the
duce 25 %–35 % of total reactivity over the oceans. We com-        146 494 10 s air parcels in MDS-2, are given in the Supple-
pare these ATom-1 statistics, species and reactivities with        ment.
August climatologies from six global chemistry models. In             Over the course of this study, several MDS versions were
one surprising result, ATom-1 shows a more reactive trop-          developed and tested, including model-derived RDSs from
ical troposphere than found in most models’ climatologies          these versions, some of which are used in this paper. In early
associated with higher NOx levels than in the models. Sec-         ATom science team meetings, there was concern about the
tion 5 concludes that the ATom PDs based on 10 s air parcels       accuracy of NO2 direct measurements when at very low con-
do provide a valid chemistry metric for global models with         centrations. A group prepared an estimate for NOx using
1◦ resolution. It also presents some examples where ATom           the NO and O3 measurements to calculate a photostation-
measurements and modeling can test the chemical relation-          ary value for NO2 and thus NOx . This PSS-NOx became the
ships and may address the cause of differences in the O3 and       primary NOx source in version 0 (i.e., MDS-0). The num-
CH4 budgets currently seen across the models. With this pa-        bering of versions initially followed the notation of revisions
per we release the full ATom MDS-2 from all four deploy-           in the mission data archive (MDS_R0, MDS_R1, . . . ), but
ments, along with the updated RDS∗ reactivities from the           this was restrictive, and we adopted the simpler notation here
UCI model.                                                         but still beginning with version 0. With MDS-0, we chose to
                                                                   gap-fill using correlations with CO to estimate the variability

Atmos. Chem. Phys., 21, 13729–13746, 2021                                           https://doi.org/10.5194/acp-21-13729-2021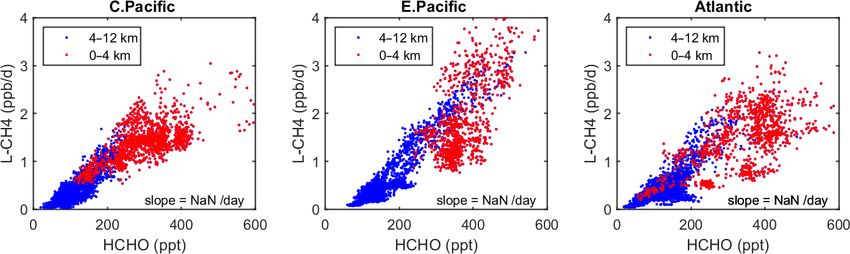
H. Guo et al.: Heterogeneity and chemical reactivity of the remote troposphere                                              13733

of the missing measurement over the gap. The science team         ing each ATom parcel inversely according to the number of
then rejected PSS-NOx as a proxy, and we reverted to the          parcels in each 10◦ latitude by 100 hPa bin. We calculate the
observed NO + NO2 for MDS-1, resulting in increased NOx           means and medians plus the percent of total reactivity in the
and reactivities (RDS-1). MDS-1 NOx values are 25 % larger        top 10 % of the weighted parcels (Table 2) and also the mean
on average than MDS-0 values (unweighted mean of 66 vs.           reactivity of the top 10 %, percent of total reactivity in the
52 ppt), and this affects P-O3 most and L-CH4 least. We then      top 50 %, 10 % and 3 % plus the mean J values (Table S8).
estimated errors in the gap-filling and found that CO had lit-       Unfortunately, while investigating sensitivities and uncer-
tle skill as a proxy for most other species. With MDS-2, we       tainties in the RDS for a future study, we found an inconsis-
optimized and tested the treatments of gap-filling and lower      tency between the reported concentrations of both pernitric
limit of detection, along with other quality controls. MDS-2      acid (HNO4 ) and peroxyacetyl nitrate (PAN) with respect
is fully documented in the Supplement.                            to the chemical kinetics used in the models. High concen-
                                                                  trations (attributed to instrument noise) were reported under
3.2   The reactivity data stream (RDS)                            conditions where the thermal decomposition frequency was
                                                                  > 0.4 per hour in the lower troposphere (> 253 K for HNO4
The concept of using an MDS to initialize 3D global chem-         and > 291 K for PAN). Thus, these species instantly become
istry models and calculate an RDS was developed in the pre-       NOx . There is no easy fix for this, and we left the species
ATom methodology papers (P2017; P2018). In this paper, we         data in the MDS as they were reported but developed a new
use the original six models for their August chemical statis-     protocol RDS∗ to deal with them. Both species are allowed
tics, and we use five of them plus a box model to calculate the   to decay for 24 h using their thermal decomposition rate be-
reactivities; see Table 1. The RDS is really a protocol applied   fore being put into the model. This avoids most of the fast
to the MDS. It is introduced in the Prologue, and the details     thermal release of NOx in the 24 h of the RDS calculation
can be found in P2018. A model grid cell is initialized with      but does not affect the release of NOx from photolysis or OH
all the core reactive species needed for a regular chemistry      reactions in the upper troposphere where thermal decompo-
simulation. The model is then integrated over 24 h without        sition in inconsequential. It is possible that some of the high
transport or mixing, without scavenging and without emis-         concentrations of HNO4 and PAN in the lower troposphere
sions. Each global model uses its own varying cloud fields        are real and that we are missing this large source of NOx
for the period to calculate photolysis rates, but the F0AM        with the RDS∗ protocol, but there are no obvious sources of
box model simply takes the instant J values as measured           these species in the remote oceanic regions that would pro-
on the flight and applies a diurnal scaling. We can initialize    duce enough to match the thermal loss. Both this problem
with the core species and let the radicals (OH, HO2 , RO2 )       and its solution do not affect the initial NOx . This revised
come into photochemical balance. The 24 h integration is not      protocol (UCI2∗ ) is shown in Tables 2 and S8 next to the
overly sensitive to the start time of the integration, and thus   standard protocol (UCI2). The reactivities drop slightly (3 %
models do not have to synchronize with the local time of ob-      for P-O3, 2 % for L-O3 and 0 % for L-CH4) as expected with
servation (see P2018’s Fig. S8 and Table S8).                     less NOx , but the sensitivity of the reactivities to these com-
    The initial RDS came from MDS-0 and six of the models         pounds (∂ ln R/∂ ln X) drops by a factor of 2 or more. We use
in Table 1. This paper was nearly complete when we iden-          the UCI2∗ results as our best estimate of the ATom reactivi-
tified the problem with PSS-NOx . We had gathered enough          ties for the figures in this paper.
information on how models agree, or disagree, with RDS-0
and thus chose to assess MDS-1 with two of the models that        3.3   Inter-model differences
closely agreed (GMI and UCI). The two models were very
close in RDS-0 and also in RDS-1. We then found the prob-         Variations in reactivities due to clouds are an irreducible
lems with the CO proxy and chose to use only the UCI model        source of uncertainty: predicting the cloud-driven photolysis
as a transfer standard for the change from MDS-1 to MDS-2         rates that a shearing air parcel will experience over 24 h is not
(i.e., RDS-1 to RDS-2). This path avoided much extra work         possible here. The protocol uses 5 separated 24 h days to av-
by the modeling groups and generated the same information         erage over synoptically varying cloud conditions. The stan-
on cross-model differences and a robust estimate of changes       dard deviation (σ ) of the 5 d, as a percentage of the 5 d mean,
from RDS-0 to RDS-2.                                              is averaged over all parcels and shown in Table S9 for the five
    Statistics for the three reactivities for six models using    global models. Three central models (GC, GMI, UCI) show
MDS-0, 2 alternative UCI model years using MDS-0, the             9 %–10 % σ (Js) values and similar σ (Rs) values as expected
GMI model using MDS-1 and the UCI model using MDS-                if the variation in J values is driving the reactivities. Two
2 are given in Tables 2 and S8 for three domains: global          models (GISS, NCAR) have 12 %–17 % σ (Js), which might
(all points), Pacific (oceanic data from 54◦ S to 60◦ N) and      be explained by more opaque clouds, but the amplified σ (R)
Atlantic (same constraints as Pacific). UCI MDS-1 is sim-         values (14 %–32 %) are inexplicable. This discrepancy needs
ilar to UCI MDS-2 and is not shown. The statistics try            to be resolved before using these two models for ATom RDS
to achieve equal latitude-by-pressure sampling by weight-         analysis.

https://doi.org/10.5194/acp-21-13729-2021                                       Atmos. Chem. Phys., 21, 13729–13746, 2021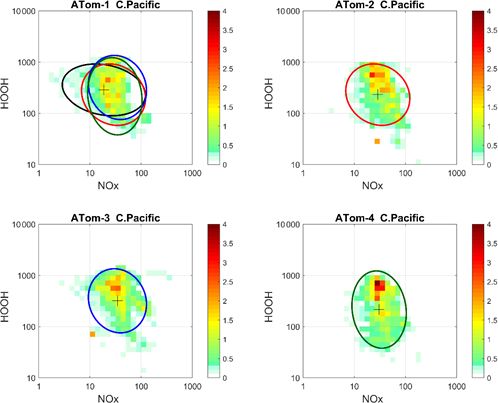
13734                                                    H. Guo et al.: Heterogeneity and chemical reactivity of the remote troposphere

Table 1. Chemistry models.

          Used for                 ID           Model name            Model type         Meteorology                                  Model grid
          clim                     GFDL         GFDL-AM3              CCM                NCEP (nudged)                                C180 × L48
          clim, MDS-0              GISS         GISS-E2.1             CCM                Daily SSTs, nudged to MERRA                  2◦ × 2.5◦ × 40L
          clim, MDS-0/1            GMI          GMI-CTM               CTM                MERRA                                        1◦ × 1.25◦ × 72L
          clim, MDS-0              GC           GEOS-Chem             CTM                MERRA-2                                      2◦ × 2.5◦ × 72L
          clim, MDS-0              NCAR         CAM4-Chem             CCM                Nudged to MERRA                              0.47◦ × 0.625◦ × 52L
          clim, MDS-0/1/2          UCI          UCI-CTM               CTM                ECMWF IFS Cy38r1                             T159N80 × L60
          MDS-0                    F0AM         F0AM                  box                MDS + scaled ATom Js                         n/a
        The descriptions of models used in the paper. The first column denotes if the model’s August climatology is used (“clim”) and also the MDS versions used.
        F0AM used chemical mechanism MCMv331 plus J-HNO4 plus O1 D)+CH4 . For the global models, see P2017, P2017 and H2018. n/a – not applicable

Table 2. Reactivity statistics for the three large domains (global, Pacific, Atlantic).

           Value       Region                                              MDS-0                                               MDS-1              MDS-2
                                     F0AM           GC      GISS       GMI        NCAR          UCI       U15        U97        GMI1         UCI2       UCI2∗
           P-O3, mean, ppb/d
                       Global           1.94      1.91        2.31      1.86         1.97       2.15      2.13       2.13          2.07       2.18         2.11
                       Pacific          1.91      1.95        1.94      1.92         1.92       2.13      2.08       2.10          2.06       2.33         2.26
                       Atlantic         1.88      1.99        3.29      2.07         2.28       2.32      2.32       2.34          2.22       2.08         2.02
           L-O3, mean, ppb/d
                       Global           1.63      1.45        1.75      1.50         1.51       1.56      1.55       1.55          1.50       1.57         1.54
                       Pacific          1.60      1.48        1.74      1.51         1.44       1.54      1.50       1.52          1.48       1.53         1.50
                       Atlantic         2.06      1.90        2.23      2.04         2.28       2.14      2.14       2.16          2.04       2.15         2.11
           L-CH4, mean, ppb/d
                       Global           0.72      0.66        0.38      0.65         0.62       0.68      0.68       0.68          0.67       0.68         0.68
                       Pacific          0.81      0.78        0.38      0.76         0.73       0.79      0.77       0.78          0.77       0.79         0.79
                       Atlantic         0.77      0.74        0.49      0.77         0.80       0.80      0.80       0.81          0.79       0.79         0.79
           P-O3, % of total R in top 10 %
                       Global           37 %      34 %       32 %      34 %         32 %       36 %      36 %       36 %          33 %       34 %         34 %
                       Pacific          34 %      28 %       28 %      29 %         29 %       31 %      30 %       30 %          28 %       27 %         27 %
                       Atlantic         25 %      26 %       24 %      27 %         25 %       28 %      28 %       28 %          25 %       25 %         25 %
           L-O3, % of total R in top 10 %
                       Global           37 %      37 %       35 %      38 %         38 %       38 %      39 %       39 %          39 %       38 %         38 %
                       Pacific          34 %      32 %       30 %      32 %         32 %       32 %      32 %       32 %          34 %       31 %         31 %
                       Atlantic         29 %      31 %       30 %      31 %         35 %       31 %      31 %       31 %          31 %       31 %         31 %
           L-CH4, % of total R in top 10 %
                       Global           36 %      33 %       29 %      34 %         34 %       35 %      35 %       35 %          35 %       33 %         33 %
                       Pacific          33 %      29 %       26 %      30 %         30 %       30 %      30 %       30 %          31 %       27 %         27 %
                       Atlantic         28 %      26 %       22 %      27 %         28 %       28 %      28 %       28 %          27 %       28 %         28 %
         Global includes all ATom-1 parcels, Pacific considers all measurements over the Pacific Ocean from 54◦ S to 60◦ N and Atlantic uses parcels from 54◦ S to
         60◦ N over the Atlantic basin. All parcels are weighted inversely by the number of parcels in each 10◦ latitude by 100 hPa bin. Results from the different
         MDS versions (0, 1, 2) are shown. UCI2∗ uses the revised RDS∗ protocol that preprocesses the MDS-2 initializations with a 24 h decay of HNO4 and PAN
         according to their local thermal decomposition frequencies; see text. See additional statistics in Table S8.

Atmos. Chem. Phys., 21, 13729–13746, 2021                                                                      https://doi.org/10.5194/acp-21-13729-2021
H. Guo et al.: Heterogeneity and chemical reactivity of the remote troposphere 13735
Table 3. Cross-model rms differences (RMSDs as a percentage of 4 Results
mean) for the three reactivities.
Our analysis of the reactivities uses the six-model RDS-0 re-
P-O3 F0AM GC GISS GMI NCAR UCI sults to examine the consistency in calculating the Rs across
F0AM 48 % 95 % 45 % 55 % 42 % models. Thereafter, we rely on the similar results from the
GC 48 % 78 % 26 % 42 % 32 % three central models (GC, GMI, UCI) to justify use of UCI
GISS 95 % 78 % 81 % 72 % 75 % RDS∗ -2 as our best estimate for ATom reactivities. The un-
GMI 45 % 26 % 81 % 40 % 35 % certainty in this estimate can be approximated by the inter-
NCAR 55 % 42 % 72 % 40 % 42 % model spread of the central models as discussed above. When
UCI 42 % 32 % 75 % 35 % 42 % (10 %)
evaluating the model’s climatology for chemical species, we
L-O3 use MDS-2. A summary of the key data files used here, as
F0AM 40 % 44 % 43 % 76 % 38 % well as their sources and contents, is given in Table 4.
GC 40 % 33 % 25 % 60 % 24 %
GISS 44 % 33 % 36 % 66 % 30 % 4.1 Probability densities of the reactivities
GMI 43 % 25 % 36 % 62 % 28 %
NCAR 76 % 60 % 66 % 62 % 60 % The reactivities for three large domains (global, Pacific, At-
UCI 38 % 24 % 30 % 28 % 60 % (11 %)
lantic) from the six-model RDS-0 are summarized in Tables 2
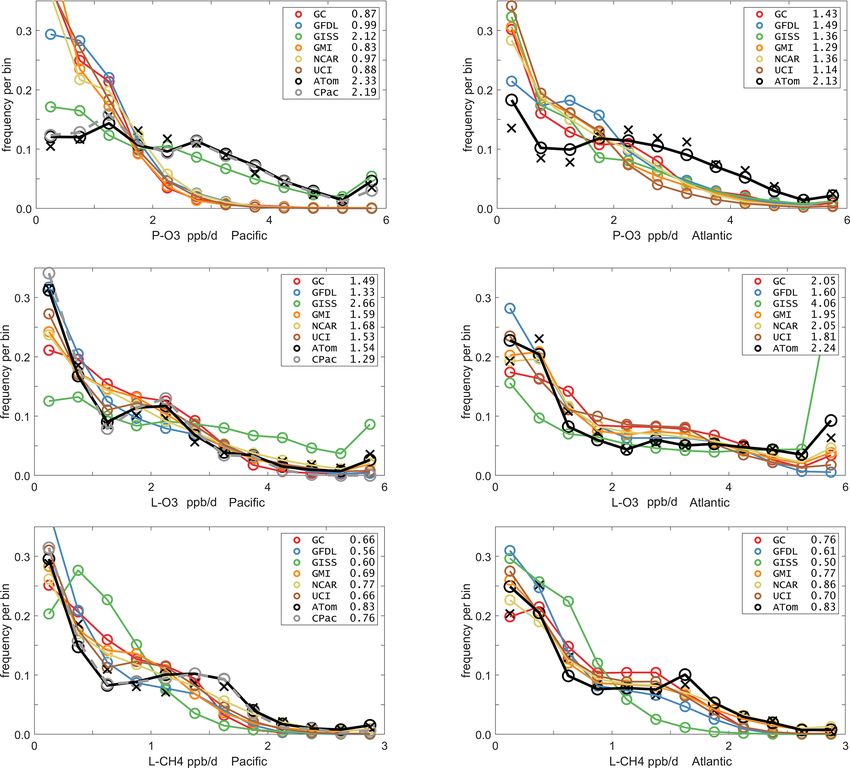
L-CH4 and S8. Sorted PDs for the three Rs and Pacific and Atlantic
F0AM 47 % 136 % 48 % 82 % 45 % Ocean basins are plotted in Fig. 1 and show the importance
GC 47 % 111 % 20 % 60 % 27 % of the most reactive “hot” parcels with deeply convex curves
GISS 136 % 111 % 114 % 110 % 121 % and the sharp upturn in R values above 0.9 cumulative weight
GMI 48 % 20 % 114 % 57 % 30 % (top 10 %). Both basins show a similar emphasis on the most
NCAR 82 % 60 % 110 % 57 % 68 % reactive hot parcels: 80 %–90 % of total R is in the top 50 %
UCI 45 % 27 % 121 % 30 % 68 % (14 %) of the parcels, 25 %–35 % is in the top 10 % and about 10 %–
Matrices are symmetric. Calculated with the 31 376 MDS-0 unweighted parcels using the
standard RDS protocol. F0AM lacks 5510 of these parcels because there are no reported 14 % is in the top 3 %. The corollary is that the bottom 50 %
J values. UCI shows RMSD between years 2016 (default) and 1997 as the value in parcels control only 10 %–20 % of the total reactivity, which
parentheses on diagonal. The unweighted mean R values from three core models (GC,
GMI, UCI) are P-O3 = 1.97, L-O3 = 1.50 and L-CH4 = 0.66; all are in units of ppb/d. is why the median is less than mean (except for P-O3 in the
The three core-model RMSDs are shown in bold. Atlantic). Each R value and each ocean has a unique shape;
for example L-O3 in the Atlantic is almost two straight lines
breaking at the 50th percentile. In Fig. 1 the agreement across
Inter-model differences are shown in the parcel-by-parcel all models (except GISS) is clear, indicating that the con-
root-mean-square (rms) differences for RDS-0 in Table 3. clusion in P2018 (i.e., that most global chemistry models
Even when models adopt standard kinetic rates and cross sec- agree on the O3 and CH4 budgets if given the chemical com-
tions (i.e., Burkholder et al., 2015), the number of species and position) also holds for the ATom-measured chemical com-
chemical mechanisms included, as well as the treatment of position. Comparing the dashed brown (UCI, RDS-0) and
families of similar species or intermediate short-lived reac- black (UCIP, RDS∗ -2) lines, we find that the shift to observed
tion products, varies across models. For example, UCI con- NOx and new HNO4 +PAN protocol has introduced notice-
siders about 32 reactive gases, whereas GC and GMI have able changes only for P-O3: increasing reactivities overall
over 100, and F0AM has more than 600. The other major in the Pacific while decreasing them slightly in the Atlantic.
difference across models is photolysis, with models having From Table 2, these changes primarily affected mean P-O3
different cloud data and different methods for calculating and were due primarily to the shift from MDS-0 to MDS-2
photolysis rates in cloudy atmospheres (H2018). The three and secondarily to the RDS∗ protocol, which reduced both
central models (GC, GMI, UCI) in terms of their 5 d vari- P-O3 and L-O3 in both basins. We conclude that accurate
ability (Table S9) are also most closely alike in these statis- modeling of chemical composition of the 80th and greater
tics, with rms = 20 %–30 % for L-CH4 up to 26 %–35 % for percentiles is important but that modest errors in the lowest
P-O3. These rms values appear to be about as close as any 50th percentile are inconsequential; effectively, some parcels
two models can get. The intra-model rms for different years matter more than others (P2017).
(UCI 2016 versus 1997) is 10 %–13 % and shows that we are How well does this ATom analysis work as a model in-
seeing basic differences in the chemical models across GC, tercomparison project? Overall, we find that most models
GMI and UCI. F0AM is the closest to the central models, but give similar results when presented with the ATom-1 MDS.
it will inherently have a larger rms because it is a 1 d calcula- The broad agreement of the cumulative reactive PDs across a
tion and not a 5 d average. NCAR’s rms is consistently higher range of model formulations using differing levels of chem-
and likely related to what is seen in the 5 d σ values in Ta- ical complexity shows this approach is robust. The different
ble S9. GISS is clearly different from all the others (L-CH4 protocols for calculating reactivities as well as the uncer-
MS > 100 %, while L-O3 rms < 66 %). tainty in cloud fields appear to have a small impact on the
https://doi.org/10.5194/acp-21-13729-2021 Atmos. Chem. Phys., 21, 13729–13746, 202113736 H. Guo et al.: Heterogeneity and chemical reactivity of the remote troposphere
Table 4. ATom data files used here.
Primary aircraft data Formatting and content Comments
(a) Mor.all.at1234.2020-05-27.tbl (a) 149 133 records × 675 csv columns, 10 s merges Core source of ATom measurements. irregu-
(b) Mor.WAS.all.at1234.2020-05-27.tbl of flight data plus chemistry & environmental measure- lar and difficult formatting; extremely long asci
(c) Mor.TOGA.all.at1234.2020-05-27.tbl ments records; large negative integers or “NA” for
All from Wofsy et al. (2018). (b) 6991 records × 729 csv columns, 30–120 s intervals some non-data.
to fill flasks
(c) 12 168 records × 727 csv columns, 35 s intervals of
instrument
Modeling data stream (MDS-2)
(a) MDS_DC8_20160729_R3.ict (a) ATom-1: 32 383 records × 87 csv columns, 10 s in- Regular formatting; all data gap-filled; NaNs
(b) MDS_DC8_ 20170126_ R4.ict tervals of chemical & other data, plus flags to indicate only for flight 46; for use in modeling of the
(c) MDS_DC8_20170928_R4.ict gap-filling chemistry and related statistics from the ATom
(d) MDS_DC8_ 20180424_R4.ict (b) ATom-2: 33 424 records × 87 csv columns 10 s data.
(e) ATom_MDS.nc (c) ATom-3: 40 176 records × 87 csv columns
Derived here. (d) ATom-4: 40 511 records × 87 csv columns
(e) ATom MDS-2: all data in netcdf
Reactivity data stream (RDS∗ -2)
(a) RDS_DC8_20160729_R1.ict (a) ATom-1: 32 383 records × 16 csv columns, 10 s in- Results from UCI CTM only, using RDS∗ pro-
(b) RDS_DC8_ 20170126_ R1.ict tervals of flight data, modeled reactivities & J values tocol and MDS-2; NaNs only for flight 46; for
(c) RDS_DC8_20170928_R1.ict plus 5 d SD use analyzing the reactivities from the ATom
(d) RDS_DC8_ 20180424_R1.ict (b) ATom-2: 33 424 records × 16 csv columns 10 s data.
(e) ATom_RDS.nc (c) ATom-3: 40 176 records × 16 csv columns
Derived here. (d) ATom-4: 40 511 records × 16 csv columns
(e) ATom RDS∗ -2: all data in netcdf
shape of the cumulative PDs but are informative regarding (Fig. 1, Tables 2 and S8) continue to steepen from the 90th
the minimum structural uncertainty in estimating the 24 h re- to 97th percentile, the slope does not change that much. Thus
activity of a well-measured air parcel. we can estimate the 99th + percentile contributes < 5 % of
the total reactivity. Thus, if our model misses the top 1 % of
4.2 Spatial heterogeneity of tropospheric chemistry reactive air parcels (e.g., due to the inability to simulate in-
tensely reactive thin pollution layers), then we miss at most
A critical unknown for tropospheric chemistry modeling is 5 % of the total reactivity. This finding is new and encour-
what resolution is needed to correctly calculate the bud- aging, and it needs to be verified with the ATom-2, 3 and 4
gets of key gases. A similar question was addressed in Yu data.
et al. (2016) for the isoprene oxidation pathways using a The spatial structures and variability of reactivity as sam-
model with variable resolution (500, 250 and 30 km) com- pled by the ATom tropic transects (central Pacific, eastern
pared to aircraft measurements; see also ship plume chem- Pacific and Atlantic) are presented as nine panels in Fig. 2.
istry in Charlton-Perez et al. (2009). ATom’s 10 s air parcels Here, the UCI RDS∗ -2 reactivities are averaged and plot-
measure 2 km (horizontal) by 80 m (vertical) during most ted in 1◦ latitude by 200 m thick cells, comparable to some
profiles. There are obviously some chemical structures below global models (e.g., GMI, NCAR, UCI). We separate the
the 10 s air parcels we use here. Only some ATom measure- eastern Pacific (121◦ W, research flight (RF) 1) from the cen-
ments are archived at 1 Hz, and we examine a test case using tral Pacific (RFs 3, 4 and 5) because we are looking for con-
1 s data for O3 and H2 O for a mid-ocean descent between tiguous latitude-by-pressure structures.
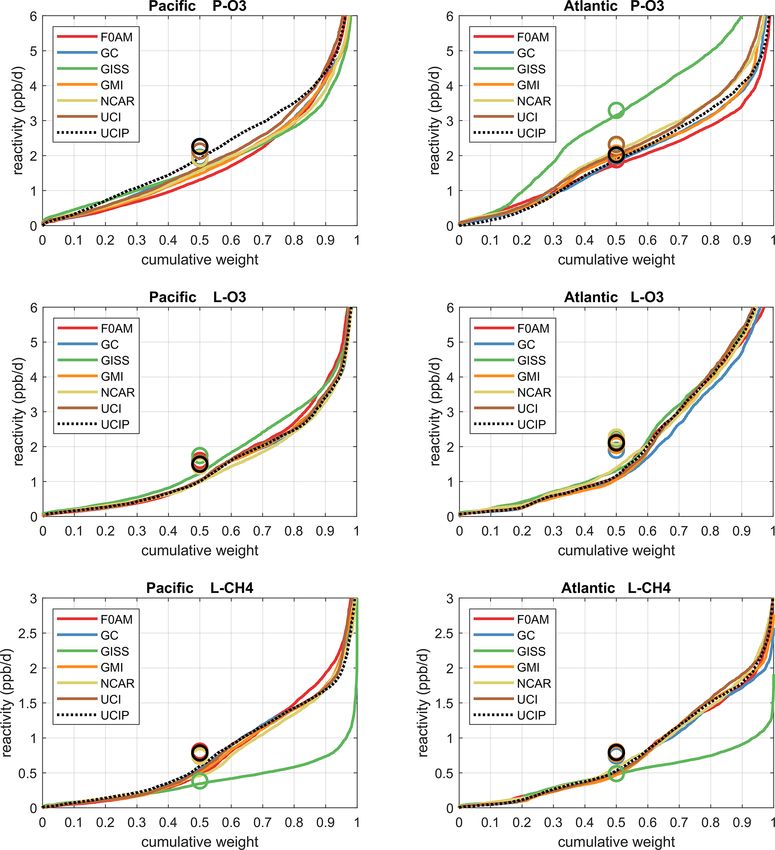
Anchorage and Kona in Fig. S2a in the Supplement. Some In the central Pacific (row 1), highly reactive (hot) P-O3
of the 1 s (200 m by 8 m) variability is clearly lost with 10 s parcels (> 6 ppb/d) occur in larger, connected air masses at
averaging, but 10 s averaging preserves most of the variabil- latitudes 20–22◦ N and pressure altitudes 2–3 km and in more
ity. Lines in Fig. S2 demark 400 m in altitude, and most of scattered parcels (> 3 ppb/d) below 5 km down to 20◦ S.
the variability appears to occur on this larger, model-resolved High L-O3 and L-CH4 coincide with this 20–22◦ N air mass
scale. Figure S2b shows the 10 s reactivities during that de- and also with some high P-O3 at lower latitudes. This pattern
scent and also indicates that much of the variability occurs at of overlapping extremes in all three Rs is surprising because
400 m scales. A more quantitative example using all the trop- the models’ mid-Pacific climatologies show a separation be-
ical ATom reactivities is shown in comparisons with proba- tween regions of high L-O3 (lower-middle troposphere) and
bility densities below (Fig. 5). high P-O3 (upper troposphere, as seen in P2017’s Fig. 3).
How important is it for the models to represent the ex- The obvious explanation is that the models leave most of the
tremes of reactivity? While the sorted reactivity curves lightning-produced NOx in the upper troposphere. The ATom
Atmos. Chem. Phys., 21, 13729–13746, 2021 https://doi.org/10.5194/acp-21-13729-2021H. Guo et al.: Heterogeneity and chemical reactivity of the remote troposphere 13737 Figure 1. Sorted reactivities (P-O3, L-O3, L-CH4, ppb/d) for the Pacific and Atlantic domains of ATom-1. Each parcel is weighted; see text. The six modeled reactivities for MDS-0 using the standard RDS protocol are shown with colored lines, and the UCI calculation for MDS-2 using the new RDS∗ protocol (HNO4 and PAN damping, denoted UCIP) is shown as a dashed black line. The mean value for each model is shown with an open circle plotted at the 50th percentile. (Flipped about the axes, this is a cumulative probability density function.) profiling seems to catch reactive regions in adjacent profiles dence of convective sources of HOx and NOx but too cold separate by a few hundred kilometers, scales easily resolv- and dry for the L-O3 and L-CH4 reactions. ATom-1 RF1 able with 3D models. (29 July 2016) occurred during the North American Mon- In the eastern Pacific (row 2), the overlap of outbound and soon when there was easterly flow off Mexico; thus the high return profiles enhances the spatial sampling over the 10 h reactivity of this large air mass indicates that continental deep flight. The region of very large L-O3 (> 5 ppb/d) is exten- convection is a source of high reactivity for both O3 and CH4 . sive, beginning at 5–6 km at 10◦ N and broadening to 2–8 km In the Atlantic (row 3), we also see similar air masses at 28◦ N. The region of L-CH4 is similar, but loss at the upper through successive profiles, particularly in the northern trop- altitudes of this air mass is attenuated because of the tempera- ics. The Atlantic P-O3 shows high-altitude reactivity simi- ture dependence of L-CH4 and possibly because of differing lar to the eastern Pacific. Likewise, the large values of L-O3 OH : HO2 ratios with altitude. Large P-O3 (> 6 ppb/d) oc- and L-CH4 match the eastern Pacific and not central Pacific. curs in some but not all of these highly reactive L-O3 regions, Unlike either Pacific transect, the Atlantic L-O3 and L-CH4 suggesting that NOx is not as evenly distributed as HOx is. show some high reactivity below 1 km altitude. Overall, the P-O3 also show regions of high reactivity above 8 km that ATom-1 profiling clearly identifies extended air masses of are not in the high L-O3 and L-CH4 regions, probably evi- high L-O3 and L-CH4 extending over 2–5 km in altitude and https://doi.org/10.5194/acp-21-13729-2021 Atmos. Chem. Phys., 21, 13729–13746, 2021
13738                                          H. Guo et al.: Heterogeneity and chemical reactivity of the remote troposphere

Figure 2. Curtain plots for P-O3 (0–6 ppb/d), L-O3 (0–6 ppb/d) and L-CH4 (0–3 ppb/d) showing the profiling of ATom-1 flights in the central
Pacific (RF 3, 4 and 5), eastern Pacific (RF 1) and Atlantic (RF 7, 8 and 9). Reactivities are calculated with the UCI model using MDS-2 and
the new RDS∗ protocol (UCI RDS∗ -2). The 10 s air parcels are averaged into 1◦ latitude and 200 m altitude bins.

10◦ of latitude. The high P-O3 regions tend to be much more             cific at 8–12 km, the ATom-1 results tend to agree with mod-
heterogeneous with greatly reduced spatial extent, likely of            els, showing ozone production of about 1 ppb/d. Below 8 km,
recent convective origin as for the eastern Pacific.                    ATom’s P-O3 increases to a peak of 4 ppb/d at 2 km, while
   Overall, the extensive ATom profiling identifies a hetero-           the models’ P-O3 stays constant down to 4 km and then de-
geneous mix of chemical composition in the tropical Atlantic            crease to about 0.5 ppb/d below 2 km. This pattern indicates
and Pacific, with a large range of reactivities. What is impor-         that in the middle of the Pacific, the NOx + HOx combina-
tant for those trying to model tropospheric chemistry is that           tion that produces ozone is suppressed throughout the lower
the spatial scales of variability seen in Fig. 2 are within the         troposphere in all the models. In the eastern Pacific and At-
capability of modern global models.                                     lantic, both models’ and ATom reactivities indicate that P-O3
                                                                        is greatly enhanced above 6 km as compared to the central
4.3     Testing model climatologies                                     Pacific, but below 6 km ATom P-O3 is much larger than that
                                                                        of the models’, by a factor of 2. In the upper troposphere, the
The ATom data set provides a unique opportunity to test                 agreement indicates that both models and ATom find the in-
CTMs and CCMs in a climatological sense. In this sec-                   fluence of deep continental convection bringing reactive NOx
tion, we compare ATom-1 data and the six models’ chemical               + HOx air masses to the nearby oceanic regions but not to the
statistics for mid-August used in P2017. The ATom profiles              central Pacific. The difference below 5 km in all three regions
cannot be easily compared point by point with CCMs, and we              implies a consistent bias across the models in some combi-
use statistical measures of the three reactivities in the three         nation of HOx sources and/or the vertical redistribution of
tropical basins: mean profiles in Fig. 3 and PDs in Fig. 5.             lightning NOx . This difference is unlikely to be a sampling
                                                                        bias in ATom-1, given it occurs in all three regions.
4.3.1    Profiles                                                          For L-O3 (middle row), the agreement in the central Pa-
                                                                        cific is very good throughout the 0–12 km range; i.e., ATom
For P-O3 profiles (top row, Fig. 3), the discrepancy between            looks just like one of the models (except GISS). Moving
models and measurements is stark. The models (less GISS)                to the eastern Pacific and Atlantic, both models and ATom
present a consistent picture of one world, while the ATom               show increased reactivity, consistent with continental con-
profiles describe an entirely different world. In the central Pa-       vective outflow. The large ATom reactivity in the eastern Pa-

Atmos. Chem. Phys., 21, 13729–13746, 2021                                                 https://doi.org/10.5194/acp-21-13729-2021
H. Guo et al.: Heterogeneity and chemical reactivity of the remote troposphere 13739
Figure 3. Mean profiles of reactivity (rows: P-O3, L-O3, L-CH4 in ppb/d) in three domains (columns: C. Pacific, 30◦ S–30◦ N by 180–210◦ E;
E. Pacific, 0–30◦ N by 230–250◦ E; Atlantic, 30◦ S–30◦ N by 326–343◦ E). Air parcels are cosine(latitude)-weighted. ATom-1 (gray) results
are from Fig. 2, while model results are taken from the August climatologies in Prather et al. (2017).
cific (3–8 km) is clear in Fig. 2 and likely due to easterly mid- while L-CH4 is limited to OH loss. Overall, there is clear ev-
tropospheric flow from convection over Mexico at that spe- idence that the Atlantic and Pacific have very different chem-
cific time (29 July 2016). Similarly, the ATom reactivity at a ical mixtures controlling the reactivities and that convection
low level (1–3 km) in the Atlantic is associated with biomass over land (monsoon or biomass burning) creates air masses
burning in Africa and was measured in other trace species. that are still highly reactive a day or so later.
Thus, in terms of L-O3, the ATom–model differences may
be due to specific meteorological conditions, and this could 4.3.2 Key species
be tested with CTMs using 2016 meteorology and wildfires.
For L-CH4 (bottom row), the ATom–model pattern is sim- The deficit in modeled P-O3 points to a NOx deficiency in
ilar to L-O3, but higher ATom reactivity occurs at lower alti- the models, and this becomes obvious in the comparison of
tudes. Overall, the ATom L-CH4 is slightly greater than the the PD histograms for NOx shown in Fig. 4. In the central
modeled L-CH4. L-O3 is dominated by O(1D) and HO2 loss, Pacific over 0–12 km (first row), ATom has a reduced fre-
quency of parcels with 2–20 ppt and corresponding increase
https://doi.org/10.5194/acp-21-13729-2021 Atmos. Chem. Phys., 21, 13729–13746, 202113740 H. Guo et al.: Heterogeneity and chemical reactivity of the remote troposphere
in parcels with 20–80 ppt. This discrepancy is amplified in mass and cosine(latitude) and limited to pressures greater
the lower troposphere, 0–4 km (second row). In the middle of than 200 HPa. The ATom PDs (black lines connecting black
the Pacific, our chemistry models are missing a large source open circles) are calculated from the 10 s data weighted by
of lower tropospheric NOx . The obvious source of oceanic (but not averaged over) the number of points in each 10◦ lat-
NOx is lightning since oceanic sources of organonitrates or itude by 200 hPa pressure bin and then also by cosine (lat-
other nitrate species measured on ATom could not supply itude) to compare with the models. In addition, a PD was
this amount. The ATom statistics indicate a lightning source calculated from the 1◦ by 200 m average grid-cell values in
must be vertically mixed. In the eastern Pacific, the ATom Fig. 2 (black Xs), and this is also cosine(latitude)-weighted.
0–4 km troposphere appears again to have large amounts of To check if the high reactivities in the eastern Pacific af-
air with 20–50 ppt, while the full troposphere more closely fected the whole Pacific PD, a separate PD using only central
matches the models, except for the large occurrence of air Pacific 10 s data was calculated (gray lines connecting gray
with 100–300 ppt NOx . These high-NOx upper troposphere open circles). The mean reactivities (ppb/d) from the models
regions are probably direct outflow from very deep convec- and ATom are given in the legend; note that these values dis-
tion with lightning in the monsoon regions over Mexico at agree with some table data that are not cosine-weighted. The
this time. In the Atlantic, the models’ NOx shows too fre- PD binning is shown by the open circles, and occurrences of
quent occurrence of low NOx (< 10 ppt) and thus underes- off-scale reactivities are included in the last point.
timates the 10–100 ppt levels at all altitudes. ATom has a The obvious discrepancy is with P-O3 in both Pacific and
strong peak occurrence about 80–120 ppt in the upper tro- Atlantic basins. ATom data have very low occurrence of P-
posphere, and, like the eastern Pacific, this is probably due O3 < 1 ppb/d and a broad, almost uniform frequency (∼ 0.1)
to lightning NOx from deep convection over land (Africa or extending out to 4 ppb/d. This result is consistent with the
South America). Overall, the models appear to be missing mean profile errors (Fig. 3). The match for L-CH4 is very
significant NOx sources throughout the tropics, especially good in both basins, although the models have a greater oc-
below 4 km. currence in the middle 0.5–1.5 ppb/d range and reduced oc-
In Fig. 4, we also look at the histograms for the key HOx - currence in the higher 1.5–2.5 ppb/d range. For L-O3, the
related species HOOH (third row) and HCHO (fourth row). match is very good and similar to L-CH4, although the At-
For these species, the ATom–model agreement is generally lantic has a high frequency of L-O3 > 6 ppb/d that is not seen
good. If anything, the models tend to have too much HOOH. in the models (except GISS). The extreme eastern Pacific re-
ATom shows systematically large occurrences of low HOOH activities are seen in the mean values displayed in the legend
(50–200 ppt, especially central Pacific), indicating, perhaps, (e.g., CPac with 1.29 ppb/d L-O3 versus ATom (i.e., CPac
that convective or cloud scavenging of HOOH is more effec- + EPac) with 1.54 ppb/d), but the PDs (gray circles versus
tive than is modeled. HCHO shows reasonable agreement in black circles) resemble each other more closely than any of
the Atlantic, but in both central and eastern Pacific, the mod- the models.
eled low end (< 40 ppt) is simply not seen in the ATom data. The ability to test a model’s reactivity statistics with the
Also, the models are missing a strong HCHO peak at 300 ppt ATom 10 s data is not obvious, but the PDs based on 1◦
in the eastern Pacific, probably convection-related. Thus, in latitude by 200 m altitude cells (the black Xs) is remark-
terms of these HOx precursors, the model climatologies ap- ably close to the PDs based on 2 km (horizontal) by 80 m
pear to be at least as reactive as the ATom data. (vertical) 10 s parcels. With the coarser resolution, we see
While the ATom-1 data in Fig. 4 are limited to single tran- a slight shift of points from the ends of the PD to the
sects, the model NOx discrepancies apply across the three middle as expected, but we find once again, that the loss
tropical regions, and the simple chemical statistics for these in high-frequency, below-model grid-cell resolution is not
flights alone are probably enough to identify measurement- great. Both ATom-derived PDs more closely resemble each
model discrepancies. For the HOx -related species, the mod- other than any model PD. Thus, current global chemistry
els match the first-order statistics from ATom. In terms of models with resolutions of about 100 km by 400 m should be
using ATom statistics as a model metric, it is encouraging able to capture much of the wide range of chemical hetero-
that where individual models tend to deviate from their peers, geneity in the atmosphere, which for the oceanic transects
they also deviate from the ATom-1 PDs. is, we believe, adequately resolved by the 10 s ATom mea-
surements. Perhaps more surprising, given the different mean
4.3.3 Probability densities profiles in Fig. 3, is that the five model PDs in Fig. 5 look
very much alike. This points to some significant underlying
Mean profiles do not reflect the heterogeneity seen in Fig. 2, difference between our current global chemistry models and
and so we also examine the PDs of the tropical reactivities the ATom observations.
(Fig. 5). The model PDs (colored lines connecting open cir-
cles at the center of each bin) are calculated from the 1 d
statistics for mid-August (P2017) using the model blocks
shown in Fig. S1. The model grid cells are weighted by air
Atmos. Chem. Phys., 21, 13729–13746, 2021 https://doi.org/10.5194/acp-21-13729-2021H. Guo et al.: Heterogeneity and chemical reactivity of the remote troposphere 13741
Figure 4. Histograms of probability densities (PDs) of NOx (0–12 km, row 1), NOx (0–4 km, row 2), HOOH (0–12 km, row 3) and HCHO
(0–12 km, row 4) for the three tropical regions (central Pacific, eastern Pacific, Atlantic). The ATom-1 data are plotted on top of the six global
chemistry models’ results for a day in mid-August and sampled as described in Fig. 3.
5 Discussion and path forward climatologies, we find a clear model error – missing O3 pro-
duction over the tropical oceans’ lower troposphere – and
5.1 Major findings traced it to the lack of NOx below 4 km. The occurrence of
the same error over the central and eastern Pacific as well as
the Atlantic Ocean makes this a robust model–measurement
This paper opens a door for what the community can do with
discrepancy.
the ATom measurements and the derived products. ATom’s
Building our chemical statistics (PDs) from the ATom 10 s
mix of key species allows us to calculate the reactivity of
air parcels on a scale of 2 km by 80 m, we can identify the
the air parcels and hopefully may become standard for tro-
fundamental scales of spatial heterogeneity in tropospheric
pospheric chemistry campaigns. We find that the reactivity
chemistry. Although heterogeneity occurs at the finest scales
of the troposphere with respect to O3 and CH4 is dominated
(such as seen in some 1 s observations), the majority of vari-
by a fraction of the air parcels but not by so small and infre-
ability in terms of the O3 and CH4 budgets occurs across
quent a fraction as to challenge the ability of current CTMs
scales larger than neighboring 2 km parcels. The PDs mea-
to simulate these observations and thus be used to study the
sured in ATom can be largely captured by global models’
oxidation budgets. In comparing ATom results with modeled
https://doi.org/10.5194/acp-21-13729-2021 Atmos. Chem. Phys., 21, 13729–13746, 2021You can also read