Responses of Maize Internode to Water Deficit Are Different at the Biochemical and Histological Levels
←
→
Page content transcription
If your browser does not render page correctly, please read the page content below
ORIGINAL RESEARCH
                                                                                                                                           published: 26 February 2021
                                                                                                                                         doi: 10.3389/fpls.2021.628960

                                             Responses of Maize Internode to
                                             Water Deficit Are Different at the
                                             Biochemical and Histological Levels
                                             Fadi El Hage 1,2† , Laetitia Virlouvet 1 , Paul-Louis Lopez-Marnet 1,3 , Yves Griveau 1 ,
                                             Marie-Pierre Jacquemot 1 , Sylvie Coursol 1 , Valérie Méchin 1 and Matthieu Reymond 1*
                                             1
                                              Institut Jean-Pierre Bourgin, INRAE, AgroParisTech, Université Paris-Saclay, Versailles, France, 2 Ecole Doctorale n◦ 567:
                                             Science du Végétal: Du gène à l’écosystème, Université Paris-Saclay, Orsay, France, 3 Ecole Doctorale n◦ 581: ABIES, Paris,
                                             France

                                             Maize feeding value is strongly linked to plant digestibility. Cell wall composition and
                                             structure can partly explain cell wall digestibility variations, and we recently showed that
                                             tissue lignification and lignin spatial distribution also contribute to cell wall digestibility
                          Edited by:
                                             variations. Although the genetic determinism of digestibility and cell wall composition
              Raul Antonio Sperotto,         has been studied for more than 20 years, little is available concerning that of tissue
    Universidade do Vale do Taquari -
                                             lignification. Moreover, maize yield is negatively impacted by water deficit, and we newly
                     Univates, Brazil
                                             highlighted the impact of water deficit on cell wall digestibility and composition together
                        Reviewed by:
                     Rogelio Santiago,       with tissue lignification. Consequently, the aim of this study was to explore the genetic
             University of Vigo, Spain       mechanisms of lignin distribution in link with cell wall composition and digestibility
                               Fa Cui,
       University of Chinese Academy
                                             under contrasted water regimes. Maize internodes from a recombinant inbred line (RIL)
                    of Sciences, China       population grown in field trials with contrasting irrigation scenarios were biochemically
                 *Correspondence:            and histologically quantified. Results obtained showed that biochemical and histological
                  Matthieu Reymond
                                             traits have different response thresholds to water deficit. Histological profiles were
           matthieu.reymond@inrae.fr
                  † Present
                                             therefore only modified under pronounced water deficit, while most of the biochemical
                              address:
                          Fadi El Hage,      traits responded whatever the strength of the water deficit. Three main clusters of
   Arvalis Institut du Végétal – Station     quantitative trait locus (QTL) for histological traits were detected. Interestingly, overlap
         Expérimentale HTPT – Route
  de Malesherbes, Boigneville, France
                                             between the biochemical and histological clusters is rare, and one noted especially
                                             colocalizations between histological QTL/clusters and QTL for p-coumaric acid content.
                   Specialty section:        These findings reinforce the suspected role of tissue p-coumaroylation for both the
         This article was submitted to
        Crop and Product Physiology,
                                             agronomic properties of plants as well as their digestibility.
               a section of the journal
                                             Keywords: maize internode, histological profile, cell wall biochemical composition, water deficit, quantitative trait
            Frontiers in Plant Science
                                             locus
       Received: 13 November 2020
        Accepted: 22 January 2021
       Published: 26 February 2021          INTRODUCTION
                              Citation:
                 El Hage F, Virlouvet L,    Maize is nowadays a staple food in the world (Shiferaw et al., 2011). It not only provides
        Lopez-Marnet P-L, Griveau Y,        carbohydrates, proteins, lipids, and vitamins for billions of people but also serves as an important
Jacquemot M-P, Coursol S, Méchin V          energy resource for animal feed and biorefinery processes (Virlouvet et al., 2019). Its energy value
  and Reymond M (2021) Responses
                                            is first related to its cell wall digestibility.
   of Maize Internode to Water Deficit
      Are Different at the Biochemical
                                                Maize stem represents up to 46% of the plant dry weight (Hansey et al., 2010) and is made
               and Histological Levels.     of distinct tissues, distributed in the rind and the pith sections, which do not have the same
         Front. Plant Sci. 12:628960.       levels of lignification, p-coumaroylation, and feruloylation (Lopez et al., 1993; Chesson et al.,
      doi: 10.3389/fpls.2021.628960         1997; El Hage et al., 2018; Santiago et al., 2018) nor the same efficiency of enzymatic digestibility

Frontiers in Plant Science | www.frontiersin.org                                    1                                       February 2021 | Volume 12 | Article 628960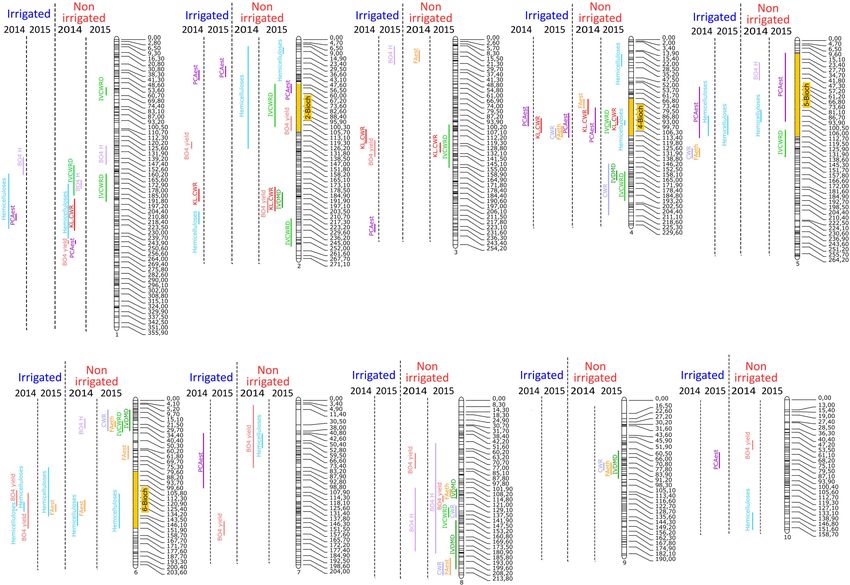
El Hage et al.                                                                                             Impact of Water Regime in Maize Internode

(Lopez et al., 1993; Jung and Casler, 2006; El Hage et al., 2018).        stem and its plasticity in response to water deficit. A recombinant
Therefore, spatial consideration of the maize stem will provide           inbred line (RIL) population derived from the cross between F271
valuable knowledge to improve its utilization.                            and Cm484 lines (Virlouvet et al., 2019) was evaluated during
    Recently, a non-lethal and cost-effective method has been             2 years in the field under two contrasted irrigation scenarios.
proposed by puncture test (Seegmiller et al., 2020) to quantify           At final harvest, plant height, stem dry weight, biochemical
rind thickness and stalk diameter on poison hemlock (Conium               composition, and tissue histology of the internode under the
maculatum). Nevertheless, standardization of this method (for             main ear were measured using high-throughput dedicated tools.
instance, puncturing probe geometry) is required to carry out             A number of significant QTL for biochemical and histological
meta-analysis of the results obtained by several groups (Cook             traits were detected. Several colocalizations between histological
et al., 2020). Other methods to quantify stem anatomy rely on the         QTL and QTL for PCAest were identified, supporting the
characterization of internode cross sections. An image processing         major role of tissue p-coumaroylation for both the agronomic
software has been proposed to quantify rind thickness; pith               properties of plants as well as their digestibility.
area; vascular bundle number; and size in pith section of maize,
sorghum, and other grass species (Heckwolf et al., 2015). Images
are acquired on hand-cut cross section with a flatbed document            MATERIALS AND METHODS
scanner. The anatomical quantification rate required for genetic
and physiological studies is therefore achieved. However, this            Plant Materials and Field Experiments
method does not allow to demarcate the pith of the rind (Casto            A RIL population consisting of 267 lines was developed at
et al., 2018). In contrast, FASGA (abbreviation of Spanish names          INRAE by single seed descent (SSD) for six generations from a
of fucsina, alcian blue, safranina, glicerina, and aqua) staining         cross between maize inbred lines F271 and Cm484 as described
of internode cross sections (Tolivia and Tolivia, 1987) is a              (Virlouvet et al., 2019). All the RILs were planted in a randomized
powerful approach that allows to distinguish highly lignified             augmented block design in open field trials at Mauguio (France).
tissues and poorly lignified tissues. It was recently applied in          Four replicates were carried out over 2 years (2014 and 2015)
sorghum (Perrier et al., 2017) and maize (El Hage et al., 2018;           under irrigated (I) and non-irrigated (NI) conditions as described
Vo et al., 2020) cross sections. Moreover, the advent of several          (Virlouvet et al., 2019). Briefly, under the I scenario, the water was
plugins (Zhang et al., 2013; Legland et al., 2017) is allowing            supplied with a mobile ramp of sprinklers twice a week (30 mm
quantification of anatomical features from FASGA-stained cross            of water supplied every time). Under the NI scenario, water was
sections, increasing the throughput of data analysis.                     no more supplied when plants reached the five-leaf collar stage
    Variation of stem anatomical structure between genotypes              until 14 days after all the RILs flowered. Parental lines were
has been revealed either by scoring visually the structure or             replicated in each block of the design in 2014.I, 2014.NI, 2015.I,
by using the different quantification methods as described. For           and 2015.NI. In 2014.I and 2014.NI, 201 plots were divided into
example, using a visual score, Casto et al. (2018) identified             eight blocks. In each block, parental lines F271 and Cm484 were
in different sorghum bi-parental populations a quantitative               cultivated in one plot each. RILs were cultivated on the other
trait locus (QTL) on chromosome 6 that accounted for a                    plots. At silage stage, among the 201 plots cultivated in 2014.I,
large part of the variation in the amount of aerenchyma in                stovers were harvested from 170 plots and internodes from 175
these populations. Huang et al. (2016) similarly identified 16            plots, due to heterogeneity of plants within a plot or due to
QTL in a maize-teosinte population that accounted for 52%                 low number of plants present in some plots. In 2014.NI, stovers
of the variation in the number of vascular bundle in the                  were harvested from 170 plots and internodes from 174 plots.
uppermost internode of that population. Using the protocol                In 2015.I and NI, 189 plots were divided into eight blocks. In
developed by Heckwolf et al. (2015); Mazaheri et al. (2019)               each block, parental lines F271 and Cm484 were cultivated in
also identified several candidate genes associated with maize             one plot each. At silage stage, stovers were harvested on 180
stalk diameter, rind thickness, and vascular bundle density.              plots and internodes on 183 plots in 2015.I and stovers and
However, to the best of our knowledge, no studies compare                 internodes on 147 plots in 2015.NI. In each plot, 36 seeds from
the position of QTL underlying biochemical trait variations to            the same inbred line were sown and only the first internode
that of QTL underlying the variation of spatial distribution of           below the main ear was harvested among the grown plants at
lignified tissues.                                                        silage stage. On one side, 10 internodes below the main ear
    In addition, severe episodes of drought are projected to              of 10 plants were harvested and pooled, dried (in a forced-
become more frequent in the near future because of climate                air oven at 55◦ C during 72 h), and grinded (with a hammer
change (Harrison et al., 2014). We recently highlighted the               mill—1-mm grid) for NIRS acquisition. On the other side, two
impact of water deficit on cell wall digestibility and composition        internodes below the main ear were harvested from two others
together with tissue lignification (El Hage et al., 2018; Virlouvet       plants and stored in 70% ethanol for histological quantifications.
et al., 2019). Consequently, there is a need to elucidate the             Hence, only internodes below the main ear were harvested for
genetic determinism of lignin distribution in link with cell wall         biochemical and histological quantification, avoiding differences
composition and digestibility for optimizing maize energetic              due to different tissue sampling between biochemical predictions
value under water-limited conditions. To this end, the present            and histological quantifications. Each line was grown in a single
study aimed at evaluating the biochemical and histological traits         4.20-m row with 0.80 m between rows and a planting density of
underlying the variation of cell wall digestibility in the maize          80,000 plants ha−1 .

Frontiers in Plant Science | www.frontiersin.org                      2                                   February 2021 | Volume 12 | Article 628960
El Hage et al. Impact of Water Regime in Maize Internode
Biochemical Analyses and Establishment - Bundle_number, which is the number of bundles in the
of NIRS Predictive Equations pith of the cross-section;
- Lignified_fraction, which is the percentage of the cross-
First, the NIRS predictive equations for the internode previously
section area occupied by parenchyma stained by the
described (El Hage et al., 2018) were enriched with the results
safranin;
from wet biochemistry analyses of 56 samples from the RIL
- Non-lignified_fraction, which is the percentage of the
population collected in Mauguio in 2014 and 2015. The 56
cross-section area occupied by parenchyma stained by the
samples were selected to cover the range of spectral variation
alcian blue;
obtained on all the samples collected in 2014 and 2015 in
- Rind_fraction, which is the percentage of the cross-section
irrigated and non-irrigated conditions. To do so, we performed
area occupied by the rind;
a principal component analysis (PCA) carried out on NIRS
spectrum acquired on all the harvested internode samples, and
we selected 56 samples that were evenly distributed on the PCA From all these traits quantified by the plugin, we calculated
axes. Biochemical quantifications performed on the calibration composite variables to synthetize the following information:
samples set were the following (Supplementary Table S1): (1)
cell wall content (CWR) was obtained with a water/ethanol - Blue_parenchyma, which refers to the amount of blue
extraction (Soxhlet); (2) lignin content in the cell wall (KL.CWR) intensity in the blue parenchyma;
was estimated using the Klason method (Dence, 1992); (3) the - Red_parenchyma, which refers to the amount of red
monomeric structure and composition of lignin (units bO4.S, intensity in the red parenchyma;
bO4.G, and bO4.H) were obtained by thioacydolysis (Lapierre - Red_rind, which refers to the amount of red
et al., 1986); (4) PCAest, FAest, and FAeth were obtained by intensity in the rind.
alkaline hydrolysis (Morrison et al., 1994; Culhaoglu et al.,
2011); (5) glucose, xylose, and arabinose contents were quantified
Statistical Analyses
by acidic hydrolysis (Updegraff, 1969; Harholt et al., 2006),
All statistical analyses were performed using R software (R Core
and cellulose content was estimated by glucose content, and
Team, 2014). To eliminate the block effect, single-plot values were
hemicellulose content has been obtained by adding xylose and
corrected by a subtraction of the best linear unbiased prediction
arabinose; and (6) acidic pretreatment of DM and CWR followed
(BLUP) value of the block effect for each line, using the following
by an enzymatic hydrolysis (Onozuka cellulase R10) bring the
mixed linear model (1):
in vitro DM degradability (IVDMD) and cell wall degradability
(IVCWRD), respectively, as described (Virlouvet et al., 2019).
Second, 683 DM internode samples were scanned through a near-
infrared reflectance spectrometer (Antaris II, Thermo Fisher Yijkl = µ + gi × (1 − ti ) + Ci × yi + ek + Bjkl + gi + yi + gi
Scientific). The biochemical traits were then estimated using the +ek + yi + ek + Eijkl (1)
updated NIRS predictive equations.
Histological Analyses where Y ijkl is the phenotypic value of the ith recombinant inbred
line in the jth year, in the kth irrigation scenario and located in
Histological analyses have been carried out as described (Legland
the lth block. µ is the intercept. Effect of line i is considered as
et al., 2017). Briefly, a 1-cm-long segment was sampled in the
fixed and noted Ci if it was one of the two parental lines used as
upper part of each internode 1.5 cm under the node. For each
control and as random and noted g i if i was a RIL. The parameter
segment, one cross-section with a thickness of 150 µm was
t i was set to one for control lines or set to zero otherwise. The Bjkl
prepared. A total of 1,367 cross-sections were obtained using
block was considered as random effects, as well as the interaction
a sledge-microtome GSL1 (Gärtner et al., 2014) and stored
between the g i genetic and the yj year or the ek irrigation scenario
in 70% ethanol. Sections were then stained for 24 h using a
effects. The interaction between the ek irrigation scenario and
FASGA solution diluted in distilled water (1:8, v/v) and finally
the yj year effects was considered as fixed effect. By using the
rinsed for 24 h with distilled water while stirring continuously.
parental replicates in each block, the parameter t i was used to
After two other successive washings during 5 min in MQ
distinguish the RILs from the parental lines. On the corrected
water, all the cross-sections were mounted in distilled water on
data set, another analysis of variance (ANOVA) was performed
slides and an image of each cross-section was acquired using
with the following linear model for each trait:
a slide scanner piloted by the Metafer Scanning and Imaging
Y ij = µ + Ai + T j + Ai × T j + Rij
Platform (MetaSystems GmbH, Altlussheim, Germany). Finally,
where Y ij is the value of the year i under the condition j;
each image was numerically analyzed on the ImageJ software to
µ = overall mean; Ai = the main effect of the year i; T j = the
segment and quantify histological traits (Legland et al., 2017). The
main effect of the condition j; Ai × T j = the interaction effect
following nine histological traits were quantified:
between the year i and the condition j; and Rij = the random
- Stem_area, which is the area in square centimeter of the residual term. For each trait, heritabilities have been calculated
cross-section; over the years 2014 and 2015 either in I scenario or in NI
- Bundle_fraction, which is the percentage of the cross- scenario as the proportion of phenotypic variance explained by
section area occupied by the bundles; genotypic variance.
Frontiers in Plant Science | www.frontiersin.org 3 February 2021 | Volume 12 | Article 628960El Hage et al. Impact of Water Regime in Maize Internode
Principal Component Analysis scenario) than in Cm484 (reduction of 44.2 and 7.8% of biomass
Principal component analysis (PCA) was carried out with the yield in 2014 and 2015, respectively, in the NI vs. I scenario;
complete data set through all the years and treatments using reduction of 25.9 and −0.6% of plant height in 2014 and 2015,
FactoMineR, factoextra, ggplot2, and ggthemes. respectively, in the NI vs. I scenario).
Quantification of cell wall biochemical traits in the internodes
QTL Detection showed that IVDMD and IVCWRD were lower in F271
Genetic map of the population has been described previously than in Cm484 whatever the year and the irrigation scenario
(Virlouvet et al., 2019). Briefly, genomic DNA from 261 RIL was (Supplementary Table S2). F271 internode contained also more
used for genotyping using the genotyping-by-sequencing (GBS) lignin in the cell wall (KL.CWR) than Cm484 whatever the year
approach (Elshire et al., 2011). Initially, 955,720 markers were and the irrigation scenario (Supplementary Table S2). However,
identified well-distributed on maize chromosomes 1–10. Among for both years, the lignin content was more lowered in F271 than
those, we selected 2,806 polymorphic markers between parental in Cm484 in response to the irrigation scenario. The same trend
lines with less than 15% missing data among the RILs. These was observed for the PCAest content (Supplementary Table S2).
markers were then used to construct the linkage map using R Reduction of cellulose content in the cell wall was also higher
scripts interacting with the CarthaGene software (de Givry et al., in internodes of F271 than in those of Cm484 in both years
2005), as described in Ganal et al. (2011). In total, 1,000 markers studied. In contrast, hemicellulose content in the cell wall of F271
were retained. The total length of the framework map was internode was similar to that of Cm484 internode and was not
2,355 cM with an average spacing of around 2.4 cM. By looking impacted by the different irrigation scenarios. Lignin structure
a posteriori at singletons in the dataset, we verified that the (βO4 yield) was also similar for both parental lines whatever the
increase of the genetic map length when saturating the scaffold year and the irrigation scenario.
with additional markers was not attributable to genotyping errors Histological analyses showed that the cross section area
but more likely to the rather high level of missing data, which of Cm484 was bigger than that of F271 in 2014 whatever
introduces a bias in the imputation procedure (EM algorithm) the irrigation scenario (Supplementary Table S2). However,
of CarthaGene as a result of genetic interference. QTL detection in 2015, F271 and Cm484 showed similar cross section area
was performed using the multi-QTL mapping (MQM) method whatever the irrigation scenario. Additionally, F271 showed a
in the R/qtl package (Broman and Sen, 2009; Arends et al., 2010). greater rind section area than Cm484 whatever the year and
The function mqmscan was used, setting the maximum cofactor the irrigation (Supplementary Table S2). The lignified fraction
marker number (number of individual minus 12, depending in the pith was also more important for F271 than for Cm484
on the year and the condition), with a further processing by whatever the year and the irrigation scenario, suggesting that
backward elimination. To quantify the explained variance, QTL the irrigation scenario did not impact the lignified fraction in
above a LOD score at 3 (corresponding to approximately the the pith. The main difference between the two parental lines
5% significance threshold using 1,000 permutations over all the was that Cm484 showed mostly twice the amount of non-
quantified traits) were selected. The QTL detection by the MQM lignified fraction in the pith than F271 whatever the year and
method was performed on the data corrected for the block the irrigation scenario (Supplementary Table S2). In line with
effect per year and per irrigation scenario data. QTL confidence this observation, the Blue_parenchyma (i.e., the amount of blue
intervals were calculated as the genetic distance where LOD-1 intensity in the blue parenchyma) was always higher in Cm484
from the QTL peak was reached. than in F271 (Supplementary Table S2). It is also noticeable
than the Blue_parenchyma increased in F271 internode while it
decreased in Cm484 internode in response to the NI scenario in
RESULTS 2015 (Supplementary Table S2). Bundle numbers were similar
between the two parental lines whatever the year and the
Internodes of F271 Are Less Digestible, irrigation scenario (Supplementary Table S2). However, due to
Have More Lignified Tissues in the Rind the decrease of the cross section area in response to the NI
scenario, the bundle density increased in the two parental lines in
and the Pith, and Are More Sensitive to response to the irrigation scenario, with the exception of Cm484
the Irrigation Scenario Than Those of in 2015 (Supplementary Table S2).
Cm484
Agronomic traits were first evaluated for the two parental inbred Different Responses of Biochemical and
lines F271 and Cm484. Under the I condition, plant height
and biomass yield were higher in F271 than in Cm484 in
Histological Traits to the Irrigation
both 2014 and 2015 (Supplementary Table S2). Under the NI Scenario Among the F271 × Cm484
scenario, these two agronomical traits decreased as expected, Progeny
but less strongly in 2015 than 2014 (Supplementary Table S2). The agronomic and cell wall-related traits were then evaluated
Furthermore, their decrease was more pronounced in F271 in the F271 × Cm484 progeny, and PCA analysis was carried
(reduction of 59.5 and 39% of biomass yield in 2014 and 2015, out for investigating these traits over the years under both
respectively, in the NI vs. I scenario; reduction of 32.7 and 9.3% irrigation scenarios (Figure 1). The first axis of the PCA explained
of plant height in 2014 and 2015, respectively, in the NI vs. I 21.5% of the variation present in the data set. The traits that
Frontiers in Plant Science | www.frontiersin.org 4 February 2021 | Volume 12 | Article 628960El Hage et al. Impact of Water Regime in Maize Internode
FIGURE 1 | PCA analysis including histological, biochemical, and agronomical traits quantified. (A) Representation of the contribution of each trait in dimension 1
(21% of the global variance) vs. dimension 2 (16.3% of the global variance). (B) Projection of each recombinant inbred line for each year and each irrigation scenario
in dimension 1 and 2 area of the PCA analysis. Circles represent the area occupied by 70% of the RIL for each year and treatment combination.
contributed the most were IVCWRD and IVDMD on one histological and agronomical traits than the NI scenario in 2015
side and FAeth, KL.CWR, CWR, cellulose, and PCAest on the (Supplementary Table S2).
other side (Figure 1A and Supplementary Table S3). Hence, In accordance to the PCA results, comparing the correlations
this first ACP axis reflects the digestibility and the biochemical between traits within each field trials, the correlations
composition of the internode biomass. Internodes harvested obtained in 2014.NI differed from those obtained in 2015.NI
under the I scenario in both 2014 and 2015 were located on (Supplementary Table S4). For instance, Blue_parenchyma
the right side of this axis, whereas internodes harvested under is more strongly and significantly correlated to Red_rind
the NI scenario in both 2014 and 2015 were located on the and Red_parenchyma in 2014.NI than in the other field
left side of this first PCA axis (Figure 1B). This reflects the trials (r = −0.26∗∗∗ and r = −0.70∗∗∗ , respectively,
fact that the digestibility and the biochemical composition of Supplementary Table S4). Bundle_density is significantly
the internodes were modified by the NI scenario whatever the correlated to Non-_lignified_fraction and to IVCWRD
year. Under the NI scenario in both 2014 and 2015, IVCWRD only in 2014.NI on one side (r = 0.21∗∗ and r = −0.21∗ ,
increased while the lignin and PCAest contents in the cell wall respectively, Supplementary Table S4) and it is also much
decreased. Moreover, among the RIL population, the increase of less correlated to Bundle_number only in 2014.NI (r = 0.20∗ ;
IVCWRD in response to the NI scenario was similar in average Supplementary Table S4). Correlation between lignified
for both years (Supplementary Table S2). The hemicellulose fraction and Rind_fraction is also weaker in 2014.NI
content in the cell wall increased slightly when internodes of than in the others field trials (r = -0.16∗ ; Supplementary
the RILs were cultivated under the NI scenario in both 2014 Table S4). Blue_parenchyma, Non-_lignified_fraction, and
and 2015, paralleled by a slight decrease of the cellulose content Bundle_density are the traits that contributed the most to the
in 2014 and 2015. second axis of the PCA. This reflects the fact that 2014.NI
The second axis of the PCA depicted 15.4% of the observed is located apart from the other field trials on the PCA and
variability among the data set. The traits that contributed that histology of internodes responded more in 2014 to
the most to this axis were the histological (Blue_parenchyma, the NI scenario.
Non-_lignified_fraction, and Bundle_density on one side and Taken together, the results suggest that the NI scenario led
Lignified_fraction, Red_parenchyma, and Stem_area on the to internode modifications at the biochemical level of the same
other side) and agronomical traits (Plant_height and yield) magnitude in 2014 and in 2015. However, changes in internodes
(Figure 1A and Supplementary Table S3). Internodes harvested at the histological levels were more pronounced in the NI
when plant were cultivated under the I scenario in both scenario of 2014 than that of 2015.
2014 and 2015 were located on the same position on this
axis, while it was not the case for the internodes harvested
under the NI scenario. Internodes harvested in 2015 were
QTL Mapping for Histological,
close to those harvested under the I scenario (Figure 1B). Biochemical, and Agronomical Traits
In contrast, internodes harvested under the NI scenario in Under the Different Irrigation Scenarios
2014 were more distant than the others. This reflects the fact Consequently, QTL detection was performed for agronomical,
that the NI scenario in 2014 had a stronger impact on the histological, and biochemical traits for each year and each
Frontiers in Plant Science | www.frontiersin.org 5 February 2021 | Volume 12 | Article 628960El Hage et al. Impact of Water Regime in Maize Internode
irrigation scenario. For all year and scenario combinations and βO4 H (2014.NI). At cluster 6-Bioch (between 82 and
(2014.I, 2014.NI, 2015.I, and 2015.NI), a total of 219 QTL 155 cM on chromosome 6), QTL for hemicelluloses detected
involved in the variations of the quantified agronomical, in every condition colocalized with QTL for FAest (2015.I and
biochemical, and histological traits were mapped (Figures 2,3 2014.NI) and βO4 yield (2014.I). If globally no locus seemed to
and Supplementary Table S5). be associated to the irrigation scenario, it is noteworthy that some
For the biochemical traits, a total of 94 QTL were detected QTL appeared exclusively under the NI scenario. This was the
over the 2 years and the two irrigation scenario tested. case at the top of the chromosome 6 (between 7 and 70 cM)
Several colocalizations occurred at several loci between QTL and on chromosome 8 in which several biochemical QTL were
for digestibility and/or QTL for composition/structure of the detected only in 2014.NI and 2015.NI conditions (Figure 2 and
cell wall (Figure 2 and Supplementary Table S5). Interestingly, Supplementary Table S5).
among the 94 QTL detected, 30 mapped to four clusters. At For the histological traits, a total of 90 QTL were detected
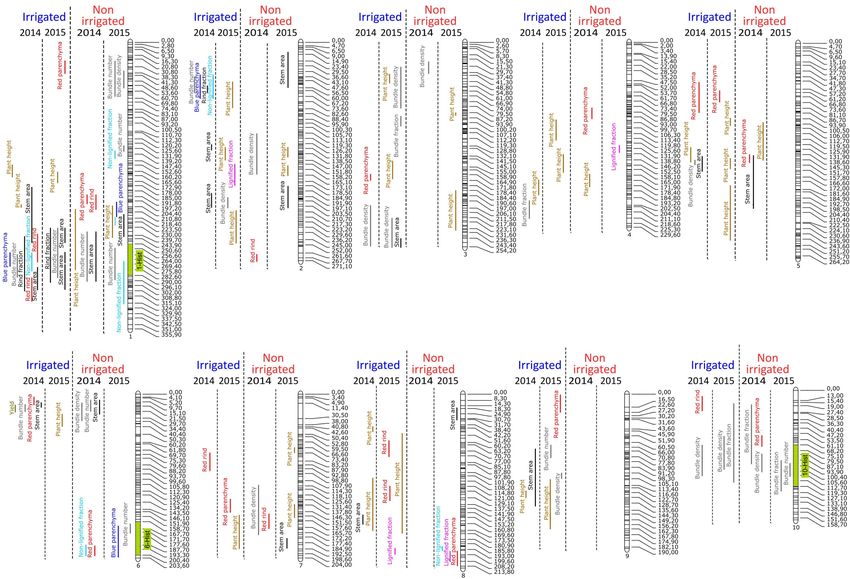
cluster 2-Bioch (between 50 and 105 cM on the chromosome (Figure 3 and Supplementary Table S5). The percentage of
2), one QTL for IVCWRD (2015.NI) colocalized with QTL variation explained by each histological QTL was rather low and
for PCAest (2015.NI), hemicelluloses (2014.NI), and βO4 yield only six QTL explained more than 10% of the observed variation
(2015.NI). At cluster 4-Bioch (between 73 and 117 cM on of the histological trait. Interestingly, among the 90 histological
chromosome 4), a QTL for IVCWRD (2015.NI) colocalized QTL identified, 25 mapped to three clusters (Figure 3). The
with QTL for CWR (2015.I), KL.CWR (2015.I, 2014.NI and 1-Hist cluster on chromosome 1 (between 250 and 290 cM)
2015.NI), PCAest (2014.I, 2015.I and 2014.NI), FAest (2015.I), included 14 histological QTL detected whatever the year and
hemicelluloses (2015.NI), and FAest (2014.NI). At cluster 5- the irrigation scenario. The 10-Hist cluster on chromosome
Bioch (between 10 and 114 cM on chromosome 5), QTL for 10 (between 80 and 105 cM) included seven QTL involved
hemicelluloses (2014.I, 2015.I and 2014.NI) colocalized with only in the variation of bundle-related traits (Bundle_number,
QTL for PCAest (2014.I and 2015.NI), IVCWRD (2015.NI), Bundle_density, and Bundle_fraction) whatever the year and
FIGURE 2 | Mapping of QTL involved in the variations of biochemical traits on the 10 chromosomes of maize genome for the four conditions: 2014 irrigated, 2015
irrigated, 2014 non-irrigated, and 2015 non-irrigated.
Frontiers in Plant Science | www.frontiersin.org 6 February 2021 | Volume 12 | Article 628960El Hage et al. Impact of Water Regime in Maize Internode
FIGURE 3 | Mapping of QTL involved in the variations of histological and agronomical traits on the 10 chromosomes of maize for the four conditions: 2014 irrigated,
2015 irrigated, 2014 non-irrigated, and 2015 non-irrigated.
the irrigation scenario. The 6-Hist cluster on the bottom of Red_rind detected under the same condition. Finally, on the
chromosome 6 (between 158 and 200 cM) included only chromosome 10, QTL for PCAest (2015.I) colocalized with the
four QTL for histological traits under the NI scenario in 10-Hist cluster.
both 2014 and 2015. It did not overlap with the 6-Bioch
cluster. Additionally, four QTL involved only in histological
traits in the I scenario in both 2014 and 2015 were mapped DISCUSSION
on chromosome 9.
Finally, several colocalizations were observed between Combining NIRS Predictions and
histological and biochemical traits. The 1-Hist cluster included
two biochemical QTL (one QTL for PCAest and one QTL
Histological Profiling of Maize Internode
for βO4 yield) detected in 2014 in the NI scenario and one to Decipher Biochemical and
QTL for Plant_height detected as well in 2014 in the NI Histological Variations
scenario. It is worth noting that QTL for PCAest content Cm484 was previously reported to have a blue FASGA-stained
often colocalized with QTL involved in the variation of parenchyma in the pith while F271 presented a much more
histological traits (Figure 3). Thus, at the top of chromosome reddish FASGA-stained parenchyma (Méchin et al., 2000; Méchin
2, three QTL for PCAest (2014.I, 2014.NI, and 2015.NI) et al., 2005; Barrière et al., 2009). Based on these findings,
colocalized with three histological QTL (Rind_fraction, a RIL population was developed from a cross between these
Blue_parenchyma, and Bundle_number) detected in 2014 two inbred lines. El Hage et al. (2018) recently characterized
under the I scenario. Similarly, at the bottom of chromosome a set of maize inbred lines, including F271 and Cm484, and
3, QTL for PCAest colocalized with QTL for Bundle_density confirmed their biochemical differences. Surprisingly, Cm484
detected in 2014 in the I scenario. On the chromosome 5, QTL did not show a so intense blue FASGA-stained parenchyma
for PCAest (2014.I and 2015.NI) also colocalized with QTL anymore, making its histological profile much closer from that
for Red_Parenchyma (2014.I and 2015.I). On chromosome of F271. In the present study, Cm484 again did not exhibit an
7, QTL for PCAest (2014.I) again colocalized with QTL for intense blue FASGA parenchyma. Nevertheless, we were still able
Frontiers in Plant Science | www.frontiersin.org 7 February 2021 | Volume 12 | Article 628960El Hage et al. Impact of Water Regime in Maize Internode
to highlight histological differences between the two parental not be considered similar at the internode level. This gives
lines, and we showed that indeed the Non-lignified_fraction of us the opportunity to compare the impact of two very
Cm484 was more present widespread in the parenchyma than different stress intensities. The significance of the year and
that of F271. More importantly, transgression was observed treatment × year effects for most of the traits reflects this
for all agronomical-, biochemical-, and histological-quantified difference between 2014 and 2015.
traits in the RILs, which allowed us to detect QTL for most We showed that most of the biochemical traits were impacted
of these traits. These quantifications were possible thanks to by the NI scenario in both years. These findings have already
two high-throughput phenotyping tools. First, NIRS equations been reported in maize (El Hage et al., 2018; Virlouvet et al.,
were established to accurately predict traits related to cell wall 2019), sorghum (Luquet et al., 2019), and miscanthus (Van Der
composition and structure as well as in vitro digestibilities Weijde et al., 2017). Nevertheless, what is striking in the present
(IVDMD and IVCWRD) in the internodes of the RIL population. analysis is that even if rainwater was supplied in large quantities
Second, we used a high-throughput image analysis (Legland et al., from the onset of the stress period and of the development of
2017) to quantify histological traits from FASGA-stained maize the internode below the ear in 2015, biochemistry traits (such
internode cross sections. These two tools have enabled us to as PCAest and lignin contents) and in vitro digestibilities of the
accurately characterize biochemical and histological traits in the internodes were impacted similarly in 2014 and 2015, while the
mapping population. This is an important step compared to histological traits were not. Histological and agronomical traits
previous internode studies that only highlighted the link between contributed the most to the emergence of the second PCA axis,
the distribution of the lignification and cell wall degradability and only data from 2014 in the NI scenario were projected apart
in maize (Jung and Casler, 2006; Boon et al., 2008; El Hage from the others on this second PCA axis, reflecting the fact that
et al., 2018), sugarcane (Dos Santos et al., 2015), and sorghum the NI scenario impacted histological pattern only in 2014 but
(Perrier et al., 2017) using a small set of lines. A number of not in 2015. According to El Hage et al. (2018), the histological
QTL for vascular bundle system or stem aerenchymas have responses observed in 2014 resulted in smaller internodes, with
been mapped in plants of agronomical interest such as in a smaller bundle area but greater density, and a proportionately
tomato (Coaker et al., 2002), wheat (Sang et al., 2010), rice larger non-lignified parenchyma area.
(Sasahara et al., 1999; Zhang et al., 2002; Cui et al., 2003; Bai
et al., 2012), and in sorghum (Casto et al., 2018). In maize,
the genetic determinism of histological traits has also recently Distinct QTL Mapped for Biochemical
been investigated (Huang et al., 2016; Mazaheri et al., 2019; and Histological Traits
Zhang et al., 2020). Here, the use of FASGA-stained cross section Heritabilities on the un-replicated RIL field trials have been
allowed us to delimit the rind and the pith fractions and to estimated either over the I scenario and the NI scenario carried
differentiate level of lignification in the different fractions of out in 2014 and 2015 for biochemical and histological traits
maize internode. (Supplementary Table S2). Overall, for most of the traits,
Moreover, until now, no link was made between the variation heritability in I scenario are higher than the ones in NI scenario.
of histological pattern and the variation of cell wall digestibility This corroborates with the fact that 2014_I and 2015_I trials
and composition. are more similar than 2014_NI and 2015_NI trials (Figure 1).
Moreover, heritability for most of the biochemical traits remained
moderated (from 12.4 to 54.5%, except for FAest that reached
Responses to Water Deficit Are Different only 7.6%). This maintenance of the value for heritability for most
When Considering Biochemical or of the chemical traits goes along with the fact that biochemical
Histological Traits traits responded similarly each year. Under I scenario, heritability
All lines were cultivated in field trials, where irrigation was of histological trait is in accordance with what is reported (rind
either provided (I scenario) or stopped (NI scenario) in 2014 thickness h2 = 58% in Mazaheri et al., 2019; bundle-related
and 2015. The natural precipitation did not occur in the traits h2 from 12.8 to 83.6% in Zhang et al., 2020). However,
same way during the maize growing season in the 2 years: histological traits were only impacted by NI scenario in 2014
Indeed, a storm occurred on June 10th 2015, providing up but not in 2015 (see Figure 1 and section “Discussion”). This
to 80 mm of water under both I and NI conditions. The leads to a pronounced reduction of estimated heritability for
amount of water supply during this storm represented more histological traits in NI scenarios, and it forced us to continue
water than all the rainfalls cumulated during the entire maize the identification of QTL trial by trial. Hence, the low heritability
growing season in 2014. Thus, all the plants under the NI for some traits reported in Supplementary Table S2 do not
condition in 2015 benefited from a great water supply at reflect the fact that we identify QTL for these traits under
the start of the onset of water stress. Plant height and each field trial.
biomass yield were less impacted in 2015 than in 2014 by So far, numerous QTL studies have been reported on traits
the NI scenario, reflecting the differences between 2014 and related to agronomic performance and cell wall composition and
2015. Moreover, note that in the physiological development digestibility. The present study allows to map over 200 QTL
of the plant, the 10th of June coincides with the period for agronomical, biochemical, and histological traits under two
of the development of the internode carrying the main ear. contrasting water regimes in the field. It is noteworthy that the
Consequently, the NI condition of 2014 and 2015 could QTL for plant height identified on chromosomes 5 (2014.I and
Frontiers in Plant Science | www.frontiersin.org 8 February 2021 | Volume 12 | Article 628960El Hage et al. Impact of Water Regime in Maize Internode
2014.NI), 8 (2014.I and 2015.NI), and 9 (2014.I and 2015.I) biochemical clusters occurred in this population. However, we
colocalized with QTL for the same trait previously identified frequently noticed colocalizations between QTL for PCAest
in a set of 800 maize inbred lines (Mazaheri et al., 2019). content and QTL for histological variations mainly of rind and
Furthermore, the QTL of stem area mapped on chromosomes 1 lignified parenchyma area and/or intensity. This is in accordance
(2014.I), 2 (2014.I and 2015.NI), 5 (2014.NI), and 7 (2015.NI) with the fact that these tissues are reported to be highly
colocalized with loci involved in stalk diameters measured on p-coumaroylated tissues (Lopez et al., 1993; Chesson et al., 1997;
the third internode previously identified (Mazaheri et al., 2019). Barros-Rios et al., 2012).
QTL involved in bundle numbers (chromosomes 1, 6, and 10
under 2015.NI) also colocalized with those previously identified
in the uppermost internode of an 866 maize-teosinte BC2S3 RILs CONCLUSION
(Huang et al., 2016). In contrast, the QTL for Rind_fraction
on chromosome 5 did not colocalize with the only association We validated the feasibility of high-throughput tools developed
Mazaheri et al. (2019) reported for rind thickness. Additionally, to quantify biochemical and histological traits for QTL detection
the 1-Hist cluster colocalized with a locus involved in the or for selection screening. Our work led to the identification
variation of PCAest previously identified in the pith of the second of constitutive QTL, as well as QTL with an effect only in
internode below the main cob in a panel of 282 divers maize the NI condition, suggesting that the genetic determinism
lines (López-Malvar et al., 2019). Moreover, at this position, a involved in cell wall development at the biochemical and
QTL for PCAest content has been also reported by Santiago et al. histological levels are distinct from those involved under the
(2016). These authors also detected QTL for PCAest at the top of NI scenario. Overall, our data highlighted the potential role of
chromosome 2 and on chromosome 4, positions that colocalize p-coumaroylation of maize stem in refining plant agronomic
with QTL for PCAest mapped in our study. The 1-Hist cluster properties and digestibility.
did not colocalize with any association found by Zhang et al.
(2020) using a panel of 482 lines and computed tomography
(Du et al., 2016). Nevertheless, the QTL for Bundle_number DATA AVAILABILITY STATEMENT
on chromosome 1 at 61.4 Mb colocalized with some of their
associations. These differences may be due to the fact that the The original contributions presented in the study are included
studied internodes and the methods used differ. in the article/Supplementary Material, further inquiries can be
At the biochemical level, four clusters of QTL were detected. directed to the corresponding author/s.
It is noteworthy that only one them, the cluster 4-Bioch,
encompassed QTL involved in the variation of both lignin
content and p-hydroxycinnamic acid contents in the cell wall.
AUTHOR CONTRIBUTIONS
Furthermore, three biochemical clusters (4-Bioch, 5-Bioch, and MR, VM, and SC designed the study and supervised data
6-Bioch) can be considered as constitutive since QTL for both collection. FEH, M-PJ, SC, VM, and MR collected the
years and irrigation scenarios have been detected at these loci. samples. FEH prepared the internode cross sections and
Interestingly, the clusters 4-Bioch and 6-Bioch colocalized with quantified histological traits. YG, M-PJ, and VM carried out
clusters of constitutive QTL detected on chromosome 4 and the biochemical traits quantification. YG established the NIRS
6, respectively, at the whole-plant level (Virlouvet et al., 2019). predictive equations. FEH, P-LL-M, LV, and MR conducted
In addition, QTL for biochemical traits identified only in the the genetic study. FEH, P-LL-M, SC, VM, and MR wrote the
NI scenario (for instance on the bottom of chromosome 8) manuscript. All authors contributed to the article and approved
colocalized with responsive QTL mapped at the whole-plant the submitted version.
level (Virlouvet et al., 2019). This suggests genetic links for
cell wall biochemistry and its response to water deficit between
the internode and whole-plant levels. Indeed, correlations for FUNDING
biochemical traits at the internode level and at the stover level
(Virlouvet et al., 2019) have been calculated (Supplementary This study was supported by the French Government Grant
Table S6). For each field trial (2014.I, 2014.NI, 2015.I, and ANR-11-BTBR-0006 BIOMASS FOR THE FUTURE, managed
2015.NI), correlations were significant for CWR, KL.CWR, FAest, by the French National Research Agency under an “Investments
PCAest, and for the in vitro digestibilities. This is in agreement for the Future” program (Grant ANR- 11-IDEX-0003-02). This
with the correlation between digestibility of the stem and that of work has benefited from the support of IJPB’s Plant Observatory
the stover previously reporter (Hansey et al., 2010; El Hage, 2018). technological platforms. The IJPB also benefits from the support
At the histological level, three clusters of QTL were detected. of Saclay Plant Sciences-SPS (ANR-17-EUR-0007).
Among them, two (1-Hist and 10-Hist) included QTL detected
whatever the year and the irrigation scenario. They are therefore
constitutively involved in the variation of the histological profile ACKNOWLEDGMENTS
of maize internode. On the other hand, the 6-Hist cluster was
mapped only in the NI condition in both 2014 and 2015. We sincerely acknowledge the UE Diascope (Mauguio, France)
It is worth noting that no overlap between histological and for their precious contribution to field experiments.
Frontiers in Plant Science | www.frontiersin.org 9 February 2021 | Volume 12 | Article 628960El Hage et al. Impact of Water Regime in Maize Internode
SUPPLEMENTARY MATERIAL Supplementary Table 3 | Cos2 and Pearson correlation of all the traits for the
two first axes of the PCA.
The Supplementary Material for this article can be found Supplementary Table 4 | Pearson correlation table of all the biochemical
online at: https://www.frontiersin.org/articles/10.3389/fpls.2021. and histological traits for the RILs in each field trial: 2014.I, 2014.NI,
628960/full#supplementary-material 2015.I, and 2015.NI.
Supplementary Table 5 | List of QTL detected for all the histological,
Supplementary Table 1 | Characteristics of NIRS predictive equations developed biochemical, and agronomical traits. When the effect sign is positive, Cm484
for cell wall traits in maize internodes harvested at silage stage. alleles are responsible of the increase of the trait; when the effect
sign is negative, the alleles from F271 are increasing the
Supplementary Table 2 | Variations and heritabilities of each histological,
trait value.
biochemical, and agronomical trait observed for the parental lines and for the RILs
cultivated in 2014 and 2015 in both I and NI scenarios. Different letters reported Supplementary Table 6 | Correlations between the biochemical traits quantified
for the parental values indicated significant differences from a Tukey test. at the internode and at the stover levels (Virlouvet et al., 2019).
REFERENCES two sugarcane genotypes. J. Agric. Food Chem. 63, 4708–4720. doi: 10.1021/
jf5061858
Arends, D., Prins, P., Jansen, R. C., and Broman, K. W. (2010). R/qtl: high- Du, J., Zhang, Y., Guo, X., Ma, L., Shao, M., Pan, X., et al. (2016). Micron-
throughput multiple QTL mapping. Bioinformatics 26, 2990–2992. doi: 10. scale phenotyping quantification and three-dimensional microstructure
1093/bioinformatics/btq565 reconstruction of vascular bundles within maize stalks based on micro-CT
Bai, X., Wu, B., and Xing, Y. (2012). Yield-related QTLs and their applications in scanning. Funct. Plant Biol. 44, 10–22. doi: 10.1071/fp16117
rice genetic improvementF. J. Integr. Plant Biol. 54, 300–311. doi: 10.1111/j. El Hage, F. (2018). Impact du Déficit Hydrique sur la Dégradabilité, la Biochimie
1744-7909.2012.01117.x Pariétale et la Répartition des Tissus Lignifiés chez L’entrenoeud de Maïs et
Barrière, Y., Méchin, V., Lafarguette, F., Manicacci, D., Guillon, F., Wang, H., et al. Déterminisme Génétique de ces Caractères. Paris: Thèse de Doctorat, Biologie
(2009). Toward the discovery of maize cell wall genes involved in silage quality Université Paris-Saclay.
and capacity to biofuel production. Maydica 54, 161–198. El Hage, F., Legland, D., Borrega, N., Jacquemot, M. P., Griveau, Y., Coursol, S.,
Barros-Rios, J., Santiago, R., Malvar, R. A., and Jung, H. J. G. (2012). Chemical et al. (2018). Tissue lignification, cell wall p-coumaroylation and degradability
composition and cell wall polysaccharide degradability of pith and rind tissues of maize stems depend on water status. J. Agric. Food Chem. 66, 4800–4808.
from mature maize internodes. Anim. Feed Sci. Technol. 172, 226–236. doi: doi: 10.1021/acs.jafc.7b05755
10.1016/j.anifeedsci.2012.01.005 Elshire, R. J., Glaubitz, J. C., Sun, Q., Poland, J. A., Kawamoto, K., Buckler,
Boon, E. J. M. C., Struik, P. C., Tamminga, S., Engels, F. M., and Cone, J. W. E. S., et al. (2011). A robust, simple genotyping-by-sequencing (GBS) approach
(2008). Stem characteristics of two forage maize (Zea mays L.) cultivars varying for high diversity species. PLoS One 6:e19379. doi: 10.1371/journal.pone.0019
in whole plant digestibility. III. Intra-stem variability in anatomy, chemical 379
composition and in vitro rumen fermentation. NJAS Wageningen J. Life Sci. 56, Ganal, M. W., Durstewitz, G., Polley, A., Bérard, A., Buckler, E. S., Charcosset, A.,
101–122. doi: 10.1016/s1573-5214(08)80019-x et al. (2011). A large maize (Zea mays L.) SNP genotyping array: development
Broman, K. W., and Sen, S. (2009). A Guide to QTL Mapping with R/qtl. New York, and germplasm genotyping, and genetic mapping to compare with the B73
NY: Springer. reference genome. PLoS One 6:e28334. doi: 10.1371/journal.pone.0028334
Casto, A. L., McKinley, B. A., Yu, K. M. J., Rooney, W. L., and Mullet, J. E. Gärtner, H., Lucchinetti, S., and Schweingruber, F. H. (2014). New perspectives
(2018). Sorghum stem aerenchyma formation is regulated by SbNAC_D during for wood anatomical analysis in dendrosciences: the GSL1-microtome.
internode development. Plant Direct 2:e00085. doi: 10.1002/pld3.85 Dendrochronologia 32, 47–51. doi: 10.1016/j.dendro.2013.07.002
Chesson, A., Provan, G. J., Russell, W., Scobbie, L., Chabbert, B., and Monties, B. Hansey, C. N., Lorenz, A. J., and de Leon, N. (2010). Cell wall composition and
(1997). Characterisation of lignin from parenchyma and sclerenchyma cell walls ruminant digestibility of various maize tissues across development. Bioenergy
of the maize internode. J. Sci. Food Agric. 73, 10–16. doi: 10.1002/(sici)1097- Res. 3, 28–37. doi: 10.1007/s12155-009-9068-4
0010(199701)73:13.0.co;2-e Harholt, J., Krü Ger, Jensen, J., Sørensen, S. O., Orfila, C., Pauly, M., et al. (2006).
Coaker, G. L., Meulia, T., Kabelka, E. A., Jones, A. K., and Francis, D. M. Arabinan deficient 1 is a putative arabinosyltransferase involved in biosynthesis
(2002). A QTL controlling stem morphology and vascular development of pectic arabinan in arabidopsis. Plant Physiol. 140, 49–58. doi: 10.1104/pp.
in Lycopersicon esculentumx Lycopersicon hirsutum (Solanaceae) crosses is 105.072744
located on chromosome 2. Am. J. Bot. 89, 1859–1866. doi: 10.3732/ajb.89.12. Harrison, M. T., Tardieu, F., Dong, Z., Messina, C. D., and Hammer, G. L. (2014).
1859 Characterizing drought stress and trait influence on maize yield under current
Cook, D. D., Meehan, K., Asatiani, L., and Robertson, D. J. (2020). The effect and future conditions. Global Change Biol. 20, 867–878. doi: 10.1111/gcb.12381
of probe geometry on rind puncture resistance testing of maize stalks. Plant Heckwolf, S., Heckwolf, M., Kaeppler, S. M., de Leon, N., and Spalding, E. P. (2015).
Methods 16:35. Image analysis of anatomical traits in stalk transections of maize and other
Cui, K., Peng, S., Xing, Y., Yu, S., Xu, C., and Zhang, Q. (2003). Molecular grasses. Plant Methods 11:26.
dissection of the genetic relationships of source, sink and transport tissue with Huang, C., Chen, Q., Xu, G., Xu, D., Tian, J., and Tian, F. (2016). Identification
yield traits in rice. Theor. Appl. Genet. 106, 649–658. doi: 10.1007/s00122-002- and fine mapping of quantitative trait loci for the number of vascular bundle in
1113-z maize stem. J. Integr. Plant Biol. 58, 81–90. doi: 10.1111/jipb.12358
Culhaoglu, T., Zheng, D., Méchin, V., and Baumberger, S. (2011). Adaptation of the Jung, H. G., and Casler, M. D. (2006). Maize stem tissues: impact of development
carrez procedure for the purification of ferulic and p-coumaric acids released on cell wall degradability. Crop Sci. 46, 1801–1809. doi: 10.2135/cropsci2006.
from lignocellulosic biomass prior to LC/MS analysis. J. Chromatogr. B 879, 02-0086
3017–3022. doi: 10.1016/j.jchromb.2011.08.039 Lapierre, C., Monties, B., and Rolando, C. (1986). Preparative thioacidolysis
Dence, C. W. (1992). “The determination of lignin,” in Springer Series in Wood of spruce lignin: isolation and identification of main monomeric products.
Science, ed. W. Rupert (Berlin: Springer). Holzforschung 40, 47–50. doi: 10.1515/hfsg.1986.40.1.47
de Givry, S., Bouchez, M., Chabrier, P., Milan, D., and Schiex, T. (2005). CARH T A Legland, D., El Hage, F., Méchin, V., and Reymond, M. (2017). Histological
GENE: multipopulation integrated genetic and radiation hybrid mapping. quantification of maize stem sections from FASGA-stained images. Plant
Bioinformatics 21, 1703–1704. doi: 10.1093/bioinformatics/bti222 Methods 13:84.
Dos Santos, A. B., Bottcher, A., Kiyota, E., Mayer, J. L. S., Vicentini, R., Dos Santos, Lopez, S., Murison, S. D., Travis, A. J., and Chesson, A. (1993). Degradability of
et al. (2015). Water stress alters lignin content and related gene expression in parenchyma and sclerenchyma cell walls isolated at different developmental
Frontiers in Plant Science | www.frontiersin.org 10 February 2021 | Volume 12 | Article 628960El Hage et al. Impact of Water Regime in Maize Internode stages from a newly extended maize internode. Acta Botanica Neerlandica 42, Shiferaw, B., Prasanna, B. M., Hellin, J., and Bänziger, M. (2011). crops that feed 165–174. doi: 10.1111/j.1438-8677.1993.tb00693.x the world 6. past successes and future challenges to the role played by maize López-Malvar, A., Butrón, A., Samayoa, L. F., Figueroa-Garrido, D. J., Malvar, R. A., in global food security. Food Security 3, 307–327. doi: 10.1007/s12571-011-01 and Santiago, R. (2019). Genome-wide association analysis for maize stem cell 40-5 wall-bound hydroxycinnamates. BMC Plant Biol. 19:519. Tolivia, D., and Tolivia, J. (1987). Fasga: a new polychromatic method for Luquet, D., Perrier, L., Clément-Vidal, A., Jaffuel, S., Verdeil, J. L., Roques, S., simultaneous and differential staining of plant tissues. J. Microsci. 148, 113–117. et al. (2019). Genotypic covariations of traits underlying sorghum stem biomass doi: 10.1111/j.1365-2818.1987.tb02859.x production and quality and their regulations by water availability: insight from Updegraff, D. M. (1969). Semimicro determination of cellulose inbiological studies at organ and tissue levels. GCB Bioenergy 11, 444–462. doi: 10.1111/ materials. Anal. Biochem. 32, 420–424. doi: 10.1016/s0003-2697(69) gcbb.12571 80009-6 Mazaheri, M., Heckwolf, M., Vaillancourt, B., Gage, J. L., Burdo, B., Heckwolf, S., Van Der Weijde, T., Huxley, L. M., Hawkins, S., Sembiring, E. H., Farrar, K., et al. (2019). Genome-wide association analysis of stalk biomass and anatomical Dolstra, O., et al. (2017). Impact of drought stress on growth and quality of traits in maize. BMC Plant Biol. 19:45. miscanthus for biofuel production. GCB Bioenergy 9, 770–782. doi: 10.1111/ Méchin, V., Argillier, O., Menanteau, V., Barrière, Y., Mila, I., Pollet, B., et al. gcbb.12382 (2000). Relationship of cell wall composition to in vitro cell wall digestibility Virlouvet, L., El Hage, F., Griveau, Y., Jacquemot, M. P., Gineau, E., of maize inbred line stems. J. Sci. Food Agric. 80, 574–580. doi: 10.1002/(sici) Baldy, A., et al. (2019). Water deficit-responsive QTLs for cell wall 1097-0010(200004)80:53.0.co;2-r degradability and composition in maize at silage stage. Front. Plant Sci. Méchin, V., Argillier, O., Rocher, F., Hébert, Y., Mila, I., and Pollet, B. (2005). 10:488. In search of a maize ideotype for cell wall enzymatic degradability using Vo, L. T. T., Girones, J., Jacquemot, M.-P., Legée, F., Cézard, L., histological and biochemical lignin characterization. J. Agric. Food Chem. 53, Lapierre, C., et al. (2020). Correlations between genotype biochemical 5872–5881. doi: 10.1021/jf050722f characteristics and mechanical properties of maize stem - polyethylene Morrison, T. A., Kessler, J. R., Hatfield, R. D., and Buxton, D. R. (1994). Activity composites. Ind. Crops Prod. 143:111925. doi: 10.1016/j.indcrop.2019.11 of two lignin biosynthesis enzymes during development of a maize internode. 1925 J. Sci. Food Agric. 65, 133–139. doi: 10.1002/jsfa.2740650202 Zhang, Y., Legay, S., Barrieìre, Y., Méchin, V., and Legland, D. (2013). Color Perrier, L., Rouan, L., Jaffuel, S., Clément-Vidal, A., Roques, S., Soutiras, A., et al. quantification of stained maize stem section describes lignin spatial distribution (2017). Plasticity of sorghum stem biomass accumulation in response to water within the whole stem. J. Agric. Food Chem. 61, 3186–3192. doi: 10.1021/ deficit: a multiscale analysis from internode tissue to plant level. Front. Plant jf400912s Sci. 8:1516. Zhang, Y., Wang, J., Du, J., Zhao, Y., Lu, X., Wen, W., et al. (2020). Dissecting R Core Team (2014). R: A Language and Environment for Statistical Computing. the phenotypic components and genetic architecture of maize stem vascular Vienna: R Foundation for Statistical Computing. Available online at: https: bundles using high-throughput phenotypic analysis. Plant Biotechnol. J. 1, //www.R-project.org/ 35–50. doi: 10.1111/pbi.13437 Sang, Y., Deng, Z. Y., Zhao, L., Zhang, K. P., Tian, J. C., and Ye, B. X. (2010). Zhang, Z.-H., Li, P., Wang, L.-X., Tan, C.-J., Hu, Z.-L., Zhu, Y.-G., et al. (2002). QTLs for the vascular bundle system of the uppermost internode using a Identification of quantitative trait loci (QTLs) for the characters of vascular doubled haploid population of two elite Chinese wheat cultivars. Plant Breed. bundles in peduncle related to indica-japonica differentiation in rice (Oryza 129, 605–610. doi: 10.1111/j.1439-0523.2009.01727.x sativa L.). Euphytica 128, 279–284. Santiago, R., López-Malvar, A., Souto, C., and Barros-Ríos, J. (2018). Methods for determining cell wall-bound phenolics in maize stem tissues. J. Agric. Food Conflict of Interest: The authors declare that the research was conducted in the Chem. 66, 1279–1284. doi: 10.1021/acs.jafc.7b05752 absence of any commercial or financial relationships that could be construed as a Santiago, R., Malvar, R. A., Barros-Rios, J., Samayoa, L. F., and Butron, A. (2016). potential conflict of interest. Hydroxycinnamate synthesis and association with mediterranean corn borer resistance. J. Agric. Food Chem. 64, 539–551. doi: 10.1021/acs.jafc.5b04862 Copyright © 2021 El Hage, Virlouvet, Lopez-Marnet, Griveau, Jacquemot, Coursol, Sasahara, H., Fukuta, Y., and Fukuyama, T. (1999). Mapping of QTLs for vascular Méchin and Reymond. This is an open-access article distributed under the terms bundle system and spike morphology in rice. Oryza sativa L. Breed. Sci. 49, of the Creative Commons Attribution License (CC BY). The use, distribution or 75–81. doi: 10.1270/jsbbs.49.75 reproduction in other forums is permitted, provided the original author(s) and the Seegmiller, W. H., Graves, J., and Robertson, D. J. (2020). A novel rind puncture copyright owner(s) are credited and that the original publication in this journal technique to measure rind thickness and diameter in plant stalks. Plant Methods is cited, in accordance with accepted academic practice. No use, distribution or 16:44. reproduction is permitted which does not comply with these terms. Frontiers in Plant Science | www.frontiersin.org 11 February 2021 | Volume 12 | Article 628960
You can also read


