Review of velocity models in the Faroe - Shetland Channel
←
→
Page content transcription
If your browser does not render page correctly, please read the page content below
Downloaded from http://sp.lyellcollection.org/ by guest on December 29, 2021

        Review of velocity models in the Faroe –Shetland Channel
                              UNI K. PETERSEN1* & THOMAS FUNCK2
    1
     Faroese Earth and Energy Directorate, Brekkutún 1, FO 110 Tórshavn, Faroe Islands
               2
                Geological Survey of Denmark and Greenland, Øster Voldgade 10,
                                1350 Copenhagen K, Denmark
                                *Corresponding author (e-mail: up@jf.fo)

          Abstract: Over the last few decades, a number of wide-angle seismic experiments have been
          conducted in the Faroe–Shetland Channel area with the objective of mapping the crustal structure.
          However, the volcanic rocks covering most of the area present a challenge for the imaging of sub-
          basalt structures. The results of the seismic studies are consistent in describing the Faroe–Shetland
          Channel as thinned continental crust and in establishing the presence of sub-basalt sediments.
          However, the various datasets often show differences in depth to crystalline basement and to
          the Moho. This paper presents a review of the velocity models in the Faroe–Shetland Channel
          and analyses the differences at line intersections. Down to top basalt the models are fairly con-
          sistent, while there are deviations of up to 1 km s21 in basalt velocities and sub-basalt sediment
          velocities, 2 km in basalt thickness, 3.2 km in depth to crystalline basement, and 11.7 km in
          depth to the Moho.

          Gold Open Access: This article is published under the terms of the CC-BY 3.0 license.

The Faroe–Shetland Channel (Fig. 1) is character-             basalt has on the imaging of sub-basalt structures
ized by Palaeogene volcanic rocks associated with             is very well illustrated by Neish (2004, p. 142, fig.
the North Atlantic Igneous Province and the break-            15). She showed that there is a large area on the
up of the North Atlantic (Larsen et al. 1999). The            Faroese continental shelf where base basalt and
volcanic rocks cover large areas around the Faroe             sub-basalt structures are difficult to interpret on seis-
Islands and make the imaging of deeper sections               mic reflection data.
challenging. Over the last few decades, a number of               One of the main objectives for most refraction
wide-angle seismic experiments have been con-                 experiments around the Faroes is the improvement
ducted in the Faroe–Shetland Channel area with the            of the sub-basalt imaging (e.g. Fliedner & White
objective of mapping the crustal velocity structure.          2003), which is difficult to achieve with seismic
    The different surveys (Hughes et al. 1998; Rich-          reflection data alone. Seismic refraction data can
ardson et al. 1999; White et al. 1999; Fliedner &             hold information on sub-basalt properties in these
White 2003; Raum et al. 2005; Eccles et al. 2007;             areas by providing observations of seismic phases
Makris et al. 2009; Roberts et al. 2009) describe             at large offsets.
the crust beneath the Faroe –Shetland Channel as
thinned continental crust. Further, they all indicate
the presence of sub-basalt sediments. However, a
                                                              Comparison of velocity models
comparison of intersecting profiles shows that there          Table 1 summarizes the acquisition parameters
are a number of differences between crossing and              of the seismic lines reviewed in this study. To ease
adjacent lines (Funck et al. 2014). In this paper,            the comparison of the lines, digital versions of the
we review all velocity models in the Faroe –Shet-             velocity models were produced. For line AMP-D,
land Channel that are based on seismic refraction             a digital model was available, while the remain-
data, and some of them also on gravity data,                  ing models were digitized based on publications and
acquired since 1994. The objective is to quantify             existing reports. The digital models were obtained
the differences at line intersections and to discuss          by converting the colour values according to the
the implications.                                             colour-scale bar in figures (FLARE and Mobil sur-
    The variable seismic properties within the basalt         veys), by reading velocity contours (iSIMM line) or
column with a succession of high-impedance con-               by converting annotated velocity models (AMG95
trasts leads to attenuation and scattering of seismic         and FAST surveys). The location of the models is
waves during the propagation through the basalts              based on digital navigation (FAST, FLARE and
(e.g. Maresh et al. 2006). The adverse effect that            iSIMM surveys) or on digitized location maps

From: Péron-Pinvidic, G., Hopper, J. R., Stoker, M. S., Gaina, C., Doornenbal, J. C., Funck, T. & Árting, U. E.
(eds) The NE Atlantic Region: A Reappraisal of Crustal Structure, Tectonostratigraphy and Magmatic Evolution.
Geological Society, London, Special Publications, 447, http://doi.org/10.1144/SP447.7
# 2016 The Author(s). Published by The Geological Society of London.
Publishing disclaimer: www.geolsoc.org.uk/pub_ethics
Downloaded from http://sp.lyellcollection.org/ by guest on December 29, 2021

                                          U. K. PETERSEN & T. FUNCK

Fig. 1. Location of the reviewed seismic refraction lines (see Table 1 for more details). Bathymetry contours (after
Hopper & Gaina 2014) are at 200 m intervals. White crosses show the locations of the Lopra, Brugdan, William and
Anne Marie wells. The shaded area shows the basalt cover (after á Horni et al. 2014). The inset shows the location
of the survey area.

taken from publications (AMG95 and Mobil sur-               gravity data in the modelling. The modelling proce-
veys). Figure 1 shows the location of all wide-angle        dures for each survey are summarized below. For
seismic lines used in this study.                           details on the modeling, we refer readers to the
    The modelling of travel times is based on ray           respective publications.
theory. All velocity models are developed using a               At line intersections, key model features are
combination of forward and inverse modeling, with           compared. This includes the depth to crystalline
the exception of the models regarding the Mobil             basement and the Moho, as well as the thickness
survey that are based on forward modelling only.            of the basalt sequence and the underlying sediments.
In addition, the FAST, FLARE and iSIMM surveys              In addition, basalt and sub-basalt velocities are
use conventional semblance analysis techniques on           compared.
reflection seismic data for modelling the post-basalt           With the exception of FLARE lines 2 –12, all
sediments and the top basalt interface. The FLARE,          velocity models infer Moho for the full length
FAST, AMG95 and AMP-D surveys integrate                     of the profiles, even though large sections of the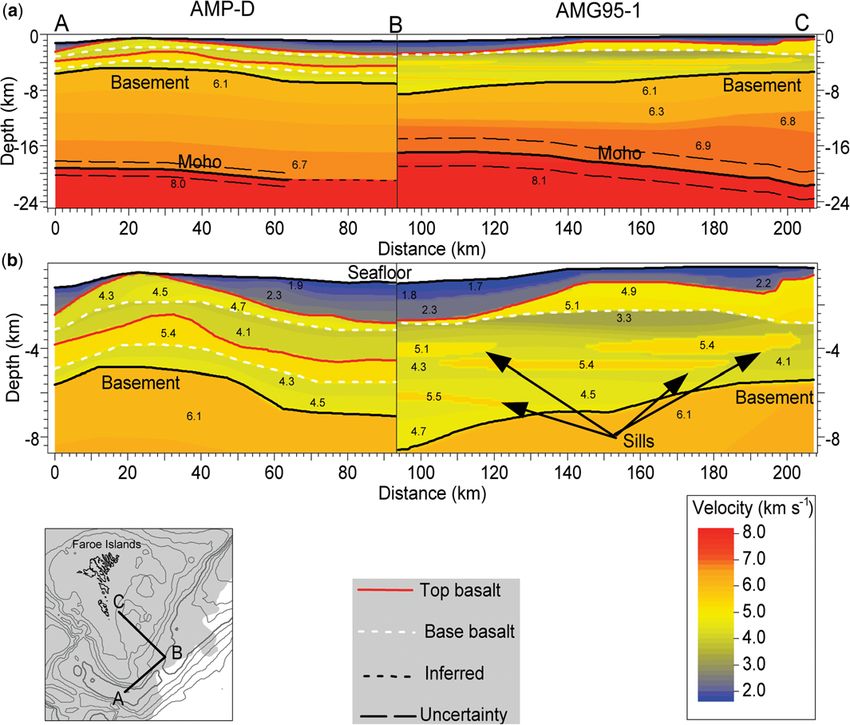
Downloaded from http://sp.lyellcollection.org/ by guest on December 29, 2021

                       VELOCITY MODELS IN THE FAROE–SHETLAND CHANNEL

Table 1. Reviewed seismic refraction lines

Line name         Acquisition                   Acquisition parameters                    Publications used
                     year                                                                for the digitization
                                                                                            of the model

AMG95-1 and          1995       Source: 79 l airgun array, 150 m shot interval          Raum et al. (2005)
 AMG95-2                        Receivers: Ocean-bottom seismographs. 42 stations
                                  along AMG95-1 and 40 stations along AMG95-2.
                                  4 km receiver spacing
AMP-D                1996       Source: 120 l airgun array. 120 m shot spacing          Digital model
                                Receivers: Ocean-bottom seismographs, 45 stations         was available
                                  with 2 – 4 km spacing                                   (Klingelhöfer
                                                                                          et al. 2005)
FAST                 1994       Source: 153 l airgun array. 50 m shot interval          Richardson et al.
                                Receivers: Four land stations with vertical               (1999)
                                  component geophones located on Streymoy Faroe
                                  Islands and 6 km streamer
FLARE-1              1996       Two-ship acquisition.                                   White et al. (1999)
                                Source: One 85.1 l and one 49.2 l airgun array. 50 m
                                  shot interval for each ship. Composite gathers have
                                  100 m shot intervals
                                Receivers: One 6 km and one 4.8 km streamer.
                                  Offset gap between cables 5.6, 15.2 and 24.8 km.
                                  Maximum offset for marine data is 38.4 km. Six
                                  additional land seismometers were placed on
                                  Suðuroy (Faroe Islands)
FLARE-2 and          1996       Two-ship acquisition                                    Latkiewicz & Kirk
  FLARE-3                       Source: One 85.1 l and one 49.2 l airgun array. 50 m      (1999)
                                  shot interval for each ship. Composite gathers have
                                  100 m shot intervals
                                Receivers: One 6-km and one 4.8 km streamer.
                                  Offset gap between cables 5.6, 15.2 and 24.8 km.
                                  Maximum offset is 38 400 m
FLARE-4–             1998       Two-ship acquisition                                    Latkiewicz & Kirk
  FLARE-12                      Source: One 58.0 l and one 62.3 l airgun array. 50 m      (1999)
                                  shot interval for each ship. Composite gathers have
                                  100 m shot intervals
                                Receivers: Two 6 km streamers. Offset gap
                                  between cables 6 km. Maximum offset of 18 km
iSIMM                2002       Source: 103 litre airgun array. 100 m shot interval     Roberts et al.
                                Receivers: Ocean-bottom seismographs, 85 stations         (2009)
                                  with 2 – 6 km spacing
Mobil-1 and          1996       Source: 120 litre airgun array. 120 m shot interval     Makris et al. (2009)
 Mobil-2                        Receivers: Ocean-bottom seismographs. 24 stations
                                  with 3.5 km spacing along Mobil-1 and 42 stations
                                  with 3.8 km spacing along Mobil-2

Moho are not constrained by PmP (reflections from       line AMG95-2 (Raum et al. 2005) was obtained
the Moho) and Pn (mantle refractions) arrivals.         from forward and inverse modelling of travel
Where not constrained by seismic data, the Moho is      times. In addition, information from coincident seis-
defined by extrapolation, a priori information for      mic reflection data was incorporated into the model.
the area or gravity data. In fact, at no intersection   No PmP or Pn phases were observed that could
presented here do both profiles have seismic con-       determine the Moho depth. For this reason, the
straints on the depth of the Moho.                      Moho was inferred from gravity modelling. Sub-
                                                        basalt sediment structures and velocities are based
Comparison of lines Mobil-1 and AMG95-2                 on discontinuous horizons interpreted on seismic
                                                        reflection data in the area.
Lines Mobil-1 and AMG95-2 (Fig. 2) are offset               The initial velocity model for line Mobil-1
by 3.8 km and run parallel to each other in a           (Hughes et al. 1998) is based on forward model-
35 km-wide zone (Fig. 1). The velocity model for        ling. Similar to line AMG95-2, the Moho depth is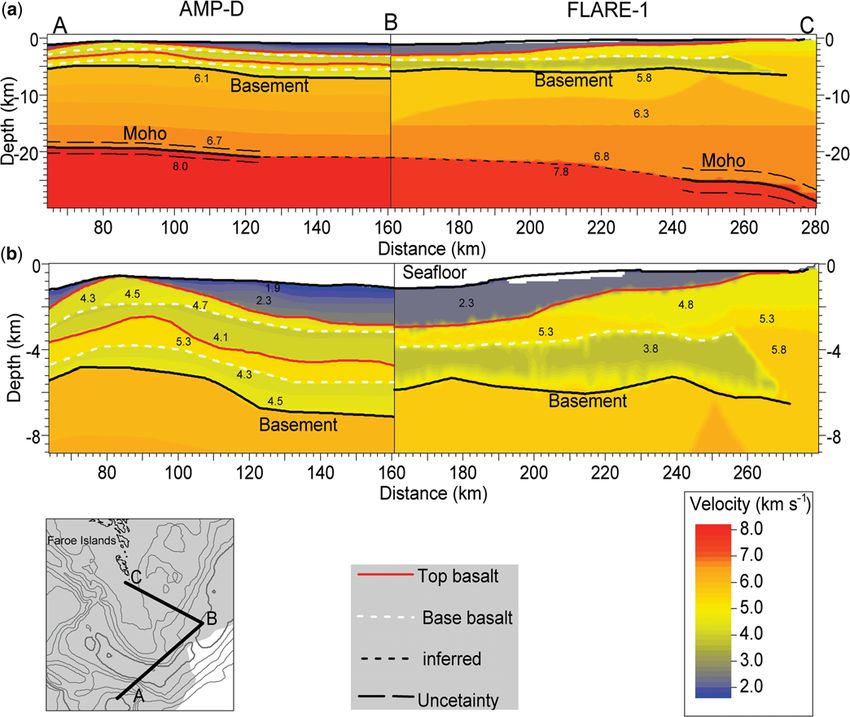
Downloaded from http://sp.lyellcollection.org/ by guest on December 29, 2021
U. K. PETERSEN & T. FUNCK
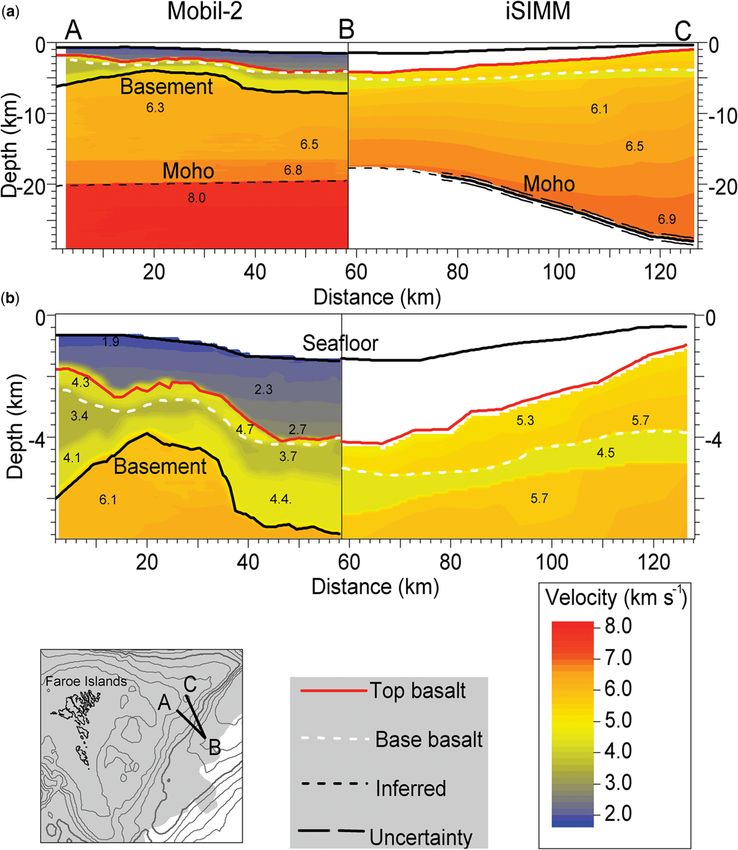
Fig. 2. Comparison of P-wave velocity models of lines Mobil-1 and AMG95-2. (a) & (b) show different depth
scales. The two lines do not intersect but run parallel to each other at a distance of 3.8 km. Annotated velocities are
given in km s21. The map in the lower left-hand corner shows the location of the composite profile. The shaded area
shows the basalt cover.
constrained by gravity data as there are no clear PmP constrained Moho in Figure 2 is based on the loca-
observations. Only one ocean-bottom seismometer tion of the OBS array, and the uncertainty in
(OBS) recorded a phase that could be a PmP. How- Moho depth is estimated from the velocity uncer-
ever, it is unclear whether the reflection is, indeed, tainties given by Makris et al. (2009). The inferred
from the Moho and not from intruded or underplated Moho outside the area with seismic constraint
magmatic rocks. In the gravity modelling, the Moho appears to be based on extrapolations only. The sub-
depth was set to 30 km beneath the Shetland Plat- basalt velocities appear to be based on the extra-
form and to 40–45 km beneath the Faroe Islands. In polation of velocities from areas not covered by
the Faroe –Shetland Channel, the Moho was then basalts.
adjusted to maintain isostatic equilibrium. How- While the basalts have a thickness of 2 km on
ever, the model shown in Figure 2 is based on the line AMG95-2, they are only 1 km thick on line
later modelling by Makris et al. (2009) without the Mobil-1. It is not clear how Makris et al. (2009)
use of gravity data. They incorporated additional determined the thickness of the basalts on line
wide-angle seismic data consisting of an OBS Mobil-1: however, the earlier model by Hughes
array (5 × 8 OBS with a 5 km grid spacing) and a et al. (1998) displays a similar basalt thickness
north–south line with 10 OBS crossing this array. that is constrained by the lateral extent of the refrac-
This improved the constraints on the Moho along tion in the basalt layer using a velocity gradient
the central part of line Mobil-1 based on PmP reflec- obtained from synthetic amplitude modelling.
tions. The extent of the line with a seismically The basalt thickness on line Mobil-1 corresponds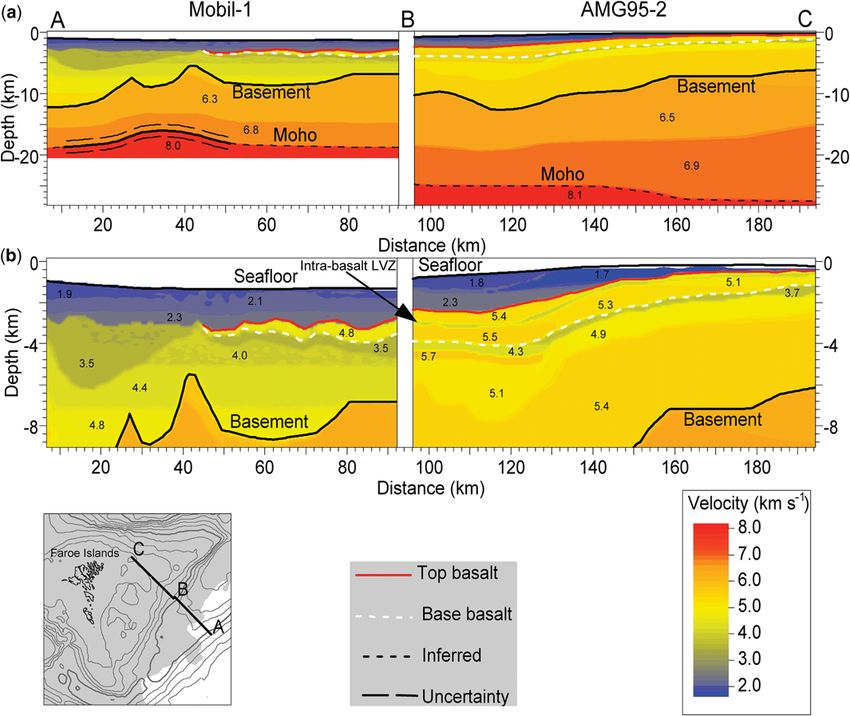
Downloaded from http://sp.lyellcollection.org/ by guest on December 29, 2021

                        VELOCITY MODELS IN THE FAROE–SHETLAND CHANNEL

                   Table 2. Comparison of features of the velocity models at the
                   intersection of lines Mobil-1 and AMG95-2

                                                             Mobil-1            AMG95-2

                   Moho                                   18.7 km            25 km
                   Crystalline basement                   6.8 km             10 km
                   Basalt thickness                       1 km               2 km
                   Basalt velocity                        4.8 km s21         5.4 km s21
                   Sub-basalt sediment thickness          3.3 km             6 km
                   Sub-basalt sediment velocities         3.5– 4.4 km s21    4.4– 5.5 km s21

roughly to the upper part of the basalt sequence            4.5 km s21. Crystalline basement was not inter-
on line AMG95-2, defined by an intra-basalt low-            preted. However, the coincident seismic reflection
velocity zone.                                              data show a strong reflection across the Fugloy
    A comparison of the key features in the veloc-          Ridge at about 1.25 s two-way travel time (TWT)
ity models is given in Table 2. The depth to crystal-       below the base of the LVZ, which could represent
line basement differs by 3.2 km. Velocities in the          the crystalline basement (Roberts et al. 2009). The
sub-basalt sediments are 1.0 km s21 higher on line          Moho is constrained by PmP phases throughout
Mobil-1 than on line AMG95-2. Differences in the            the profile, and the uncertainty in the Moho depth
sub-basalt velocities can explain some of the misfit        is given by Roberts et al. (2009).
in the depth to crystalline basement but are not                The velocity model shown in the paper of Rob-
sufficient to account for the full 3.2 km. The differ-      erts et al. (2009) does not specify the sediment
ence in the sub-basalt sediment velocities is difficult     velocities above the basalts. However, for a portion
to assess, as neither Makris et al. (2009) nor Raum         of the line, Lau et al. (2010) provide such informa-
et al. (2005) provide details on how these velocities       tion using a pre-stack depth-migration workflow.
are constrained. The difference in depth to Moho is         They obtain post-basalt sediment velocities of
6.3 km, but at the intersection there is no constraint      1.6 –2.6 km s21. This velocity range is similar to
from seismic data.                                          the intersecting lines FLARE-11 and Mobil-2.
                                                                The comparison of the velocity models of lines
                                                            Mobil-2 and iSIMM is summarized in Table 3 and
Comparison of lines Mobil-2 and iSIMM
                                                            reveals a 0.7 km difference in basalt thickness. In
Lines Mobil-2 and iSIMM intersect in the central            fact, the basalt layer on line Mobil-2 peters out at
part of the Faroe– Shetland Channel (Fig. 3). The           the cross-point with line iSIMM. The velocities of
model for line Mobil-2 is taken from Makris et al.          the LVZ deviate by 0.9 km s21 at the top but are
(2009). Similar to line Mobil-1, an earlier model           similar at the base. The depth to the Moho deviates
is presented in Hughes et al. (1998). That model            by 1.9 km. Both lines have constraints on the Moho
shows the Moho to be 6 km deeper, based on grav-            depth, although not at the actual intersection. The
ity modelling. The modelling of line Mobil-2 fol-           modelling of the lines was carried out without
lowed the procedure of line Mobil-1 described               incorporation of gravity data and no a priori infor-
above and uses the same OBS array and north–                mation on Moho depth was used.
south line dataset to constrain the Moho depth at
the centre of the profile. Along the remainder of           Comparison of lines FLARE-1, AMG95-1
the profile, the depth to Moho is apparently
extrapolated.                                               and FAST
    The velocity model for line iSIMM (Roberts              The composite transect of lines FLARE-1, AMG95-
et al. 2009) is based on combined forward and               1 and FAST (Fig. 4) describes a zigzag path running
inverse modelling of travel times. In addition, con-        from the southernmost island of the Faroes to the
ventional semblance analysis techniques on reflec-          centre of the Faroe –Shetland Channel, back to the
tion seismic data were used for the modelling of            Faroe Islands and from there back into the channel.
sediment velocities. Special attention was given to         The velocity modelling along line AMG95-1 (Raum
model the step back indicative of the low-velocity          et al. 2005) was carried out in a similar way as
zone (LVZ) below the basalts. The velocity in the           described above for line AMG95-2. However, the
LVZ was determined by forward modelling for                 PmP and Pn phases constrain the Moho depth on
the thickness of the LVZ at various fixed veloci-           line AMG95-1. Raum et al. (2005) provided esti-
ties. The best fit was obtained using a velocity of         mates on the depth uncertainty of interfaces.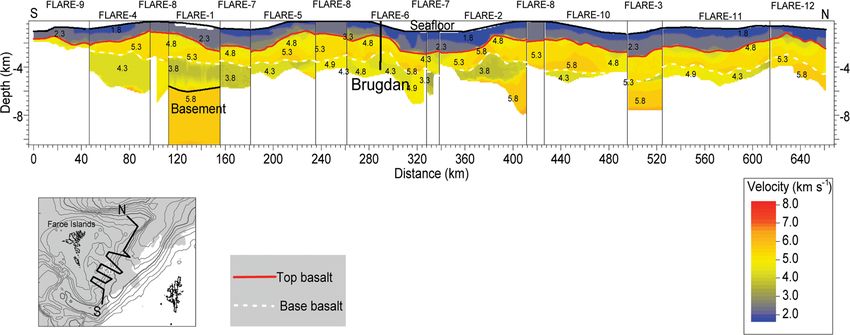
Downloaded from http://sp.lyellcollection.org/ by guest on December 29, 2021

                                          U. K. PETERSEN & T. FUNCK

Fig. 3. Comparison of P-wave velocity models of lines Mobil-2 and iSIMM. (a) & (b) show the different depth
scales. Annotated velocities are given in km s21. The map in the lower left-hand corner shows the location of the
composite profile. The shaded area shows the basalt cover. The uncertainty of the Moho depth is set to +0.5 km,
being representative of the more detailed uncertainties given in Roberts et al. (2009).

   The shallow velocity structure of line FLARE-1            on basalt velocities were obtained from vertical
(Richardson et al. 1999; White et al. 1999) was              seismic profiles (VSP) recorded as part of the FIRE
determined using conventional semblance analysis             experiment (Richardson et al. 1998), the VSP at the
techniques and the top basalt was derived from               Lopra well (Kiørboe & Petersen 1995) and from
the interpretation of the seismic reflection data.           older seismic refraction data (Palmason (1965).
Forward and inverse modelling was used for the               For the lower crust, fixed velocities of 6.4 and
velocity analysis in the deeper sections. Constraints        6.8 km s21 at the top and base, respectively, were
Downloaded from http://sp.lyellcollection.org/ by guest on December 29, 2021

                         VELOCITY MODELS IN THE FAROE–SHETLAND CHANNEL

                    Table 3. Comparison of features of the velocity models at the
                    intersection of lines Mobil-1 and iSIMM

                                                              Mobil-2                iSIMM

                    Moho                                  19.5 km               17.6 km
                    Crystalline basement                  7.1 km
                    Basalt thickness                      0 km                  0.7 km
                    Basalt velocity                       4.7 km s21            4.8– 5.3 km s21
                    Sub-basalt sediment thickness         3 km
                    Sub-basalt sediment velocities        3.6– 4.5 km s21       4.5 km s21

used owing to a lack of seismic constraints. These          that helped in the gravity modelling of the Moho
velocities are similar to the ones observed in              along the remainder of the line. Neither Richardson
nearby continental crust in the UK (Richardson              et al. (1999) nor White et al. (1999) provided esti-
et al. 1999). Strong PmP reflections recorded on            mates on the uncertainty of the Moho depth, which
one land station at the NW end of the profile pro-          is why a rather large estimate of 2 km is used in
vided some seismic constraints on the Moho depth            Figure 4.

Fig. 4. Comparison of P-wave velocity models of lines FLARE-1, AMG95-1 and FAST. (a) & (b) show different
depth scales. Annotated velocities are given in km s21. The map in the lower left-hand corner shows the location of
the composite profile. The shaded area shows the basalt cover.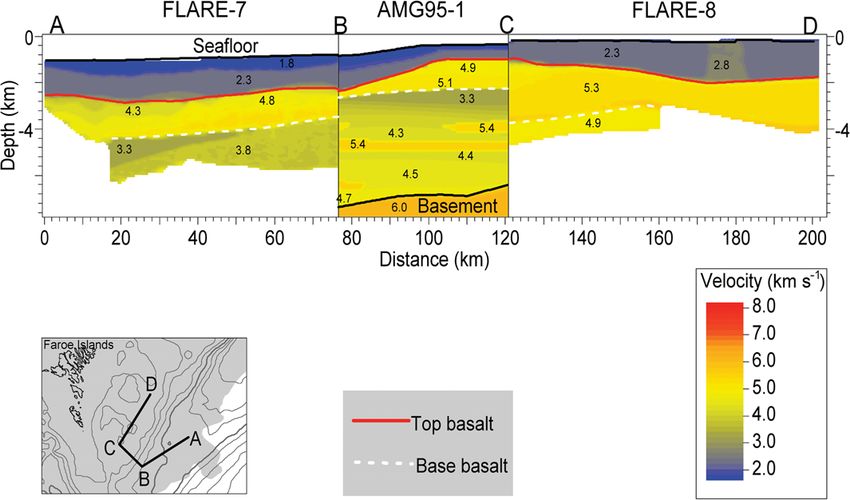
Downloaded from http://sp.lyellcollection.org/ by guest on December 29, 2021

                                             U. K. PETERSEN & T. FUNCK

                   Table 4. Comparison of features of the velocity models at the
                   intersection of lines FLARE-1 and AMG95-1

                                                                   FLARE-1              AMG95-1

                   Moho                                           21.5 km           17 km
                   Crystalline basement                           5.6 km            7.4 km
                   Basalt thickness                               1 km              0 km
                   Basalt velocity                                5.25 km s21       5 km s21
                   Sub-basalt sediment thickness                  2 km              5 km
                   Sub-basalt sediment velocities                 3.8 km s21        3.3 – 4.6 km s21*

                   *Not including velocities of sills in the sub-basalt section.

    Similar to line FLARE-1, the shallow velocities                on the Faroe Islands either relate to intrusions or
of line FAST (Richardson et al. 1999) were deter-                  could represent a crystalline basement high. In con-
mined using conventional semblance analysis                        trast, the model of line AMG95-1 shows a continu-
techniques and the top basalt was taken from the                   ation of the LVZ beneath the Faroe Islands.
interpretation of the stacked profile. The crustal                     At the intersection of lines AMG95-1 and
velocity structure was obtained from forward and                   FAST, the Moho depth is 22.3 and 34 km, respec-
inverse modelling of travel times from data recorded               tively. The unreversed ray coverage and the signifi-
on the four land seismometers. These seismometers                  cant offset of the seismic stations relative to the
were not deployed along the extension of the shot                  shot line are likely to be the main reasons for the
line but were offset by 27–50 km to the north. High-               differences. Although the intersection is at an
amplitude wide-angle reflections observed on one                   unconstrained location for both lines, this is a
of the land stations determined the Moho depth at                  quite significant difference, especially when consid-
the NW end. In all other areas, gravity modelling                  ering that both lines incorporate gravity data in the
was employed to obtain the depth to the Moho. The                  velocity modelling.
uncertainty on the Moho depth was not provided                         It should be noted that the publications on
by Richardson et al. (1999), and Figure 4 uses there-              the FLARE survey use the term ‘basement’ in the
fore an estimate of 2 km similar to line FLARE-1.                  meaning of ‘seismic basement’ corresponding to
    Tables 4 and 5 compare the velocity models                     a strong sub-basalt reflection and not crystalline
at their intersections. At the crossing of lines                   basement (e.g. Fliedner & White 2001; Fruehn
FLARE-1 and AMG95-1, the deviation in basalt                       et al. 2001). In Fliedner & White (2003, p. 356,
thickness of 1 km is most likely to be related to                  fig. 11), the depth to crystalline basement along
differences in the interpretation of the data. The                 line FLARE-1 is interpreted at a depth of 10 –
sub-basalt velocities are around 3.8 km s21 on line                12 km, whereas the modelled seismic basement is
FLARE-1, but vary between 3.3 and 4.6 km s21                       only 5–7 km deep (Fig. 4).
on line AMG95-1. In addition, the velocity model
for line AMG95-1 shows several thick intrusions                    Comparison of lines AMP-D and AMG95-1
within the sub-basalt sediments with velocities of
5.15–5.50 km s21. On lines FLARE-1 and FAST,                       Line AMP-D is a strike line in the Faroe –Shetland
the LVZ terminates close to the Faroe Islands.                     Channel and is perpendicular to line AMG95-1
This termination is based on observations from                     that extends to the Faroe Islands (Fig. 1). The veloc-
the land seismometers. Richardson et al. (1999) sug-               ity model (Fig. 5) of line AMP-D (Klingelhöfer
gested that the higher velocities beneath the basalts              et al. 2005) is based on forward and inverse model-
                                                                   ling of travel times. In addition, ray-synthetic seis-
                                                                   mograms were calculated. Large portions of the
Table 5. Comparison of features of the velocity                    Moho are constrained by PmP and Pn phases. In
models at the intersection of lines AMG95-1 and                    addition, gravity modelling was invoked to obtain
FAST                                                               the Moho depth in the seismically unconstrained
                                                                   segments. The model for line AMP-D has two
                             AMG95-1                 FAST          distinct LVZs beneath basalt layers. Velocities in
                                                                   these LVZs are not constrained, and are set to
Moho                    22.3 km                    34 km           3.95 –4.15 km s21 for the upper LVZ and 4.2 –
Crystalline basement    5 km                       7.5 km
Basalt thickness        2 km                       4 km            4.7 km s21 for the lower LVZ. The modelling pro-
Basalt velocity         4.75 –5.00 km s21          5 km s21        cedures for line AMG95-1 are described earlier in
                                                                   this paper.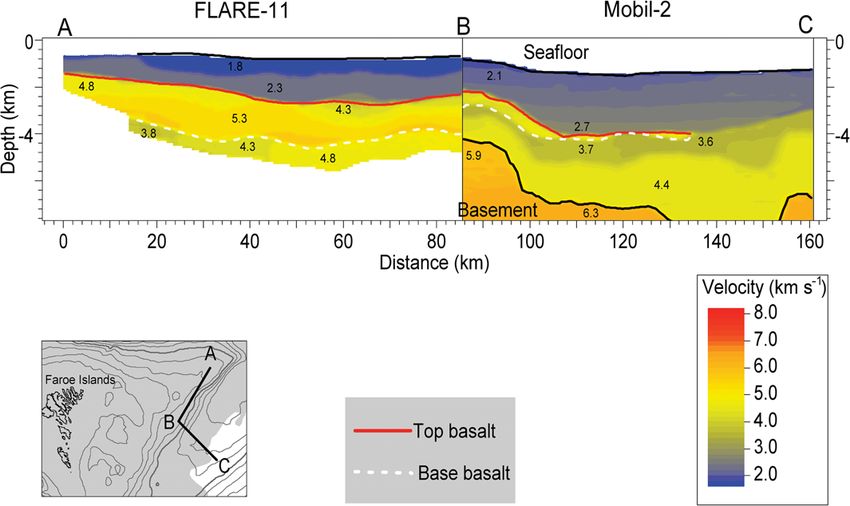
Downloaded from http://sp.lyellcollection.org/ by guest on December 29, 2021

                         VELOCITY MODELS IN THE FAROE–SHETLAND CHANNEL

Fig. 5. Comparison of P-wave velocity models of lines AMP-D and AMG95-1. (a) & (b) show different depth
scales. Annotated velocities are given in km s21. The map in the lower left-hand corner shows the location of the
composite profile. The shaded area shows the basalt cover.

    A comparison of the model features of the                       sub-basalt sediments, line AMP-D shows a second
two lines is given in Table 6. The velocity models                  continuous basalt layer within these sediments.
indicate a less than 0.3 km thin basalt layer at                    However, both models use similar velocities for the
the intersection. Despite this agreement, there are                 sub-basalt sediments of 3.95–4.70 km s21 on line
distinct differences in the underlying units. While                 AMP-D and 3.7–4.7 km s21 on line AMG95-1.
line AMG95-1 displays several intrusions into the                   There is a 1.5 km misfit in the depth to basement.

                    Table 6. Comparison of features of the velocity models at the intersection of
                    lines AMP-D and AMG95-1

                                                                     AMP-D               AMG95-1

                    Moho                                       20.8 km                16.8 km
                    Crystalline basement                       7 km                   8.5 km
                    Basalt thickness (upper)                   0.3 km                 0.1 km
                    Basalt velocity                            4.6– 5.3 km s21        5 –5.5 km s21
                    Sub-basalt sediment thickness              3.9 km                 5.9 km
                    Sub-basalt sediment velocities             3.95– 4.70 km s21      3.7– 4.7 km s21*

                    *Not including velocities of sills in the sub-basalt section.
Downloaded from http://sp.lyellcollection.org/ by guest on December 29, 2021
U. K. PETERSEN & T. FUNCK
Table 7. Comparison of features of the velocity models at the
intersection of lines AMP-D and FLARE-1
AMP-D FLARE-1
Moho 21 km 21 km
Crystalline basement 7.1 km 6.0 km*
Basalt thickness 0.3 km 1 km
Basalt velocity 4.70 km s21 5.25 km s21
Sub-basalt sediment thickness 4.0 km 3.3 km
Sub-basalt sediment velocities 4.0– 4.6 km s21 3.75–4.00 km s21
*Seismic basement.
At the Moho level, the deviation between the two Suðuroy (Fig. 1). The modelling procedures for
lines is 4 km, a misfit that could be reconciled lines AMP-D and FLARE-1 were described earlier.
with a Moho uncertainty of 2 km on either line. At the intersection of lines AMD-D and FLARE-
1, basalts of line AMP-D are 0.3 km thick, while
they are 1 km on line FLARE-1 (Table 7; Fig. 6).
Comparison of lines AMP-D and FLARE-1
The basement of line FLARE-1 is 1.1 km shallower
Line AMP-D in the Faroe –Shetland Channel also than on line AMP-D. The discrepancy is, again,
crosses line FLARE-1, which extends towards related to the fact that line FLARE-1 shows the
Fig. 6. Comparison of P-wave velocity models of lines FOERBAS and AMP-D–FLARE-1. (a) & (b) show
different depth scales. Annotated velocities are given in km s21. The map in the lower left-hand corner shows the
location of the composite profile. The shaded area shows the basalt cover.Downloaded from http://sp.lyellcollection.org/ by guest on December 29, 2021
VELOCITY MODELS IN THE FAROE–SHETLAND CHANNEL
depth to seismic basement and not to crystalline The base basalt on line AMG95-1 is up to 1.5 km
basement, as is the case for line AMP-D. Seismic shallower than on lines FLARE-7 and FLARE-8
basement on line FLARE-1 has approximately (Table 8; Fig. 8). Sub-basalt velocities on line
the same depth as the base of the lower basalt FLARE-7 (3.8 km s21) fall within the velocity range
layer on line AMP-D (Fig. 5b), but it is unclear observed on line AMG95-1 (3.2–4.7 km s21). At
whether this correlation has some relevance or if it the intersection of lines FLARE-8 and AMG95-1,
is arbitrary. The sub-basalt sediments of line the sub-basalt velocities do not match (Table 9;
FLARE-1 are modelled as a single-layer, whilst Fig. 8). The model for line FLARE-8 indicates a
line AMP-D has two distinct LVZs beneath basalt rather high velocity of 4.9 km s21, which contrasts
layers. This can also be seen in relation to line with the velocity range of 3.2–4.5 km s21 on line
AMG95-1 in the same area, for which several AMG95-1. Another striking difference is the pres-
thick intrusions are modelled into the sub-basalt ence of sills in the sub-basalt section of line
sediments (Fig. 5). AMG95-1, while no such features are resolved in
the models of lines FLARE-1 and FLARE-8.
Lines Mobil-2 and FLARE-11 have similar
Comparison of lines FLARE-1 to 12 velocities of 4.3 km s21 at the top of the basalt
sequence (Table 10; Fig. 9). However, further
The FLARE survey consists of 12 lines spanning the
below there are substantial differences in the inter-
NW part of the Faroe –Shetland Channel (Fig. 1).
pretation. While the basalts on line FLARE-11 are
From these lines, a composite north –south profile
1.7 km thick, their thickness is only 0.6 km on line
(Fig. 7) was constructed to evaluate the internal con-
Mobil-2. Maximum velocities in the basalts are
sistency of the velocity models.
also higher on line FLARE-11 (5.3 km s21) than
The velocity modelling for lines FLARE-2 –
on line Mobil-2 (4.3 km s21). Interestingly, the
FLARE-12 was performed in the same way as
depth to crystalline basement on line Mobil-2 corre-
described earlier for line FLARE-1 (Latkiewicz &
lates with the base basalt interpretation on line
Kirk 1999; White et al. 1999, 2003; Fliedner &
FLARE-11. Owing to the differences in the velocity
White 2003). The shallow velocity structure was
distribution, it is safe to say that this match is coin-
determined using conventional semblance analysis
cidental as the corresponding reflectors do have dif-
techniques, while stacked seismic records were
ferent travel times on the seismic record.
used to interpret the top of the basalt. Forward and
inverse modelling were employed to determine the
velocities of deeper structures. The top of the seis-
mic basement interface was mapped by wide-angle Discussion
reflections, which also provided constraints on the
The comparisons given above show that the veloc-
sub-basalt velocities. Basement refractions were
ity models at the intersection of seismic refraction
rarely observed owing to the limited shot-receiver
lines match reasonably well down to and into the
distance of no more than 38 km. For this reason,
uppermost basalts. The inconsistency at deeper lev-
basement velocities are generally unconstrained
els is largely related to difficulties in determining
(Latkiewicz & Kirk 1999; White et al. 1999, 2003;
the base of the basalts and the velocities in the sub-
Fliedner & White 2003).
basalt sediments that, in most cases, represent a
The composite line shows that the depth to top
LVZ. While seismic refraction modelling is often
basalt and base basalt is consistent at all intersec-
presented as an alternative to seismic reflection
tions (Fig. 7). Velocities in the basalts are consistent
imaging of sub-basalts (Hughes et al. 1998; Rich-
in most cases, while there are generally larger differ-
ardson et al. 1999; Fliedner & White 2003; White
ences in the sub-basalt velocities – with the largest
et al. 2003; Klingelhöfer et al. 2005; Raum et al.
difference of 1.2 km s21 occurring at the intersec-
2005; Makris et al. 2009), the method clearly has
tion of lines FLARE-8 and FLARE-1.
problems of its own regarding this matter. These
difficulties relate to the imaging and interpretation
Comparison of the FLARE survey with lines of thick basalts, and to the lack of refractions within
AMG95-1 and Mobil-2 the sub-basalt sediments due to their character as a
LVZ. Lau et al. (2010) stated that the discrimination
As there is a rather dense grid of seismic refraction between the basalt sequence and the underlying
lines in the Faroe –Shetland Channel, there are a few geology remains the most critical seismic imaging
more line intersections to investigate. Here, the problem in the Faroe –Shetland Channel.
intersections of the FLARE survey with the two In some models, the offset range of the refracted
lines AMG95-1 (Fig. 8) and Mobil-2 (Fig. 9) are basalt phase is used as a measure for the basalt
presented. A description of the modelling proce- thickness (e.g. line Mobil-1: Hughes et al. 1998).
dures was given earlier. Sometimes a base basalt reflection can be identifiedDownloaded from http://sp.lyellcollection.org/ by guest on December 29, 2021
U. K. PETERSEN & T. FUNCK
Fig. 7. The composite FLARE P-wave velocity model consists of sections from all 12 of the profiles, with the location and depth of the Brugdan well annotated. The white
marker on the map shows the location of the Brugdan well. Annotated velocities are given in km s21. The map in the lower left-hand corner shows the location of the
composite profile. The shaded area shows the basalt cover.Downloaded from http://sp.lyellcollection.org/ by guest on December 29, 2021
VELOCITY MODELS IN THE FAROE–SHETLAND CHANNEL
Fig. 8. Comparison of P-wave velocity models of lines FLARE-7, AMG95-1 and FLARE-8. Annotated velocities
are given in km s21. The map in the lower left-hand corner shows the location of the composite profile. The shaded
area shows the basalt cover.
Fig. 9. Comparison of P-wave velocity models of lines FLARE-11 and Mobil-2. Annotated velocities are given in
km s21. The map in the lower left-hand corner shows the location of the composite profile. The shaded area shows
the basalt cover.Downloaded from http://sp.lyellcollection.org/ by guest on December 29, 2021
U. K. PETERSEN & T. FUNCK
Table 8. Comparison of features of the velocity models at the
intersection of lines AMG95-1 and FLARE-7
Flare-7 AMG95-1
Basalt thickness 1.4 km 0.3 km
Basalt velocity 4.25– 5.20 km s21 5.2 km s21
Sub-basalt sediment velocities 3.8 km s21 3.2– 4.7 km s21
Table 9. Comparison of features of the velocity models at the
intersection of lines FLARE-8 and AMG95-1
AMG95-1 FLARE-8
Basalt thickness 1.3 km 2.8 km
Basalt velocity 4.8 – 5.5 km s21 5.00– 5.25 km s21
Sub-basalt sediment velocities 3.2 – 4.5 km s21 4.9 km s21
(e.g. line FLARE-1: Richardson et al. 1999) or inter- The Lopra-1 well (Christie et al. 2006) is a case
pretations on stacked reflection seismic data are where, at the transition from subaerial flows to
used to infer the basalt thickness (e.g. the FLARE hyaloclastites, the seismic response changes signifi-
survey: Fliedner & White 2003). However, a strong cantly towards lower amplitudes. Even subaerial
intra-basalt reflector (cf. Fig. 2) resulting from, for basalt formations can display significant differences
example, an interbedded sedimentary layer poses a in seismic facies (Petersen et al. 2006, 2015).
problem for all of these methods. First, the intra- The problem of determining base basalt in the
basalt reflector can affect the maximum range of absence of a base basalt reflector was illustrated
the refraction in the basalts. This, in turn, can result by Varming et al. (2012), who showed a seismic
in wrong estimates of the total basalt thickness. reflection profile that connects two wells (6005/
Second, the reflection from the intra-basalt reflector 15-1 and 6005/13-1) displaced about 20 km from
can be misinterpreted as a reflection from base- each other. While the one well encountered 30 m
basalt. Third, a well-defined reflection from an intra- of basaltic lava flows and 55 m of volcaniclastic
basalt reflector, in combination with a change in sandstone–siltstone, the other well terminated
seismic facies, can potentially be misinterpreted as within the volcanic section after encountering a
the base of the basalt on stacked seismic reflection 1475 m-thick series of basaltic lavas and hyaloclas-
data (Petersen 2014). tites. However, the seismic profile connecting the
Such seismic facies changes are observed in two wells did not show a traceable seismic horizon
a number of settings at volcanic margins. Differ- that could represent this significant change in basalt
ences in seismic facies for seawards-dipping reflec- thickness.
tors (SDRs), hyaloclastites and flow-foot breccia One example of where the total basalt thick-
sequences are shown in Spitzer et al. (2008). Planke ness could not be determined from seismic data is
et al. (2000) presented an extensive study of seis- the Brugdan well in the Faroe–Shetland Channel
mic volcanostratigraphy, in which they distinguish (Fig. 1). Here base basalt was drilled at 3745 m,
various facies such as landward flows, lava delta, while prior to drilling the base of the basalt was pre-
inner flows, inner SDRs, outer high and outer SDRs. dicted at a depth of 2280 m (Øregaard et al. 2007).
Table 10. Comparison of features of the velocity models at the intersection of
lines Mobil-2 and FLARE-11
Mobil-2 FLARE-11
Basalt thickness 0.6 km 1.7 km
Basalt velocity 4.3 km s21 4.3 – 5.3 km s21
Base basalt – crystalline basement velocity 3.6– 4.4 km s21 4.8 km s21Downloaded from http://sp.lyellcollection.org/ by guest on December 29, 2021
VELOCITY MODELS IN THE FAROE–SHETLAND CHANNEL
It is not clear on what this prognosis was based, but
it was most likely to have been on the interpretation
of seismic reflection data. Line FLARE-6 (Fliedner
& White 2003) intersects the Brugdan well (Fig. 7).
At this location, the modelled depth of base basalt is
about 2800 m, which is 945 m less than what was
found in the well. The reason for this mismatch
may relate to effects from hyaloclastites. From
2542 m down to the base of the volcanic succession,
the lithology in the Brugdan well is dominated by
hyaloclastites interbedded with basalt and volcani-
clastic sediments (Øregaard et al. 2007).
The comparison of interval velocities from VSP
and velocity log shows consistency with the velocity
model of line FLARE-6 (Fig. 10), although post-
basalt sediment velocities are too high and, subse-
quently, the top basalt is about 200 m too deep. At
2800 m, line FLARE-6 models base basalt with a
velocity inversion that reaches its minimum of
4.25 km s21 at a depth of 2880 m. If correcting the
depth of the modelled velocities according to the
discrepancy of the top basalt, the depth of the veloc-
ity inversion on line FLARE-6 matches the depth of
a velocity inversion actually seen at the top of a
200 m-thick hyaloclastics section in the velocity
log at 2686 m. Figure 10 also shows that there is a
correlation between the sub-basalt section of the
model and the hyaloclastites in the well.
None of the intersecting lines show consistency
between different surveys, while intersecting lines
within the same survey are fairly consistent, as seen
on the FLARE composite profile (Fig. 7). In rela-
tion to this, it should be mentioned that the
modelling of line iSIMM utilizes the intersecting
line FLARE-11 as a constraint (Spitzer & White
2005). This is why the iSIMM profile is consistent
with the results of line FLARE-11. All other inter-
secting lines with regard to different surveys show
differences in basalt thickness, depth to crystalline
basement, and in velocities and internal structure
of the sub-basalt sediments. The Moho, however,
is consistent at the intersection of lines Mobil-2
and iSIMM (Fig. 3), as well as at the intersection
of lines AMP-D and FLARE-1 (Fig. 6).
The velocity models of the sub-basalt sediments
SE of the Faroes display large lateral variations. The
models for lines FAST and FLARE-1 show a transi- Fig. 10. Comparison of velocities from the Brugdan well
tion from low sub-basalt velocities (,4.6 km s21) with a modelled velocities extract from line FLARE-6 at
to higher sub-basalt velocities (.5.7 km s21) the location of Brugdan well (Fig. 7). Stratigraphy from
when approaching the Faroes (Fig. 4). The change the well completion report (Øregaard et al. 2007) is
in velocity is interpreted as relating to the landwards inserted to the right. Log, interval velocities based on
termination of the sub-basalt sediments against a travel times from velocity logs taken at 5 m intervals;
VSP, interval velocities based on VSP travel times taken
basement high or may represent a zone with intru-
at 60 m intervals; FLARE-6, velocities extract from line
sions (Richardson et al. 1999). In contrast, the sub- FLARE-6 at the location of the Brugdan well; TB well,
basalt sediments on line AMG95-1 continue as a top basalt from composite well logs; TB FLARE-6, top
LVZ all the way to the Faroes (Fig. 4). basalt from line FLARE-6 at the well location; BB
There also seems to be some correlation between FLARE-6 base basalt from line FLARE-6 at the well
the basalt thickness and whether or not the seismic location; BB well, base basalt from composite well logs.Downloaded from http://sp.lyellcollection.org/ by guest on December 29, 2021
U. K. PETERSEN & T. FUNCK
line extends beyond the basalt cover in the Faroe – 2011; Hopper et al. 2014; Funck et al. 2016).
Shetland Channel. In general, the thickness of the Knowledge from available wells that drilled basalts
basalts tends to be less on lines that reach into the in the Faroe– Shetland Channel should be inte-
eastern part of the channel with no basalts (lines grated. In particular, the Brugdan (6104/21-1), Wil-
Mobil-1, Mobil-2 and AMG95-1) than on profiles liam (6005/13-1) and Anne-Marie (6004/8a-1)
that are restricted to the basalt-covered area (line wells (Fig. 1) are of importance as they were drilled
AMG95-2 and most of the lines from the FLARE in areas with significant basalt cover. The Brugdan
survey). well intersects the FLARE-6 profile and can, as
The largest difference of Moho depth is at the such, be directly fed into the modelling of the seis-
AMG95-1–FAST intersection, with a difference mic refraction data, while the William and Anne-
of 11.7 km. Although the intersection is at a location Marie wells are not located on seismic refraction
where neither line has constraints from PmP reflec- lines. However, the two latter wells can help to
tions, both lines have a constraint within 20 km of improve the understanding of the seismic facies
the intersection. Notice, however, that for line in different types of basalts, and thereby aid the
FAST the seismic refraction data are from unre- interpretation of basalt sequences on seismic reflec-
versed ray coverage, recorded on land stations tion lines in the vicinity of the Faroe Islands. A
with a significant offset to the shot line. reinterpretation of the basalts and other regional
The profile with the best seismic constraints structures would put significant constraints on a
on the Moho depth is the iSIMM line. This is pri- remodelling of all seismic refraction datasets, in
marily due to the line location across the Fugloy addition to the required consistency at all line
Ridge with significant offsets to either side of the intersections.
ridge. To the NW, the line extends into oceanic
crust, while the thinned continental crust of the We acknowledge the support of the industry sponsors
(in alphabetical order): Bayerngas Norge AS; BP Explo-
Faroe– Shetland Channel is encountered in the SE. ration Operating Company Ltd; Bundesanstalt für Geo-
This line geometry, together with the use of large wissenschaften und Rohstoffe (BGR); Chevron East
airgun sources tuned to produce low-frequency Greenland Exploration A/S; ConocoPhillips Skandinavia
energy, resulted in a good coverage with PmP reflec- AS; DEA Norge AS; Det norske oljeselskap ASA;
tions along the entire length of the profile. DONG E&P A/S; E.ON Norge AS; ExxonMobil Explo-
Only for line AMG95-1 are upper-mantle veloc- ration and Production Norway AS; Japan Oil, Gas and
ities (8.0–8.3 km s21) constrained by Pn observa- Metals National Corporation (JOGMEC); Maersk Oil;
tions. For Mobil-1 and Mobil-2, the upper-mantle Nalcor Energy – Oil and Gas Inc.; Nexen Energy ULC;
Norwegian Energy Company ASA (Noreco); Repsol
velocity (8.0 km s21) appears to be from Pn obser-
Exploration Norge AS; Statoil (UK) Ltd; and Wintershall
vations, although this is not clearly stated, while Holding GmBH.
for lines FLARE-1 and FAST it is assigned at
7.8 km s21 and for line AMG95-2 at 8.1 km s21
without constraint from Pn observations. References
All models presented here consider uncertainty á Horni, J., Geissler, W. et al. 2014. Offshore volcanic
bounds to some degree. Even though uncertainties facies. In: Hopper, J.R., Funck, T., Stoker, M.,
are often related to the accuracy of the observed A´ rting, U., Peron-Pinvidic, G., Doornenbal, H.
travel times, it is not at all a trivial task to quantify & Gaina, C. (eds) Tectonostraticgraphic Atlas of the
the velocity and depth uncertainties of a multilayer North-East Atlantic Region. Geological Survey of
model. Looking at some of the models from the Denmark and Greenland (GEUS), Copenhagen, Den-
Faroe– Shetland Channel, Raum et al. (2005) and mark, 235–253.
Makris et al. (2009) gave a general estimate on the Christie, P.A.F., Gollifer, I.D. & Cowper, D. 2006.
Borehole seismic studies of a volcanic succesion
uncertainties for the entire model, while Richardson from the Lopra-1/1A borehole in the Faroe Islands,
et al. (1999) presented uncertainty estimates only northern North Atlantic. In: Chalmers, J.A. & Waag-
down to the base of the LVZ. Similarly, Roberts stein, R. (eds) Scientific results from the deepened
et al. (2009) concentrated their uncertainty analysis Lopra-1 borehole, Faroe Islands. Geological Survey
on the LVZ and the depth to the Moho. Klingelhöfer of Denmark and Greenland Bulletin, 9, 23–40.
et al. (2005) provided uncertainty estimates for a Eccles, J.D., White, R.S., Roberts, A.W., Christie,
number of interfaces, including the Moho. P.A.F. & THE ISIMM TEAM. 2007. Wide angle con-
verted shear wave analysis of a North Atlantic volcanic
rifted continental margin: constraint on sub-basalt
Conclusion lithology. First Break, 25, 63– 70, http://doi.org/10.
3997/1365-2397.2007026
The inconsistencies of the velocity models in the Fliedner, M.M. & White, R.S. 2001. Sub-basalt imaging
Faroe– Shetland Channel call for a remodelling of in the Faeroe– Shetland Basin with large-offset data.
the seismic data guided and constrained by the latest First Break, 19, 247– 252, http://doi.org/10.1046/j.
geological models for the area (e.g. Ritchie et al. 0263-5046.2001.00156.xDownloaded from http://sp.lyellcollection.org/ by guest on December 29, 2021
VELOCITY MODELS IN THE FAROE–SHETLAND CHANNEL
Fliedner, M.M. & White, R.S. 2003. Depth imaging of Latkiewicz, C.B. & Kirk, W.J. 1999. Report: F.L.A.R.E.,
basalt flows in the Faeroe–Shetland Basin. Geophysi- Faroes Large Aperture Research Experiment. Amer-
cal Journal International, 152, 353–371, http://doi. ada Hess Ltd, Aberdeen.
org/10.1046/j.1365-246X.2003.01833.x Lau, K.W.H., White, R.S. & Christie, P.A.F. 2010. Inte-
Fruehn, J., Fliedner, M.M. & White, R.S. 2001. grating streamer and ocean-bottom seismic data for
Integrated wide-angle and near-vertical subbasalt sub-basalt imaging on the Atlantic Margin. Petroleum
study using large-aperture seismic data from the Geoscience, 16, 349 –366, http://doi.org/10.1144/
Faeroe–Shetland region. Geophysics, 66, 1340– 1354-0793/10-023
1348, http://doi.org/10.1190/1.1487079 Makris, J., Papoulia, I. & Ziska, H. 2009. Crustal struc-
Funck, T., Hopper, J.R. et al. 2014. Crustal structure. ture of the Shetland– Faeroe Basin from long offset
In: Hopper, J.R., Funck, T., Stoker, M., A ´ rting, seismic data. In: Varming, T. & Ziska, H. (eds)
U., Peron-Pinvidic, G., Doornenbal, H. & Gaina, Faroe Island Exploration Conference: Proceedings
C. (eds) Tectonostratigraphic Atlas of the North- of the 2nd Conference. Annales Societatis Scientiarum
East Atlantic Region. Geological Survey of Den- Færoensis, Tórshavn, Faroe Islands, Supplementum,
mark and Greenland (GEUS), Copenhagen, Denmark, 50, 30– 42.
69– 126. Maresh, J., White, R.S., Hobbs, R.W. & Smallwood,
Funck, T., Geissler, W.H., Kimbell, G.S., Gradmann, J.R. 2006. Seismic attenuation of Atlantic margin
S., Erlendsson, Ö., McDermott, K. & Petersen, basalts: observations and modeling. Geophysics, 71,
U.K. 2016. Moho and basement depth in the NE B211–B221, http://doi.org/10.1190/1.2335875
Atlantic Ocean based on seismic refraction data and Neish, J.K. 2004. Faroese area: structural interpretation
receiver functions. In: Péron-Pinvidic, G., Hopper, of seismic data in a basalt environment. In: Varming,
J.R., Stoker, M.S., Gain, C., Doornenbal, J.C., T. & Ziska, H. (eds) Faroe Islands Exploration Con-
Funck, T. & A ´ rting, U.E. (eds) The NE Atlantic ference: Proceedings of the 1st Conference. Annales
Region: A Reappraisal of Crustal Structure, Tecto- Societatis Scientiarum Færoensis, Tórshavn, Faroe
nostratigraphy and Magmatic Evolution. Geological Islands, Supplementum, 43, 131–145.
Society, London, Special Publications, 447. First pub- Øregaard, J., Roksvaag, P., Kirkemo, E.G., Lefdal, F.,
lished online July 13, 2016, http://doi.org/10.1144/ Hunnes, O., Flatebø, T. & Haugen, J.E. 2007. Final
SP447.1. Well Report. Well FO 6104/21-1. Licence No. 006.
Hopper, J.R. & Gaina, C. 2014. Bathymetry and eleva- Brugdan: Statoil.
tion. In: Hopper, J.R., Funck, T., Stoker, M., Palmason, G. 1965. Seismic refraction measurements
A´ rting, U., Peron-Pinvidic, G., Doornenbal, H. of basalt Lavas of Faeroe Islands. Tectonophysics, 2,
& Gaina, C. (eds) Tectonostraticgraphic Atlas of the 475– 482, http://doi.org/10.1016/0040-1951(65)900
North-East Atlantic Region. Geological Survey of 02-8
Denmark and Greenland (GEUS), Copehagen, Den- Petersen, U.K. 2014. Propagation and scattering of
mark, 23– 28. reflection seismic waves in a basalt succession. PhD
Hopper, J.R., Funck, T., Stoker, M.S., A ´ rting, U., thesis, University of the Faroe Islands, Tórshavn,
Peron-Pinvidic, G., Doornenbal, H. & Gain, C. http://doi.org/10.13140/RG.2.1.1133.1927
(eds) 2014. Tectonostratigraphic Atlas of the North- Petersen, U.K., Andersen, M.S. & White, R.S. 2006.
East Atlantic Region. Geological Survey of Denmark Seismic imaging of basalts at Glyvursnes, Faroe
and Greenland, Copehagen, Denmark. Islands: hunting for future exploration methods in
Hughes, S., Barton, P.J. & Harrison, D. 1998. Explo- basalt covered areas. First Break, 24, 45–52, http://
ration in the Shetland–Faeroe Basin using densely doi.org/10.3997/1365-2397.2006006
spaced arrays of ocean-bottom seismometers. Geo- Petersen, U.K., Andersen, M.S. & Brown, R.J. 2015.
physics, 63, 490–501, http://doi.org/10.1190/1. Geophysical aspects of basalt geology and identifica-
1444350 tion of intrabasaltic horizons. In: Eidesgaard, Ó. &
Kiørboe, L. & Petersen, S.A. 1995. Seismic inves- Ziska, H. (eds) Faroe Islands Exploration Conference:
tigation of the Faeroe basalts and their substra- Proceedings of the 4th Conference. Annales Societatis
tum. In: Scrutton, R.A., Shimmield, G.B. & Scientiarum Færoensis, Tórshavn, Faroe Islands, Sup-
Tudhope, A.W. (eds) The Tectonics, Sedimentation plementum, 64, 76–93, http://doi.org/10.13140/RG.
and Palaeoceanography of the North Atlantic Region. 2.1.2387.9765
Geological Society, London, Special Publications, 90, Planke, S., Symonds, P.A., Alvestad, E. & Skogseid, J.
111–122, http://doi.org/10.1144/GSL.SP.1995.090. 2000. Seismic volcanostratigraphy of large-volume
01.06 basaltic extrusive complexes on rifted margins.
Klingelhöfer, F., Edwards, R.A. & Hobbs, R.W. 2005. Journal of Geophysical Research, 105, 19,335–
Crustal structure of the NE Rockall Trough from 19,351.
wide-angle seismic data modeling. Journal of Geo- Raum, T., Mjelde, A.M. et al. 2005. Sub-basalt structures
physical Research, 110, B11105, http://doi.org/10. east of the Faroe Islands revealed from wide-angle seis-
1029/2005JB003763 mic and gravity data. Petroleum Geoscience, 11, 291–
Larsen, L.M., Waagstein, R., Pedersen, A.K. & 308, http://doi.org/10.1144/1354-079304-627
Storey, M. 1999. Trans-Atlantic correlation of the Richardson, K.R., Smallwood, J.R., White, R.S.,
Palaeogene volcanic successions in the Faeroe Islands Snyder, D.B. & Maguire, P.K.H. 1998. Crustal struc-
and East Greenland. Journal of the Geological Society, ture beneath the Faroe Islands and the Faroe– Iceland
London, 156, 1081– 1095, http://doi.org/10.1144/ Ridge. Tectonophysics, 300, 159–180, http://doi.
gsjgs.156.6.1081 org/10.1016/S0040-1951(98)00239-XDownloaded from http://sp.lyellcollection.org/ by guest on December 29, 2021
U. K. PETERSEN & T. FUNCK
Richardson, K.R., White, R.S., England, R.W. & Varming, T., Ziska, H. & O ´ lavsdóttir, J. 2012.
Fruehn, J. 1999. Crustal structure east of the Faroe Exploring for hydrocarbons in a volcanic province –
Islands: mapping sub-basalt sediments using wide- a review of exploration on the Faroese Continen-
angle seismic data. Petroleum Geoscience, 5, 161–172, tal Shelf. In: Varming, T. & Ziska, H. (eds) Faroe
http://doi.org/10.1144/petgeo.5.2.161 Island Exploration Conference: Proceedings of the
Ritchie, J.D., Ziska, H., Johnson, H. & Evans, D. 3rd Conference. Annales Societatis Scientiarum Fær-
(eds) 2011. Geology of the Faroe–Shetland Basin and oensis, Tórshavn, Faroe Islands, Supplementum, 56,
Adjacent Areas. British Geological Survey, Nothingham. 84–106.
Roberts, A.W., White, R.S. & Christie, P.A.F. 2009. White, R.S., Fruehn, J., Richardson, K.R., Cullen, E.,
Imaging igneous rocks on the North Atlantic rifted Kirk, W., Smallwood, J.R. & Latkiewicz, C.
continental margin. Geophysical Journal Interna- 1999. Faeroes Large Aperture Research Experiment
tional, 179, 1024–1038, http://doi.org/10.1111/j. (FLARE): imaging through basalt. In: Fleet, A.J. &
1365-246X.2009.04306.x Boldy, S.A.R. (eds) Petroleum Geology of Northwest
Spitzer, R. & White, R.S. 2005. Advances in seismic Europe: Proceedings of the 5th Conference. Geologi-
imaging through basalts: a case study from the Faroe- cal Society, London, 1243–1252, http://doi.org/10.
Shetland Basin. Petroleum Geoscience, 11, 147–156, 1144/0051243
http://doi.org/10.1144/1354-079304-639 White, R.S., Smallwood, J.R., Fliedner, M.M.,
Spitzer, R., White, R.S. & Christie, P.A.F. 2008. Seis- Boslaugh, B., Maresh, J. & Fruehn, J. 2003. Imag-
mic characterization of basalt flows from the Faroes ing and regional distribution of basalt flows in the
margin and the Faroe–Shetland basin. Geophysical Faeroe–Shetland Basin. Geophysical Prospecting,
Prospecting, 56, 21–31, http://doi.org/10.1111/j. 51, 215– 231, http://doi.org/10.1046/j.1365-2478.
1365-2478.2007.00666.x 2003.00364.xYou can also read