Rhodes Economic Viability Study Update Billbergia Design Pty Ltd - PREPARED FOR February 2014 - User Name ...
←
→
Page content transcription
If your browser does not render page correctly, please read the page content below
Rhodes Economic Viability Study Update

PREPARED FOR

Billbergia Design Pty Ltd
February 2014

ABN 52 003 963 755

Sydney
Level 3, 234 George Street
Sydney NSW 2000
GPO Box 2748 Sydney NSW 2001
t. +61 2 9252 8777
f. +61 2 9252 6077
e. sydney@hillpda.com

Melbourne
Suite 114, 838 Collins Street
Docklands VIC 3008
GPO Box 3424 Melbourne VIC 3001
t. +61 3 9629 1842
f. +61 3 9629 6315
e. melbourne@hillpda.com
www.hillpda.com

Liability limited by a scheme approved under the Professional Standards Legislation

QUALITY ASSURANCE

REPORT CONTACT:

Tom Duncan
Associate
MA Prop Dev (candidate), MA Town and Country Planning, BA (Hons), MRTPI
Email: thomas.duncan@hillpda.com

QUALITY CONTROL:

This document is for discussion purposes only unless signed and dated by a Principal of Hill PDA.

REVIEWED BY:

                                              Dated February 2014

Adrian Hack
Principal
M. Land Econ.B.Town Planning (Hons). MPIA
Email: adrian.hack@hillpda.com

REPORT DETAILS:

Job Ref No: C14107
Version:      Final
Date Printed: 3/03/2014 10:05:00 AM
File Name: C14107 - Rhodes Updated Retail Viability Study F28.02.14.docx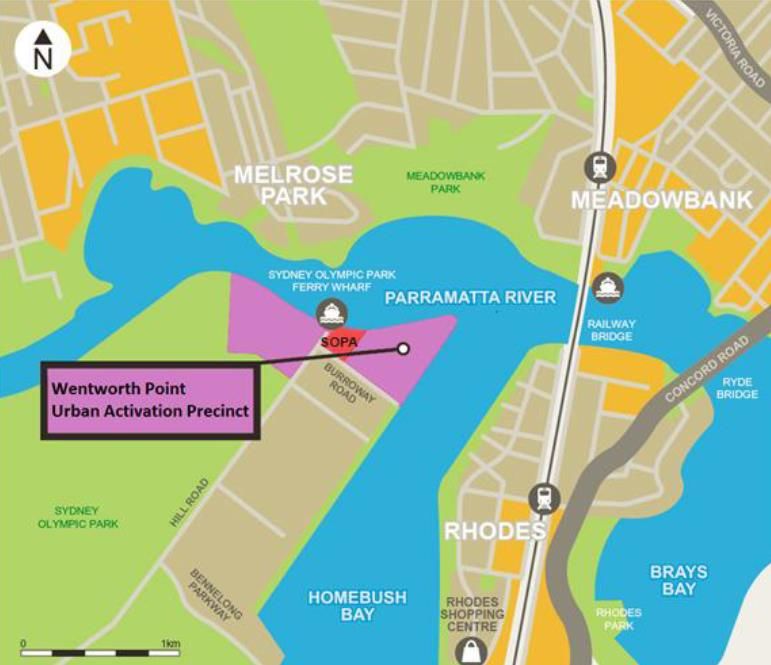
Rhodes Economic Viability Study Update

                                                                        CONTENTS
     1.       INTRODUCTION....................................................................................................................... 7
              1.1      Background ............................................................................................................................ 7
              1.2      The Brief ................................................................................................................................. 8
              1.3      Study Structure....................................................................................................................... 8
     2.       DEVELOPMENT SCHEME ....................................................................................................... 10
              2.1      The Proposed Development................................................................................................. 10
              2.2      Development Staging ........................................................................................................... 10
     3.       CONTEXTUAL REVIEW .......................................................................................................... 13
              3.1      Draft Metropolitan Strategy for Sydney to 2031 ................................................................... 13
              3.2      City of Canada Bay LEP....................................................................................................... 14
              3.3      Wentworth Point UAP........................................................................................................... 14
              3.4      Homebush Bay Bridge ......................................................................................................... 15
              3.5      Retail Development .............................................................................................................. 16
     4.       ECONOMIC AND DEMOGRAPHIC CONTEXT .............................................................................. 17
              4.1      Historic and Existing Demographics ..................................................................................... 17
              4.2      Projected Demographics ...................................................................................................... 22
              4.3      Conclusions .......................................................................................................................... 23
     5.       RETAIL VIABILITY AND IMPACT ASSESSMENT ......................................................................... 24
              5.1      Trade Area ........................................................................................................................... 24
              5.2      Sources of Retail Expenditure .............................................................................................. 25
              5.3      Demand Growth ................................................................................................................... 26
              5.4      Demand for Shopfront Floorspace ....................................................................................... 28
              5.5      Retail Impact Assessment .................................................................................................... 36
     6.       OFFICE VIABILITY ASSESSMENT ............................................................................................ 37
              6.1      Profile of Selected Centres ................................................................................................... 37
              6.2      Employment Projections....................................................................................................... 38
              6.3      Current Market Activity ......................................................................................................... 39
              6.4      Implications .......................................................................................................................... 41
     7.       HOTEL VIABILITY ASSESSMENT............................................................................................. 43
              7.1      The Economic Contribution of Tourism ................................................................................ 43
              7.2      Existing Hotel Supply ........................................................................................................... 43
              7.3      Contextual Data.................................................................................................................... 44
              7.4      Market Opportunities ............................................................................................................ 44
              7.5      Property Market Activity ....................................................................................................... 45
              7.6      Implications .......................................................................................................................... 46
     8.       COMMUNITY USES ............................................................................................................... 47
              8.1      Community Use Analysis ..................................................................................................... 47
              8.2      Community Facilities in Rhodes ........................................................................................... 48
              8.3      Conclusion............................................................................................................................ 49
     9.       CASE STUDY DEVELOPMENTS .............................................................................................. 50

Ref: C14107                                                         P a g e 4 | 63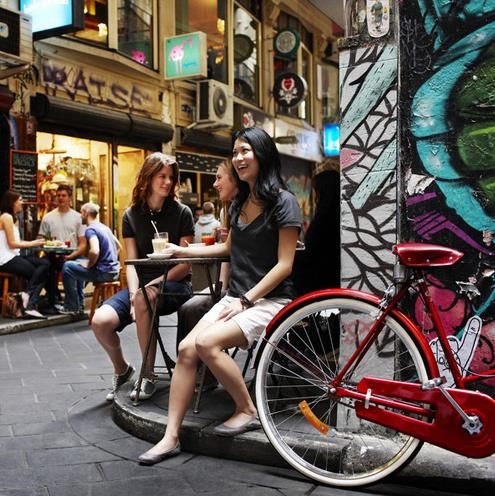
Rhodes Economic Viability Study Update

              9.1      Harold Park .......................................................................................................................... 50
              9.2      Danks Street......................................................................................................................... 51
              9.3      East Village - Victoria Park ................................................................................................... 52
              9.4      Cammeray ............................................................................................................................ 54
              9.5      Bakehouse Quarter .............................................................................................................. 54
              9.6      QV (Queen Victoria) Development ....................................................................................... 55
              9.7      Case Study Implications ....................................................................................................... 57
     10. SUMMARY, CONCLUSIONS AND RECOMMENDATIONS .............................................................. 58
              10.1 Summary and Conclusions .................................................................................................. 58
              10.2 Recommendations ............................................................................................................... 59

                                                                LIST OF FIGURES
     Figure 1 - Precinct D, Rhodes Peninsula ............................................................................................. 7
     Figure 2 - Proposed Development Stages ......................................................................................... 11
     Figure 3 - Ground Floor Concept ....................................................................................................... 11
     Figure 4 - Level 1 Concept ................................................................................................................ 12
     Figure 5 - Level 2 Concept ................................................................................................................ 12
     Figure 6 - Wentworth Point UAP ........................................................................................................ 15
     Figure 7 - Precinct D Retail Trade Area ............................................................................................. 24
     Figure 8 - Worker Travel Zones of Influence to Precinct D ................................................................. 25
     Figure 9 - Images of Selected Commercial Listings in Rhodes, November 2013 ................................ 41
     Figure 10 - Community Facilities in Canada Bay ............................................................................... 47
     Figure 11 - East Village Retail Marketplace ....................................................................................... 53
     Figure 12 - Masterplan Image, Bakehouse Quarter ........................................................................... 55
     Figure 13 - External view of the QV Development.............................................................................. 56
     Figure 14 - Internal Plaza at QV ........................................................................................................ 56

                                                                  LIST OF TABLES
     Table 1 - Population Growth Forecasts for the Trade Area ................................................................ 26
     Table 2 - Worker Growth Forecasts to 2022 ...................................................................................... 27
     Table 3 - Total Retail Expenditure Generated by the Resident Trade Areas to 2022 ($m) .................. 29
     Table 4 - Assumed Capture Rates of Resident Expenditure to Precinct D ......................................... 30
     Table 5 - Assumed Capture of Expenditure by Retail Facilities in Precinct D 2012 to 2022 ($m)........ 32
     Table 6 - Capture of Worker Spend by Precinct D to 2022 ($m)......................................................... 32
     Table 7 - Estimated Retail Expenditure Generated by Tourists to Precinct D ..................................... 33
     Table 8 - Total Forecast Expenditure Available to be Captured by Precinct D ($m) 2012 - 2022 ........ 34
     Table 9 - Benchmark Turnover Rates 2012 to 2022 ($/sqm GLA) ...................................................... 35
     Table 10 - Demand for Retail Floorspace in Precinct D to 2022 (sqm GLA) ....................................... 35

Ref: C14107                                                       P a g e 5 | 63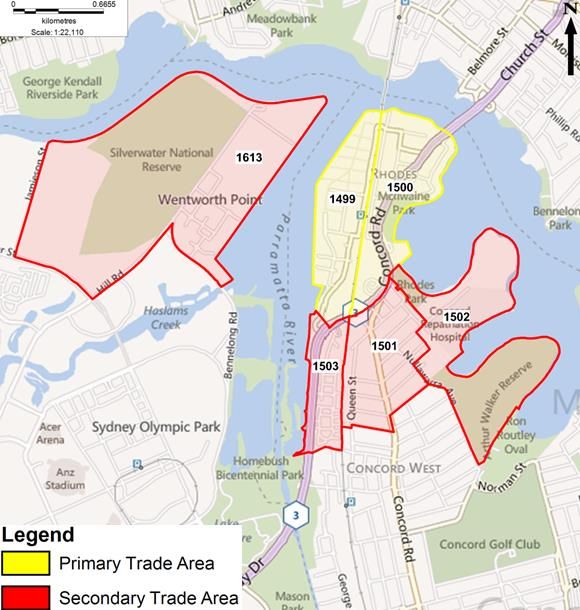
Rhodes Economic Viability Study Update

     Table 11 - Shopping Centre Profile Data ........................................................................................... 38
     Table 12 - Employment and Floorspace Trends and Projections ....................................................... 39
     Table 13 - Reported Commercial Sales in Rhodes, From July 2009 .................................................. 40
     Table 14 - Reported Commercial Listings in Rhodes, November 2013............................................... 40
     Table 15 - Selected Regional Accommodation Data .......................................................................... 44
     Table 16 - Worker and Resident Market Trends and Projections ....................................................... 45
     Table 17 - Hotel / Motel Sales, From July 2009 ................................................................................. 46
     Table 18 - Candidate Facilities and Service for a 15,200 Population.................................................. 48
     Table 19 - East Village – Victoria Park Retail Mix .............................................................................. 52
     Table 20 - Stockland Cammeray Retail Mix ....................................................................................... 54

Ref: C14107                                               P a g e 6 | 63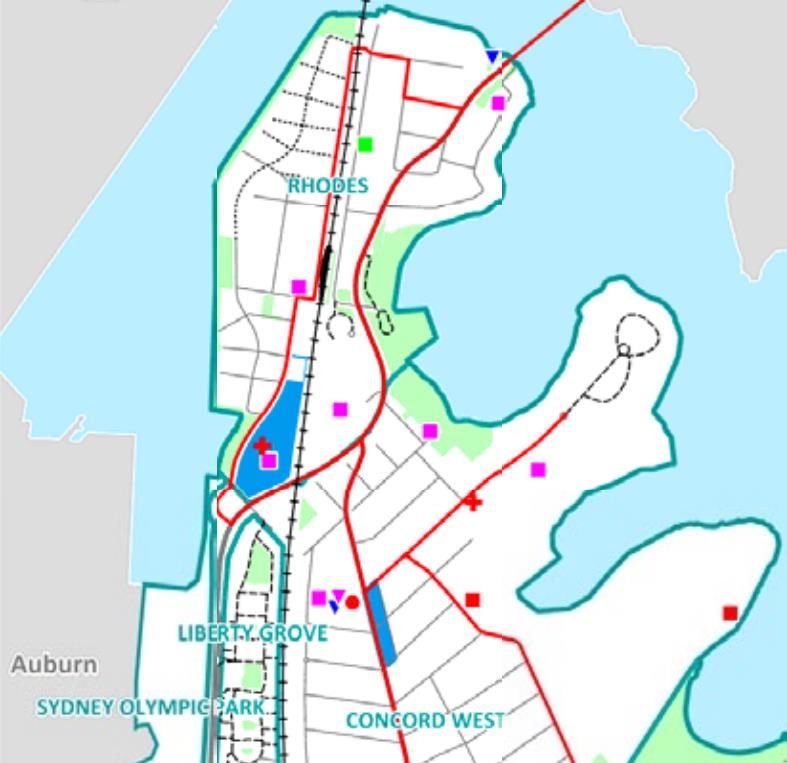
Rhodes Economic Viability Study Update
1. INTRODUCTION
1.1 BACKGROUND
Precinct D in the Rhodes Peninsula comprises land adjacent to Rhodes railway station bounded by Walker, Mary,
Marquet and Gauthorpe Streets. The location of Precinct D is shown in Figure 1 below.
Figure 1 - Precinct D, Rhodes Peninsula
Source: City of Canada Bay (February 2012)
In April 2012 Hill PDA prepared the Rhodes Peninsula Retail Viability Study (the 2012 Study) for the City of
Canada Bay Council (Council) related to Precinct D. At that time a masterplan for the future development of
Precinct D was proposed and Hill PDA was engaged to consider the retail and commercial component of the
masterplan. Specifically, the purpose of the 2012 Study was to:
Consider the viability of the commercial and retail floorspace as proposed by the Concept Plan,
particularly given other retail centres of influence (e.g. Rhodes Waterside Shopping Centre);
Advise on the most appropriate retail and commercial land uses including anchor tenants;
Assess the impact of the proposed Homebush Bay Bridge and other developments in the area on the
viability on proposed land uses in Precinct D;
Ref: C14107 P a g e 7 | 63
Rhodes Economic Viability Study Update
Provide advice on the sustainability of the proposed retail and commercial options over a 2, 5 and 10
year period, given forecast dwellings and expected population growth; and
Provide strategies to ensure future viability of the uses in Precinct D.
The 2012 Study found that there was strong retail demand growth in the area around Precinct D resulting from
ongoing development and on this basis the quantum of retail and commercial floorspace proposed in the
masterplan was supportable. The 2012 Study also found that the trading impact of the masterplan on existing and
planned centres in the area would not jeopardise their vitality or viability. It concluded that:
“The provision of a centre in Precinct D would widen the retail offer for residents and workers in the trade
area and would provide a unique, open air type shopping destination not currently available within the trade
area. In doing so it would provide a different offer to Rhodes Shopping Centre and contribute towards
ensuring Rhodes is desirable place in which to live and work” 1.
1.2 THE BRIEF
Since that 2012 Study Billbergia Design Pty Ltd has prepared a mixed use development scheme for Precinct D
includes residential, retail, commercial office and hotel uses. In light of this scheme an update to the 2012 Study
was requested by Council to reflect the current proposal and consider any changes in retail demand, supply and
impact that may have occurred subsequently. Hill PDA was commissioned by Billbergia Design Pty Ltd to
undertaken the Rhodes Economic Viability Study Update (the Study) in response.
In addition to revising retail demand and impact in the context of the current proposal, the Study is also required to
assess the viability of commercial office uses and hotel uses in this location which were not part of the Precinct D
masterplan.
1.3 STUDY STRUCTURE
The address the requirements of the project brief, the Study is structured in the following manner:
Chapter 2 Development Scheme – A brief overview of the current proposed development scheme for
Precinct D.
Chapter 3 Contextual Review – A review of planning policy documents published subsequent to the
2012 Study, changes in retail supply and infrastructure project delivery commitments.
Chapter 4 Economic and Demographic Context – An overview of economic and demographic contextual
information relating to the Rhodes area.
Chapter 5 Retail Viability and Impact Assessment – The potential for the site to accommodate retail
floorspace by type and configuration is updated and examined in this section. The potential retail impact
of the current proposal is considered.
1Source: Rhodes Peninsula Retail Viability Study, Hill PDA (2012)
Ref: C14107 P a g e 8 | 63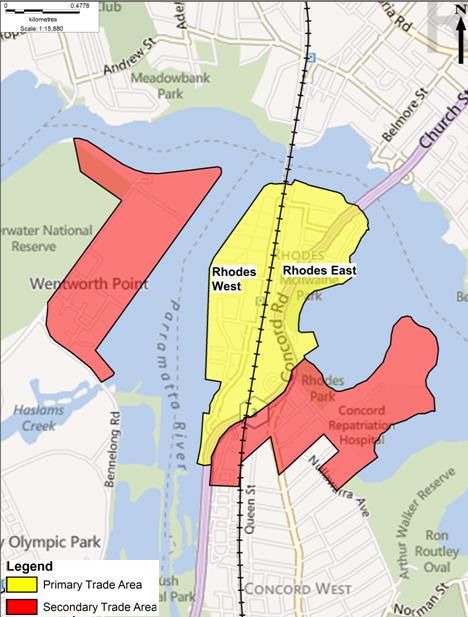
Rhodes Economic Viability Study Update
Chapter 6 Office Viability Assessment – The potential for the site to absorb commercial office activity by
type is examined in this Chapter.
Chapter 7 Hotel Viability Assessment – The market for hotel uses is assessed with a view to identify the
viability of hotel uses for the development site.
Chapter 8 Community Uses – A preliminary consideration of community uses to further explore potential
land use mix possibilities for Precinct D.
Chapter 9 Case Study Developments – A profile of a number of relevant case studies is provided to gain
further insight into key success factors innovative and modern retail precincts.
Chapter 10 Summary, Conclusions and Recommendations – This Chapter presents the findings and
recommendations of the research and analysis.
Ref: C14107 P a g e 9 | 63
Rhodes Economic Viability Study Update
2. DEVELOPMENT SCHEME
This Chapter provides an overview of the proposed development scheme which is assessed in the Study.
2.1 THE PROPOSED DEVELOPMENT
Billbergia Design Pty Ltd has prepared a development scheme for Precinct D that comprises high rise residential
towers, basement car parking and retail, commercial office and hotel uses on lower levels. The overall floorspace
allocation that is proposed is as follows:
Retail: 8,560sqm;
Commercial: 4,039sqm;
Hotel: 5,897sqm;
Leisure Centre 8,481sqm (plus a component of retail floorspace to be confirmed); and
Total 26,977sqm.
The implications of the retail, commercial and hotel floorspace proposed is considered in this Study.
2.2 DEVELOPMENT STAGING
Figure 2 shows the anticipated four-stage development process for the proposed development. Given that the
ultimate timing of the development stages is unknown, consistent with the 2012 Study it has been assumed that
the retail, commercial and hotel uses proposed would be developed and trading by 2014. This is likely to be an
optimistic scenario and therefore our assessment of demand is conservative.
Ref: C14107 P a g e 10 | 63Rhodes Economic Viability Study Update Figure 2 - Proposed Development Stages Source: SJB Architects (2013) The ground floor scheme is shown in Figure 3 below. This comprises a series of laneways that connect Walker Street and the train station to Marquet Street. Small shopfronts would line the laneways and the major retail tenants would be located along Marquet Street to act as anchors on the west side of the site. The major activities on the west side, based on the 2012 Study would be a supermarket, Asian grocery retailer and hotel. The site furtherest to the north (shown on the left hand side of the figure) would comprise community uses, such as leisure centre and childcare facility, with retail along the Walker Street frontage. Figure 3 - Ground Floor Concept Source: SJB Architects (2013) Ref: C14107 P a g e 11 | 63
Rhodes Economic Viability Study Update

The Level 1 concept comprises retail uses, commercial office tenants and a health centre as shown in the figure
below.

Figure 4 - Level 1 Concept

Source: SJB Architects (2013)

The Level 2 concept comprises commercial offices, conference facility space, multi-purpose hall and recreation
uses. Level 3 and above are residential apartment units and hotel floorspace.

Figure 5 - Level 2 Concept

Source: SJB Architects (2013)

Ref: C14107                                 P a g e 12 | 63
Rhodes Economic Viability Study Update
3. CONTEXTUAL REVIEW
Hill PDA’s 2012 Study undertook a comprehensive assessment of relevant planning policy documents. This
Chapter adds to the 2012 Study by considering planning policy guidance which has been published subsequently
and which may impact upon the future potential of the Precinct. It also considers other changes in the local area.
3.1 DRAFT METROPOLITAN STRATEGY FOR SYDNEY TO 2031
The NSW Department of Planning and Infrastructure (DoPI) published the draft Metropolitan Strategy for Sydney
to 2031 (the draft Strategy) for consultation in March 2013. It seeks to achieve the following outcomes:
Balanced growth;
A liveable City;
Productivity and prosperity;
Healthy and resilient environment; and
Accessibility and connectivity.
The draft Strategy seeks to promote and facilitate growth which acknowledges market considerations and which
integrates transport, infrastructure and land use. Job growth will thus be concentrated in Metropolitan areas. An
additional +625,000 new jobs across Sydney by 2031 is targeted and minimum job targets are set across the
Subregions in Sydney to achieve this.
Objective 15 of the draft Strategy seeks to ‘provide for a good supply of retail floorspace’. As part of this process
additional capacity for retail floorspace in all centres where retail assessments demonstrate need should be planned for.
The draft Strategy recognises retail floorspace as a trip generator and attractor which, when combined with other
uses, can create a hub for Subregions. The provision of retail floorspace in locations which are easily accessible
such as on transport nodes is encouraged.
The draft Strategy defines new Subregional boundaries for the Sydney metropolitan area. The City of Canada Bay
is identified as forming part of the Central Subregion. Within this Subregion a minimum of +136,000 additional
jobs are targeted by 2021 and +242,000 by 2031.
The Rhodes Business Park is identified in the draft Strategy as comprising a ‘Specialised Precinct’. The priorities
for this area are:
“support clustering of office-based jobs and medical enterprises associated with Concord Hospital
create a focus for intense commercial and residential activity
provide capacity for at least 2,000 additional jobs by 2031” 2.
2Source: Page 85, Draft Metropolitan Strategy for Sydney to 2031, NSW Department of Planning and Infrastructure (2013)
Ref: C14107 P a g e 13 | 63Rhodes Economic Viability Study Update The draft Strategy provides greater support for a centre at Precinct D in view of its highly accessible location and is supportive of a diversified employment offer. 3.2 CITY OF CANADA BAY LEP The City of Canada Bay Local Environmental Plan (LEP) was gazetted in July 2013. This supersedes the LEP component of the Rhodes West Masterplan Stage One document (2010). Precinct D is subject to a B4 Mixed Use zoning in the LEP and retail uses are permissible with consent. 3.3 WENTWORTH POINT UAP The designation of Urban Activation Precincts (UAPs) was announced by the NSW Premier in March 2013. UAPs are sites which have the ability to deliver a large number of homes in locations which have superior access to jobs, transport and infrastructure. UAP designation seeks to speed up the planning process in these locations and, in so doing, make a sizeable contribution towards meeting Sydney’s future housing needs. Wentworth Point was designated as a UAP due to the potential of the site to deliver new homes in an accessible location, adjacent to public transport services and comprising a former industrial area owned by the NSW Government. Plans for the Wentworth Point UAP include 2,300 new homes, a new park, transport infrastructure and community facilities. The total population of the UAP upon completion is estimated at approximately 5,000 people3 and construction will extend over a 15 year timeframe 4. We understand that retail uses in the Wentworth Point UAP will be ‘small scale’5 and focused around a Maritime Plaza. Small scale cafes may be allowed in other locations within the UAP. The location of the Wentworth Point UAP is shown in the following figure. 3Source: Re: Wentworth Point Urban Activation Precinct, Council of Social Service of New South Wales (2013) 4Source: Wentworth Point Urban Activation Precinct FAQs, NSW Department of Planning and Infrastructure (2013) 5Source: Page 4, Wentworth Point Urban Activation Precinct Proposal, NSW Department of Planning and Infrastructure (2013) Ref: C14107 P a g e 14 | 63
Rhodes Economic Viability Study Update

Figure 6 - Wentworth Point UAP

Source: Wentworth Point Urban Activation Precinct, NSW Department of Planning and Infrastuture (2013)

3.4 HOMEBUSH BAY BRIDGE
The Homebush Bay Bridge which will connect the Rhodes West Peninsula to Wentworth Point was approved by
the DoPI in March 2013 to support the Wentworth Point UAP. It is expected to be completed in 2016 and will be
accessible to buses, pedestrians, cyclist and emergency vehicles but not to private vehicles.

The 2012 Study acknowledged that construction of the bridge would bring Wentworth Point into the Secondary
Trade Area for a centre at Precinct D upon completion.

Ref: C14107                                    P a g e 15 | 63
Rhodes Economic Viability Study Update

3.5 RETAIL DEVELOPMENT
Rhodes Shopping Centre

Subsequent to our 2012 Study, the Rhodes Shopping Centre is in the process of undergoing refurbishment and
modelling to enhance the experience for shoppers and to reflect changing consumer preferences. A new town
square will be developed at the Ryder Street/ Mary Street road junction. This includes a new outdoor focused eat-
street area to serve a local residential and worker catchment 6.

The latest trading data for the Rhodes Shopping Centre indicates that for the October 2012 to September 2013
period the shopping centre achieved a turnover of $176.55m7 (excluding the turnover of IKEA). This represents a
$7.45m or 4% decline from the turnover recorded for the previous year of $184m 8 which may be reflective of the
ongoing refurbishment of the centre and temporary loss of trade resulting to some retailers and the impact of Top
Ryde. The Rhodes Shopping Centre achieved a turnover per square metre of $7,456/sqm for the year to
September 20139 which is above the median of $6,845/sqm for similar sized shopping centres in Australia for the
period (of between 20,000 and 45,000sqm). It is thus a strong performing centre.

Rhodes Peninsula

Ongoing development in the Rhodes Peninsula has seen the development of a number of retail and commercial
premises at ground level since the 2012 Study. Uses provided include restaurants, estate agent/ strata
management premises and a medical centre 10.

The Piazza – Wentworth Point

Since the 2012 Study a small retail precinct as been developed around The Piazza in Wentworth Point. This
serves localised retail demand emerging out of recent residential development in the area and includes
restaurants and cafe floorspace, a dentist, estate agent, dry cleaners, hairdressers, community library and a small
convenience store of 177sqm11.

6Source: Proposed New Town Square, City of Canada Bay Council (August 2013)
7Source: Little Guns, Shopping Centre News (2012)
8Source: Little Guns, Shopping Centre News (2011)

9Source: Little Guns, Shopping Centre News (2012)

10 Source: Data provided by City of Canada Bay Council (2013)

11Source: The Waterfront Wentworth Point (2013)

Ref: C14107                                        P a g e 16 | 63
Rhodes Economic Viability Study Update

4. ECONOMIC AND DEMOGRAPHIC CONTEXT
This Chapter undertakes an analysis of the demographic characteristics of the current and projected future
resident population in the Rhodes Peninsula. This has been undertaken to consider the unique local
characteristics and trends that will influence current and future demand for commercial and retail facilities within
Precinct D.

To undertake this analysis the ‘Rhodes Peninsula’ has been defined as comprising the Rhodes and Liberty Grove
suburbs. This area has been benchmarked against the demographic characteristics for the City of Canada Bay
Local Government Area (LGA) and/ or the Sydney metropolitan area. The data in this Chapter has been derived
from various sources include City of Canada Bay Forecast.id (2013), the ABS (2006 and 2011), the NSW Bureau
of Transport Statistics (2012) and Council.

4.1 HISTORIC AND EXISTING DEMOGRAPHICS
Population and Household Characteristics

 Population
 The population of the Rhodes
 Peninsula accounted for 4% of the                          7,727                      68,036
                                               2011
 LGA’s total population in 2001. This
 had increased to 10% in 2011 due to
 ongoing residential development.                           3,713                 62,030
                                               2006
 The Rhodes Peninsula’s population
 nearly quadrupled over the 2001 to
 2011 period (268% increase) whilst            2001         2,102             57,215
 the LGA-wide population increased
 by 28% over the same period.
                                                        -            20,000         40,000         60,000         80,000
                                                               Rhodes Peninsula            Canada Bay LGA
                                          Source ABS
 Age Distribution
 The age composition of the LGA
                                                                        17%        29%             29%         18%          7%
 remained relativity stable between           Canada Bay LGA 2011
 2006 and 2011. The Rhodes
 Peninsula by contrast experienced a
 significant increase in the proportion       Canada Bay LGA 2006      16%         29%             30%         18%          7%
 of residents aged in the 15-34 age
 cohort (+12 percentage points).
                                             Rhodes Peninsula 2011     13%              54%                 23%      8%     2%
 Persons aged in the 0-14 cohort and
 those aged 55+ years have
 decreased in the Rhodes Peninsula           Rhodes Peninsula 2006     16%             42%               28%      10%       3%
 between 2006 and 2011.
                                              0-14          15-34
                                              35-54         55-74 0%                         50%                     100%
                                              75+
                                          Source: ABS

Ref: C14107                                    P a g e 17 | 63
Rhodes Economic Viability Study Update
Median Age Characteristics
Geographical Area 2001 2006 2011
In 2011 the median age in the Rhodes suburb 39 32 28
Rhodes suburb was greater than
that of Liberty Grove and Greater Liberty Grove suburb 29 31 32
Sydney. However, it will each Canada Bay LGA n/a* 37 37
subsequent census period and at 28 Greater Sydney 34 35 36
in 2011 was well below the
comparable areas listed in the table. Source: ABS
* note that the City of Canada Bay LGA was not formed in 2001
Place of Birth Australia Elsewhere(b)
Half of residents in the Rhodes 70% 66%
Peninsula were born in Australia in 62%
2006. By 2011 the proportion of 50% 50%
Australian born residents declined 34% 38%
by 20 percentage points to a total of 30%
just 30%.
In comparison Australian born
persons in the LGA accounted for
Rhodes Peninsula Rhodes Peninsula Canada Bay LGA 2006Canada Bay LGA 2011
two-thirds (66%) of the total 2006 2011
population in 2006 declined by only Source: ABS
4 percentage points to 62% in 2011. (b) Includes 'Australian External Territories', 'Inadequately described' and 'At sea'.
Country of Birth
The proportion of Chinese born 20%
persons increased by 15 percentage 15% Rhodes Peninsula
points between 2006 and 2011 in 15%
the Rhodes Peninsula. By 2011 Canada Bay LGA
Chinese born residents accounted 10%
for 22% of the total population in the
5% 3%
Rhodes Peninsula. 2% 1% 2%
1% 0.2% 0.0% -1% 0%
Representation of Chinese born 0%
residents was significantly greater in China South Korea India Hong Kong United
-5% Kingdom
the Rhodes Peninsula than in the
wider LGA. Source: ABS – Excludes Born Elsewhere and Not Stated
Note: Data shown is percentage points not proportional change
Language Spoken at Home
54% of households in the Rhodes English only Other language(c)
Peninsula spoke only English at
68% 66% 62%
home in 2006. By 2011 this
proportion decreased to less than a 54%
third of the total population (32%) 46%
reflecting the high proportion of 38%
32% 34%
overseas born residents.
By comparison in the LGA as a
whole the proportion of households
speaking only English at home in the
comprised 66% in 2006 and 62% by
Rhodes Rhodes Canada Bay LGA Canada Bay LGA
2011. Peninsula 2006 Peninsula 2011 2006 2011
Source: ABS
(c) Includes 'Inadequately described' and 'Non-verbal, so described'.
Ref: C14107 P a g e 18 | 63Rhodes Economic Viability Study Update
Population and Household The above demographic analysis reveals that the Rhodes Peninsula has
Characteristics Summary become more multicultural between the 2006 and 2011 ABS Census
periods. The area has witnessed a significant increase in persons born
overseas especially for residents originating in China and speaking a
second language at home. The concentration of such residents in the
Rhodes Peninsula is well above average for the LGA.
Analysis of the age profile of residents indicates an increasing proportion
of younger residents aged 15 to 34 have moved into the area between
2006 and 2011.
Dwelling Characteristics
Home Ownership
Owned or Being Purchased Rented
In 2006 owner occupiers accounted for
the majority of household types in the 65% 64%
59%
Rhodes Peninsula and LGA. By 2011 47% 51%
renting households dominated 40%
31% 33%
households in the Rhodes Peninsula
and occurred in greater proliferations
than in the LGA. This reflects a high
proportion of buy to let properties being
purchased in the Rhodes Peninsula. Rhodes Peninsula Rhodes Peninsula Canada Bay LGA Canada Bay LGA
2006 2011 2006 2011
Source: ABS
Household Structure
The proportion of family households in
the Rhodes Peninsula decreased
between 2006 and 2011 whilst the
proportion of lone person and group
households increased. However, family
households still accounted for the 76% 72%
69% 71%
largest single proportion of households
types in the Rhodes Peninsula in 2011
(69%).
20% 24% 23%
Family households account for a 18%
6% 10%
comparatively greater proportion of 5.0% 5.3%
households in the LGA in 2011 and
increased over the 2006 to 2011 period. Rhodes Peninsula Rhodes Peninsula Canada Bay LGA Canada Bay LGA
The Rhodes Peninsula is thus under 2006 2011 2006 2011
represented by family households
comparatively. Family Households Lone Person Households Group Households
Source: ABS
Ref: C14107 P a g e 19 | 63Rhodes Economic Viability Study Update
Average Household Size
The average household size in the
Rhodes Peninsula has been declining
and in 2011 was well below that of the Geographical Area 2001 2006 2011
comparable locations listed.
Rhodes suburb 2.7 2.4 2.3
Liberty Grove suburb 2.6 2.7 2.8
Canada Bay LGA n/a* 2.5 2.5
Greater Sydney 2.7 2.7 2.7
Source: ABS
* note that the City of Canada Bay LGA was not formed in 2001
Dwelling Characteristics Summary The Rhodes Peninsula in 2011 is dominated by renting households
and family households. However the overall proportion of families has
declined and the presence of lone person and group households has
increased over the 2006 to 2011 period in conjunction with a rise in
the proliferation of households renting their properties. Household
sizes are low and have fallen significant between 2001 and 2011. This
is likely to reflect the type of residential product being delivered in this
location and the traits of the emerging household types.
Labour Force and Income Characteristics
Labour Force Labour Force
The Rhodes Peninsula is
Greater Sydney
characterised by a high proportion 24% 32% 37% 6%
2011
of residents employed in “white
Greater Sydney
collar” occupations. This trend is 2006
25% 32% 35% 5%
evident in the wider LGA.
Canada Bay LGA
15% 31% 48% 4%
Unemployed residents in the 2011
Rhodes Peninsula accounted for Canada Bay LGA
17% 32% 46% 3%
7% of the total labour force in 2011 2006
which represented a 2 percentage Rhodes Peninsula
12% 29% 50% 7%
point increase since 2006. 2011
Unemployment in the Rhodes Rhodes Peninsula
14% 28% 51% 5%
Peninsula was greater than that in 2006
Blue Collar Community White Collar Unemployment
the wider LGA, possibly reflective
of the higher proportion of younger Source: ABS
Note: Community includes categories such as Community & Personal Services Workers and Clerical
residents. and Administrative Workers
Ref: C14107 P a g e 20 | 63Rhodes Economic Viability Study Update
Educational Attainment
Non-School Education
The Rhodes Peninsula is Greater Sydney 2011 6% 2% 17% 9% 15%
characterised by a highly educated
population within the proportion of Greater Sydney 2006 4% 1% 15% 8% 15%
residents with a bachelor or
postgraduate degree will above Canada Bay LGA 2011 8% 2% 22% 10% 13%
that for both Canada Bay and
Greater Sydney in 2011 Canada Bay LGA 2006 6% 2% 19% 9% 13%
Rhodes Peninsula 2011 15% 2% 29% 9% 6%
Rhodes Peninsula 2006 9% 1% 28% 10% 9%
Postgraduate Degree
Graduate Diploma and Graduate Certificate
Bachelor Degree
Source: ABS
Median Weekly Household
Income
The median household income in $1,988 $1,924
Rhodes was above average for $1,817
$1,565 $1,617 $1,510
Greater Sydney in 2011 but below $1,447
that for Liberty Grove and the City $1,154
of Canada Bay. This is likely to
reflect the higher proportion of
young people and students locally.
Nevertheless households in the
area exhibit above average levels Rhodes Liberty Grove Canada Bay Greater Sydney
of affluence.
2006 2011
Source: ABS
Labour Force and Income The Rhodes Peninsula is an affluent area with half of the labour force
Characteristics Summary working in “white collar” occupations. This is reflected in a median
household income which is greater than the average for Greater Sydney
and a well educated workforce.
Ref: C14107 P a g e 21 | 63Rhodes Economic Viability Study Update
4.2 PROJECTED DEMOGRAPHICS
Population Projections to 2031 Projected Population
The population in the Rhodes 96,115
Peninsula is forecast to increase by
83% between the 2011 and 2031 79,904
compared to a 20% population
increase in the LGA over the same
period.
The Rhodes Peninsula will account
for 16% of the total LGA population in 15,029 16,211
2031 compared to 10% in 2011. 8,193 6,836
2011 2031 Net Difference
Rhodes Peninsula Canada Bay LGA
Source: City of Canada Bay Forecast.id (2013)
Forecast Age Composition
The Rhodes Peninsula is forecast to
experience a decrease in persons in Canada Bay LGA 2031 16% 28% 29% 18% 8%
the 15-34 year age cohort between
2001 and 2031. The proportion of Canada Bay LGA 2011 16% 30% 29% 18% 7%
younger residents aged under 15
years of age and older residents aged 19% 38% 33% 7% 2%
Rhodes Peninsula 2031
in the 35-54 age cohort is set to grow
to 2031, indicative of the increasing
Rhodes Peninsula 2011 13% 55% 22% 8% 2%
dominance of family households with
children as the population moves
through the life cycle. 0% 50% 100%
0-14 15-34 35-54 55-74 75+
Source: City of Canada Bay Forecast.id (2013)
Average Household size
The average household size in the 2.52
Rhodes Peninsula increase 2.50 2.48
marginally over the 2011 to 2031 2.43 2.43 2.45 2.43
2.40 2.39
period contrary to wider demographic 2.36
trends which will see a decline in
average household sizes. This may
be reflective of the expected increase
in family households in the Rhodes 2011 2016 2021 2026 2031
Rhodes Peninsula Canada Bay LGA
Peninsula over the period. Source: City of Canada Bay Forecast.id (2013)
Projected Demographics Summary The Rhodes Peninsula will continue to experience strong population
growth over the period to 2031 (although most will occur in the short
term). The Rhodes Peninsula will transition from a dominance of young
people to a broader demographic mix with families with young children
under the age of 15 becoming prominent. The average household size
will remain around 2.4 over the 2011 to 2031 period.
Ref: C14107 P a g e 22 | 634.3 CONCLUSIONS
The implications of the demographic profile of current and future residents of the Rhodes Peninsula are as
follows:
There is a significant and growing proliferation of residents from the Asian diaspora present in the
Rhodes Peninsula, particularly residents of Chinese ethnicity. This will lead to localised demand for
Asian themed retail goods and services;
There are an increasing proportion of households renting their properties in the Rhodes Peninsula and
the proportion of lone person and group households grew between 2006 and 2011. The average age of
residents has declined markedly and is younger than average. The proportion of students has increased;
Households in the Rhodes Peninsula are comparatively affluent, well educated and have a strong
propensity to be employed in higher paying white collar occupations such as managers and
professionals. This is reflected in greater than average median incomes comparative to the wider
Sydney metropolitan area and will lead to greater disposal income for retail goods and services and
proportionally greater expenditure on eating out; and
Over the period to 2031 the resident population will move through the life cycle and the proportion of
households with children will increase. By 2031 some 19% of all residents in the Rhodes Peninsula will
be under the age of 15. This has implications for demand for local support services including retail and
commercial uses in Precinct D.Rhodes Economic Viability Study Update 5. RETAIL VIABILITY AND IMPACT ASSESSMENT This Chapter undertakes an assessment of the viability of retail uses in Precinct D based on retail expenditure modelling. This assesses the extent of demand to support retail uses in this location and is informed by the assumptions in the 2012 Study, updated to reflect current data. It considers the potential trading impact of the proposed development on other centres in the locality. 5.1 TRADE AREA Residential Trade Area The residential trade area for a future centre in Precinct D remains unchanged from that defined in 2012 Study because the role and function of the centre would be similar under the scheme currently proposed. The residential trade area previously defined is shown in the figure below. Note that the STA encompassing Wentworth Point would be incorporated in the trade area beyond 2016 following completion of the Homebush Bay Bridge. Figure 7 - Precinct D Retail Trade Area Source: Map produced by Hill PDA using MapInfo 11.0 software and Microsoft Bing © 2011 Microsoft Corporation Ref: C14107 P a g e 24 | 63
Rhodes Economic Viability Study Update
Worker Trade Area
The worker trade area for the future centre also remains unchanged from the 2012 Study and is depicted in the
figure below.
Figure 8 - Worker Travel Zones of Influence to Precinct D
Source: Map produced by Hill PDA using MapInfo 11.0 software and Microsoft Bing © 2011 Microsoft Corporation
5.2 SOURCES OF RETAIL EXPENDITURE
Whilst the trade area for the retail centre remains unchanged from that previously defined, the sources of
expenditure from which the centre would derive trade have evolved.
Sources of expenditure to support the centre would be derived from the following main sources:
Local Residents. Population projections have been revised since the 2012 Study and an allowance
should also be made for the additional residential population associated with the proposed Billbergia
development on the site itself and the Wentworth Point UAP;
Local Workers. Workforce projections have been revised since the 2012 Study;
Ref: C14107 P a g e 25 | 63Rhodes Economic Viability Study Update
Hotel visitors. The incorporation of a hotel in Precinct D will lead to additional retail expenditure being
generated by guests from which the centre could capture trade.
Each of these sources is considered in turn below.
5.3 DEMAND GROWTH
Resident Population Growth
To determine population growth in the residential trade area, population projections have been obtained from the
following sources:
For the PTA projections have been sourced from Forecast.id data for the City of Canada Bay which was
published in October 2013. These projections are being used by Council and we have been advised to
adopt these for the purposes of our modelling. An additional allowance is made for the uplift in
residential floorspace currently proposed on the Subject Site 12;
For the STA east population projections have been derived from the August 2012 BTS projections given
that these comprise data at a more finite spatial scale comparative to Forecast.id data; and
For the STA Wentworth Point population projections have been sourced from BTS data which comprises
the most up-to-date data available (comparative to the November 2010 Forecast.id projections for
Auburn City Council used previously). An additional allowance is made for the UAP assuming residential
development lettings commence in 2015 and the 5,000 projected residents are pro-rated across the 15-
year development period.
Based on the above, our population forecasts for the trade area are shown in the following table.
Table 1 - Population Growth Forecasts for the Trade Area
Growth2012-2022
2012 2014 2017 2022
No. Persons %
PTA^
PTA 8,880 10,805 13,697 15,100 +6,220 70%
STA
Wentworth Point^^* 3,874 3,290 10,465 13,365 +9,491 245%
East^^^ 1,635 1,677 1,689 1,715 +80 5%
Sub-total STA 5,509 4,967 12,155 15,080 +9,571 174%
Total Trade Area 14,389 15,772 25,852 30,180 +15,791 110%
Source: ^ City of Canada Bay, Forecast.id (October 2013)
^^ Population and Employment Travel Zone Forecasts, BTS (August 2012) and DoPI (2013)
^^^ Population and Employment Travel Zone Forecasts, BTS (August 2012). Apportioned by Hill PDA
Note: Population of Wentworth Point is assumed to form part of the STA once the Homebush Bay Bridge is opened.
The population projections provided above indicate the following:
12Note:The previous Masterplan proposed 710 residential units on Precinct D and based on the current proposals we understand that 93 2
units would be developed. The population of these units is estimated by applying the average household occupancy rate for fla ts, units and
apartments in a four or more storey block in the Rhodes suburb as derived from 2011 ABS Census data (2.25 persons per household).
Ref: C14107 P a g e 26 | 63Rhodes Economic Viability Study Update
The resident population in the PTA is estimated at 14,387 persons in 2012 of which the majority (8,880
persons or 62% of the total population) resided in the PTA;
Over the 10 year period to 2022 the population of the residential trade area is projected to increase to
30,180 persons representing a more than doubling of the population. The majority of the population
growth is associated with the Wentworth Point UAP;
Compared to the population projections which informed the 2012 Study, population projections for the
PTA commence at a higher base in 2012 and yield a greater total population in 2022 but growth over the
interim is lower than forecast previously; and
BTS has revised downwards population projections for the STA East and for Wentworth Point since the
2012 Study. However the forecast total population of the STA is greater overall in 2022 as a result of the
UAP which was not accounted for by the BTS.
Employment Growth
Worker projections for the worker related trade area are sourced from BTS projections which were published
subsequent to the 2012 Study. These are shown in the table below.
Table 2 - Worker Growth Forecasts to 2022
Growth
Travel Zone No. Travel Zone Name 2012 2014 2017 2022
2012-22
1499 Rhodes (Western Side) 3,587 3,673 3,955 4,091 +504
1500 Rhodes (Eastern Side) 5,257 5,424 7,364 7,601 +2,345
1501 Concord West 407 425 499 539 +131
1502 Concord Repatriation General Hospital 3,278 3,467 4,265 4,706 +1,428
1503 Liberty Grove 173 181 211 226 +53
1613* Sydney Olympic Park Ferry Wharf 668 675 705 712 +44
Total 13,370 13,844 16,999 17,875 +4,505
*Note: Workers in the Sydney Olympic Park Ferry Wharf travel are assumed to be of influence to Precinct D once the Homebush Bay Bridge is opened.
Source: Population and Employment Travel Zone Forecasts, BTS (August 2012)
The latest BTS worker projections for the worker trade area are greater than those used to inform the 2012 Study.
The worker population in 2012 is estimated at 13,370 workers which will increase by 4,505 workers or 34% to
17,875 workers by 2022.
Hotel Visitors
The development proposal would deliver 100 hotel/ serviced apartments as part of Precinct D. By applying an
average occupancy rate for the facility of 74.5% 13, it is estimated that the hotel/ serviced apartments would by
occupied for 27,193 visitor nights per annum. Assuming an average occupancy rate of 1.5 persons per room 14
equates visitor nights of 40,790/annum.
13 Source: 8635.0 - Tourist Accommodation, Australia, Mar 2013, ABS (June 2013)
14 Source: Hill PDA estimate
Ref: C14107 P a g e 27 | 63Rhodes Economic Viability Study Update
5.4 DEMAND FOR SHOPFRONT FLOORSPACE
Resident Retail Spend
To estimate the demand for retail floorspace from residents this Section applies household expenditure data to the
population forecasts for the residential trade area. In addition to population growth, demand for additional retail
floorspace will also occur as a result of real retail expenditure growth reflecting increased affluence of households .
Hill PDA currently applies a forecast of 1.1% per annum for real retail growth which reflects the long-term trend
since 198615.
Household expenditure was sourced from:
ABS Household Expenditure Survey (HES) 2003-04 (updated to 2013) which provides household
expenditure by broad commodity type by household income quintile; and
Marketinfo 2009 database (updated to 2013 dollars) which is generated by combining and updating data
from the Population Census and the ABS Household Expenditure Survey (HES) using “microsimulation
modelling techniques”.
Marketinfo combines the data from the Census, HES and other sources to derive total HES by commodity type.
This data, which was validated using taxation and national accounts figures, quantifies around slightly more
expenditure than the HES. The ABS Retail Survey 1998-99 (Cat No. 8624.0) provides a cross tabulation of store
type (defined by ANZIC), by commodity type. Multiplying the percentages in the cross tabulation by total dollars
spent generates household expenditure by retail store type.
Consistent with the 2012 Study, the retail expenditure modelling assumes that:
Residents of STA Wentworth Point will have the same per capita retail expenditure level as residents of the
Rhodes suburb; and
Residents of STA Wentworth Point will form part of trade area post-2016 once the Homebush Bay Bridge is
developed.
The following table shows total expenditure generated in the trade area over 2012 to 2022 period.
15Note: This has been revised downwards from 1.3% used to inform the 2012 Study which is reflective of retail trends since April 2012
Ref: C14107 P a g e 28 | 63Rhodes Economic Viability Study Update Table 3 - Total Retail Expenditure Generated by the Resident Trade Areas to 2022 ($m) Retail Store Type 2012 2014 2017 2022 Primary Trade Area Supermarkets & Grocery Stores 36.8 45.7 59.9 69.8 Specialty Food Stores 12.3 15.3 20.1 23.4 Fast-Food Stores 11.9 14.7 19.3 22.5 Restaurants, Hotels and Clubs* 16.5 20.6 27.0 31.4 Department Stores 11.6 14.4 18.9 22.0 Bulky Goods Stores 21.9 27.2 35.7 41.5 Other Personal & Household Goods Retailing** 26.5 32.9 43.1 50.2 Selected Personal Services*** 4.9 6.0 7.9 9.2 Total PTA 142.3 177.0 231.9 270.0 Secondary Trade Area – Wentworth Point Supermarkets & Grocery Stores 16.0 13.9 45.8 61.8 Specialty Food Stores 5.4 4.7 15.3 20.7 Fast-Food Stores 5.2 4.5 14.8 19.9 Restaurants, Hotels and Clubs* 7.2 6.3 20.6 27.8 Department Stores 5.1 4.4 14.4 19.5 Bulky Goods Stores 9.6 8.3 27.3 36.8 Other Personal & Household Goods Retailing** 11.5 10.0 32.9 44.4 Selected Personal Services*** 2.1 1.8 6.1 8.2 Total STA Wentworth Point 62.1 53.9 177.1 238.9 Secondary Trade Area - East Supermarkets & Grocery Stores 6.6 6.9 7.2 7.7 Specialty Food Stores 2.2 2.3 2.4 2.5 Fast-Food Stores 2.1 2.2 2.3 2.5 Restaurants, Hotels and Clubs* 2.7 2.8 2.9 3.1 Department Stores 2.1 2.2 2.3 2.5 Bulky Goods Stores 3.4 3.6 3.7 4.0 Other Personal & Household Goods Retailing** 4.9 5.1 5.3 5.7 Selected Personal Services*** 0.9 0.9 0.9 1.0 Total STA East 24.8 26.0 27.0 29.0 Total Trade Areas Supermarkets & Grocery Stores 59.4 66.6 112.9 139.2 Specialty Food Stores 19.9 22.2 37.8 46.6 Fast-Food Stores 19.2 21.5 36.4 44.9 Restaurants, Hotels and Clubs* 26.4 29.6 50.4 62.3 Department Stores 18.8 21.0 35.6 43.9 Bulky Goods Stores 34.9 39.1 66.7 82.3 Other Personal & Household Goods Retailing** 42.9 48.0 81.3 100.3 Selected Personal Services*** 7.8 8.8 14.9 18.4 Total Trade Areas 229.2 256.9 436.0 537.9 * Turnover relating only to consumption of food and liquor (excludes all other types of revenue such as accommodation, gaming and gambling).** Includes clothing and footwear related expenditure*** Selected Personal Services includes hair and beauty, laundry, clothing hire and alterations, shoe repair, optical dispensing, photo processing and hire of videos. The trade area generated an estimated $229m of expenditure in 2012 of which some $142m or 62% was attributable to residents in the PTA. By 2022 the total quantum of expenditure generated in the trade area will increase by +$309m (135%) to reach $538m. By 2022 the expenditure generated in the PTA ($270m) will be broadly comparable to that generated in the STA ($268m) largely as a result of expenditure in the STA Wentworth Point. Inclusion of resident expenditure in this area is possible after the Homebush Bay Bridge is constructed in Ref: C14107 P a g e 29 | 63
Rhodes Economic Viability Study Update
2016. Note that retail demand is greater in the calculations above comparative to the 2012 Study as a result of
greater population forecasts.
As noted in the 2012 Study residents in the trade areas have higher per capita retail spend per retail store type
($15,927/ capita in 2012) compared to the NSW average ($13,546/ capita). This reflects the greater than average
affluence of local residents and their greater propensity to be employed in skilled professions as noted in the
demographic analysis. We expect this trend to continue.
The type of retail demand emanating from residents will be for high value retail facilities with an emphasis on
convenience, quality and eating out. Because of their greater levels of affluence, they will spend comparatively
more money on retail goods and products will manifest in demand for more retail floorspace than the average
household in for Sydney. They will demand a higher quality of retail product. They will also spend a greater
proportion of their income on dining out and thus demand a disproportionally higher quantum of cafe and
restaurant floorspace. Convenience will be important for households that are likely to be cash-rich but time poor.
Of total retail expenditure generated by residents of the residential trade area only a proportion would be captured
by retail facilities in Precinct D. To some extent this will depend on the type of retail facilities which are provided,
however given that we know the role of town and village centres is to cater for localised, daily shopping needs we
can assume a range of capture rates on this basis.
Hill PDA has estimated a range of capture rates for different retail stores types as shown in the following table.
These are consistent with those used to inform the 2012 Study. Whilst it is recognised that the UAP will include
some retail facilities, the planning proposal documentation for the UAP indicates that retail will be modest in
nature serving localised need only. We still expect Precinct D to capture expenditure from residents the
Wentworth Point UAP given the position of the centre between residents in this area and Rhodes Rail Station.
Table 4 - Assumed Capture Rates of Resident Expenditure to Precinct D
STA –
Total Trade
Retail Store Type PTA Wentworth STA – East
Area
Point
Supermarkets & Grocery Stores 35% 15% 10% 29%
Specialty Food Stores 30% 15% 10% 25%
Fast-Food Stores 30% 15% 10% 25%
Restaurants, Hotels and Clubs* 30% 15% 10% 25%
Department Stores 0% 0% 0% 0%
Bulky Goods Stores 0% 0% 0% 0%
Other Personal & Household Goods Retailing** 15% 10% 5% 13%
Selected Personal Services*** 30% 15% 10% 16%
Total Trade Area 21% 12% 8% 18%
Source: Hill PDA (2013) * Turnover relating only to consumption of food and liquor (excludes all other types of revenue such as accommodation, gaming
and gambling). ** Includes clothing and footwear related expenditure *** Selected Personal Services includes hair and beauty, laundry, clothing hire and
alterations, shoe repair, optical dispensing, photo processing and hire of videos.
The above capture rates have been based on the following assumptions:
Around 20- 25% of total household expenditure in any area is directed towards regional shopping centres
such as Sydney CBD or Parramatta CBD.
As much as 10% of household expenditure can be spent close to the place of work (some of which
accounts for the proportion directed towards regional shopping centres).
Ref: C14107 P a g e 30 | 63You can also read