RNA-Seq for gene identification and transcript profiling of three Stevia rebaudiana genotypes
←
→
Page content transcription
If your browser does not render page correctly, please read the page content below
Chen et al. BMC Genomics 2014, 15:571
http://www.biomedcentral.com/1471-2164/15/571

 RESEARCH ARTICLE                                                                                                                             Open Access

RNA-Seq for gene identification and transcript
profiling of three Stevia rebaudiana genotypes
Junwen Chen1†, Kai Hou1†, Peng Qin2, Hongchang Liu1,3, Bin Yi1, Wenting Yang1,4 and Wei Wu1*

  Abstract
  Background: Stevia (Stevia rebaudiana) is an important medicinal plant that yields diterpenoid steviol glycosides
  (SGs). SGs are currently used in the preparation of medicines, food products and neutraceuticals because of its
  sweetening property (zero calories and about 300 times sweeter than sugar). Recently, some progress has been
  made in understanding the biosynthesis of SGs in Stevia, but little is known about the molecular mechanisms
  underlying this process. Additionally, the genomics of Stevia, a non-model species, remains uncharacterized. The
  recent advent of RNA-Seq, a next generation sequencing technology, provides an opportunity to expand the
  identification of Stevia genes through in-depth transcript profiling.
  Results: We present a comprehensive landscape of the transcriptome profiles of three genotypes of Stevia with
  divergent SG compositions characterized using RNA-seq. 191,590,282 high-quality reads were generated and then
  assembled into 171,837 transcripts with an average sequence length of 969 base pairs. A total of 80,160 unigenes
  were annotated, and 14,211 of the unique sequences were assigned to specific metabolic pathways by the Kyoto
  Encyclopedia of Genes and Genomes. Gene sequences of all enzymes known to be involved in SG synthesis were
  examined. A total of 143 UDP-glucosyltransferase (UGT) unigenes were identified, some of which might be involved
  in SG biosynthesis. The expression patterns of eight of these genes were further confirmed by RT-QPCR.
  Conclusion: RNA-seq analysis identified candidate genes encoding enzymes responsible for the biosynthesis of
  SGs in Stevia, a non-model plant without a reference genome. The transcriptome data from this study yielded new
  insights into the process of SG accumulation in Stevia. Our results demonstrate that RNA-Seq can be successfully
  used for gene identification and transcript profiling in a non-model species.
  Keywords: Stevia rebaudiana, Transcriptome, RNA-seq

Background                                                                          accumulate in Stevia leaves. Depending on the genotype
Stevia (Stevia rebaudiana Bertoni (2n = 22, Asteraceae))                            and the growing and harvesting conditions, the con-
is an important medical plant that is native to South                               centration varies from 10% to 20% of the dry weight of
America [1]. Among 230 species of this genus, only two                              leaves [6]. Currently, Stevia is a major source of natural
Stevia species (S. rebaudiana and S. phlebophylla) can                              SGs, which have received increasingly greater interest
produce SGs (steviol glycosides) [2]. SGs are non-caloric                           among different research fields [7].
and non-cariogenic sweeteners with functional and sen-                                The SG produced by Stevia is a mixture of at least
sory properties superior to many other high-potency                                 eight different types, including ST (stevioside), RA-RF
sweeteners [3,4]. Because of their sweetening property                              (rebaudiosides A-F), rubusoside and dulcoside A, a new
(zero calories and about 300 times sweeter than sugar),                             diterpene glycoside recently isolated from Stevia [8].
SGs have been used widely in the preparation of medi-                               Some progress has been made in understanding the bio-
cines, beverages and neutraceuticals [5]. In general, SGs                           synthetic pathway of SGs, including the identification of
                                                                                    17 steps catalyzed by different enzymes. The initial se-
* Correspondence: ewuwei@sicau.edu.cn                                               ven steps are similar to steps within the MEP (methyl
†
 Equal contributors                                                                 erythritol-4-phosphate) pathway, catalyzing pyruvate to
1
 Agronomy College of Sichuan Agricultural University, Wenjiang, Chengdu,            isopentenyl diphosphate. Several genes have been demon-
Sichuan 611130, China
Full list of author information is available at the end of the article              strated to be involved in the first seven steps, including

                                       © 2014 Chen et al.; licensee BioMed Central Ltd. This is an Open Access article distributed under the terms of the Creative
                                       Commons Attribution License (http://creativecommons.org/licenses/by/2.0), which permits unrestricted use, distribution, and
                                       reproduction in any medium, provided the original work is properly credited. The Creative Commons Public Domain
                                       Dedication waiver (http://creativecommons.org/publicdomain/zero/1.0/) applies to the data made available in this article,
                                       unless otherwise stated.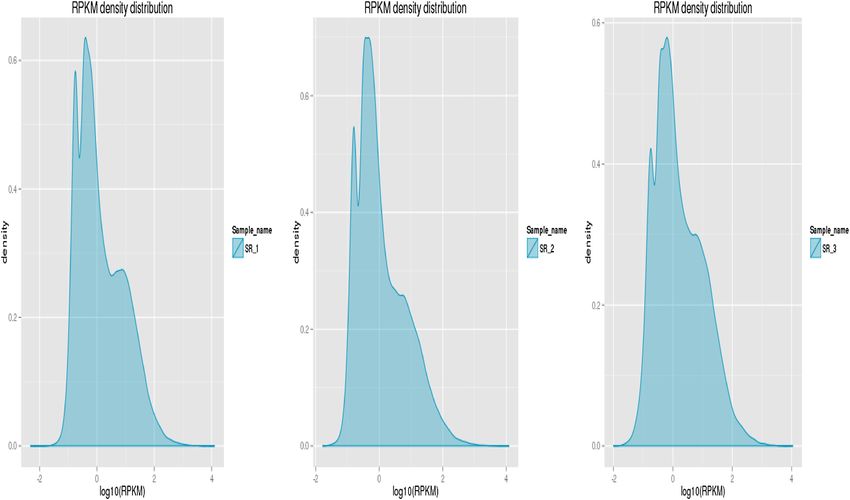
Chen et al. BMC Genomics 2014, 15:571                                                                          Page 2 of 11
http://www.biomedcentral.com/1471-2164/15/571

DXS, DXR, MCT, CMK, MDS, HDS, HDR and IDI [2].                 provides a platform of sequence information for global
The GA (gibberellic acid) biosynthetic pathway (from iso-      discovery of novel functional genes involved in the biosyn-
pentenyl diphosphate to kaurenoic acid) is involved in the     thesis of SGs and demonstrates the powerful ability of
next five pathways, in which 4 genes (GGDPS, CPPS, KS          high-throughput sequencing to identify candidate genes
and KO) are thought to participate. The last five steps,       involved in novel metabolic pathways in non-model plant
from kaurenoic acid to RA, are specific to the SG biosyn-      systems.
thetic pathway [2]. Four genes, including GGDPS, CPPS,
KS and KO are involved in the last five steps. Additionally,   Results and discussions
P450-dependent monooxygenases and glycosyltransferases         The leaves of three Stevia genotypes (SR-1, SR-2 and
are assumed to be involved in the modification of the tri-     SR-3) have dramatically different amounts of ST and RA
terpenoid backbone [9], and UGTs (UDP-glycosyltransfer-        To select different genotypes of Stevia for comprehensive
ases), including UGT85C2, UGT74G1 and UGT76G1, are             characterization of genes associated with SG (especially
also proposed to participate in the RA biosynthetic path-      ST and RA) biosynthesis, we used HPLC to analyze the
way [10]. Although the biosynthetic pathway of SGs has         ST and RA contents in the leaves from three Stevia geno-
been extensively studied, the mechanism of biosynthesis        types (SR-1, SR-2 and SR-3). SR-1 had relatively higher
and the genes involved in the pathway remain poorly            RA, with 2.19% ST and 6.91% RA, whereas SR-2 had a
understood.                                                    preponderance of ST (12.87% ST and 0.02% RA). RA was
  SGs are the sweetest known natural sweeteners, but           the most highly accumulated in SR-3 (9.35%), with the
the taste perception of different SGs is strong depending      lowest amount of ST (1.23%) (Table 1). Based on the dra-
on their patterns of glycosylation [11]. Among different       matic differences in the amounts of RA and ST, we as-
SGs, RA has a much better taste perception than ST,            sessed the gene expressions in all three genotypes to
which is being applied as a substitute for saccharose and      provide a more comprehensive overview of SG-associated
is used in the treatment of diabetes mellitus, obesity,        gene profiles in plants with different SG expression
and hypertension [7]. Therefore, RA is a good replace-         patterns.
ment of ST [12]. Many plant culture practices aiming to
increase the leaf yield and RA content have been studied       RNA-sequencing and de novo assembly of three
[13]. However, molecular biology techniques have been          genotypes of Stevia
scarcely used in the improvement of SG accumulation in         To comprehensively survey the genes associated with SG
Stevia, mostly due to the absence of available sequence        formation and accumulation, we performed RNA-seq for
information. Currently, there are only 160 sequences ori-      SR-1, SR-2 and SR-3. RNA was extracted from the leaves
ginating from Stevia that are available in the National        of the three samples at the bud stage and used to de-
Center for Biotechnology Information (NCBI) database.          velop cDNA libraries. In total, 61,710,194, 68,652,614
For this reason, it is difficult to isolate functional genes   and 61,227,474 reads were achieved in the SR-1, SR-2,
that govern important quality and agronomic traits of          and SR-3 libraries, respectively (Table 2). To ensure the
Stevia.                                                        reliability of the libraries, we performed quality controls
  RNA-Seq, based on next-generation sequencing tech-           and obtained 60,113,164, 66,869,210 and 58,857,260 clean
nology, is emerging as an attractive approach to under-        reads for SR-1, SR-2, SR-3. Due to the absence of refer-
stand transcriptome profiling. RNA-Seq provides a far          ence genomic sequences, de novo assembly was applied to
more precise measurement of transcripts than other             construct transcripts from these RNA-seq reads. In this
methods and has been successfully used for annotation,         study, we used Trinity (version: v2012-10-05) software
transcript profiling and/or SNP discovery in a number of       [18] for de novo assembly of the Illumina reads, which has
plant species [14-17]. Furthermore, unlike microarrays,        been demonstrated to be efficient for de novo reconstruc-
RNA-Seq does not require prior knowledge of gene               tion of transcriptomes from RNA-Seq data [18-20]. The
sequences. In this study, we used Illumina RNA-Seq             reads from the three genotypes were pooled together for
technology for identifying genes associated with SG            more comprehensive reconstruction of transcripts, and a
biosynthesis in three Stevia geneotypes with different         total of 171,837 contigs were obtained from the clean
RA and ST contents. In total, 191,590,282 high-quality
reads were generated, and 80,160 unigenes were obtained        Table 1 Comparison of ST and RA contents in leaves of
by de novo assembly. A total of 10,070 SSRs and 44,510         chemical types SR-1, SR-2 and SR-3
SNPs were also identified, which might be useful for           Sample                      ST%                        RA%
Stevia molecular research. We also identified 636,2,464        SR-1                         2.19                      6.91
and 2,041 unigenes with differential expression levels in      SR-2                        12.87                      0.02
SR-1, SR-2, and SR-3, as well as homologs of several uni-
                                                               SR-3                         1.23                      9.35
genes involved in the SG biosynthetic pathway. Our study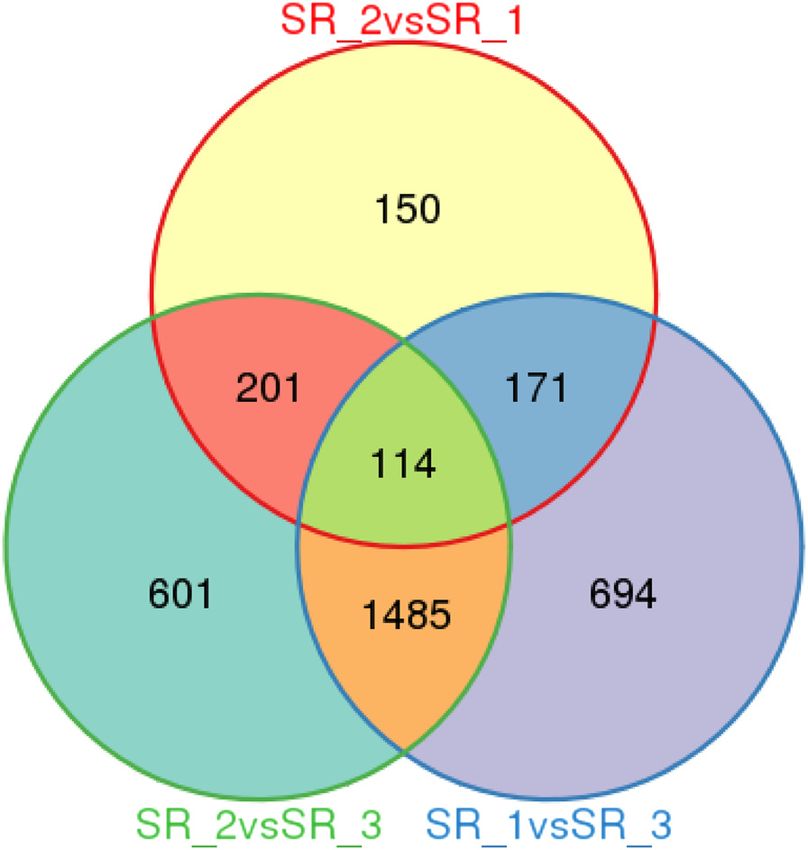
Chen et al. BMC Genomics 2014, 15:571 Page 3 of 11
http://www.biomedcentral.com/1471-2164/15/571
Table 2 Assessment of assembly quality for Stevia Table 4 Gene annotation by searching against
libraries of three different genotypes public databases
SR-1 SR-2 SR-3 Number of unigenes Percentage (%)
Raw reads 61710194 68652614 61227474 Annotated in NR 41946 52.32
Clean reads 60113164 66869210 58857260 Annotated in NT 14292 17.82
Error (%) 0.03 0.03 0.03 Annotated in KEGG 14211 17.72
Annotated in SwissProt 30169 37.63
reads of the pool with a mean length of 969 bp and length Annotated in PFAM 32074 40.01
ranging from 201 bp to 15,537 bp (Table 3). Among the Annotated in GO 32074 40.01
171,837 contigs, 80,160 unigenes were obtained. Annotated in KOG 19146 23.88
Annotated in all databases 47165 58.83
Gene annotation
Total unigenes 80160
Unigenes annotation was performed by BLAST searching
(E-value ≤10−5) against the Nr (NCBI non-redundant pro-
tein sequences), Nt (NCBI nucleotide sequences), Pfam
(protein family), KOG (euKaryotic Ortholog Groups), into the “biological regulation”, “organelle” and “catalytic
Swiss-Prot (A manually annotated and reviewed protein activity” categories, whereas a few genes were classified
sequence database), KEGG (Kyoto Encyclopedia of Genes into the “growth” and “extracellular matrix part” groups
and Genomes) and GO (Gene Ontology) databases [21]. (Figure 1, and Additional file 1).
A total of 41,946 unigenes (52.32% of all unigenes) were Stevia SGs are considered metabolic products and are
annotated with a significant BLAST result in the Nr data- glucosylated derivatives. Therefore, we hypothesized that
base; 30,169 unigenes (37.63% of all unigenes) were anno- the 18,292 unigenes classified into the “metabolic pro-
tated in Swiss-Prot database; and 32,074 unigenes were cess” group and the 15,272 unigenes classified into the
annotated in both the Pfam and GO databases. In total, “catalytic activity” group might serve as good candidates
47,165 unigenes were annotated in the seven databases for the identification of novel genes that participated
(Table 4). in the SG biosynthesis and accumulation pathways
(Figure 1, and Additional file 1).
Gene ontology (GO) classification
GO assignments were used to predict the functions of Functional classification by KEGG
Stevia unigenes by classifying them into various bio- KEGG is thought to provide a basic platform for system-
logical processes [22]. Based on sequence homology, the atic analysis of gene function in terms of the networks of
32,074 unigenes annotated in the GO database were cat- gene products [23]. To further identify the biological
egorized into 47 functional groups. Among these groups, pathways that are active in Stevia, the 14,211 unigenes
“cellular process” and “metabolic process” were dominant annotated by blast analysis against KAAS (KEGG Auto-
within the “biological process” category, the “cell” and “cell matic Annotation Server) were mapped to 250 reference
part” categories were dominant in the “cellular compo- canonical pathways, and these pathways were classified
nent” category, and “binding” and “catalytic activity” were into five main categories: “cellular processes”, “environ-
dominant in the molecular function category (Figure 1). mental information processing”, “genetic information pro-
Additionally, we noted that many genes were classified cessing”, “metabolism” and “organismal systems”. The
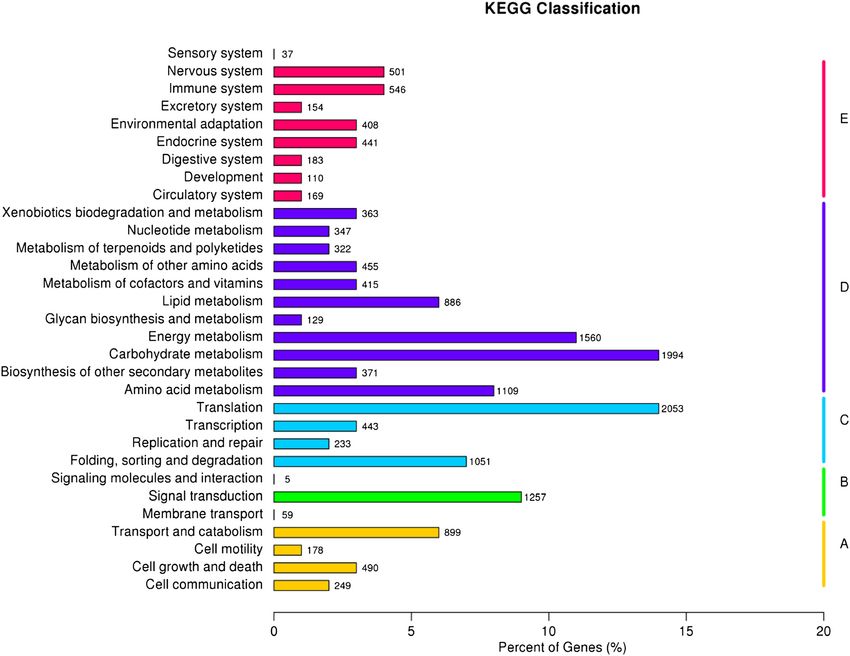
pathways with most representation were “translation”
Table 3 Summary of assembly quality for Stevia RNA-seq (2,053 unigenes, 14.45%) and “carbohydrate metabolism”
Assembly quality parameters (1,994 unigenes, 14.01%) (Figure 2, Additional file 2).
Contigs generated 171,837 These annotations and classifications provided a resource
Maximum contig length 15,537
for investigating specific pathways in Stevia, such as the
SG biosynthetic pathway. SGs are tetracyclic diterpene
Minimum contig length 201
glycosides; therefore, the 322 unigenes clustered into “me-
Average contig length 969 tabolism of terpenoids and polyketides” might potentially
Contigs 200–500 bp 71,627 be involved in the biosynthesis and metabolism of SGs.
Contigs 500-1 kb 40,288 Among the 322 unigenes, 76 unigenes (23.53%) and 30
Contigs 1-2 Kb 39,651 unigenes (9.32%) were classified into the “terpenoid back-
Contigs ≥ 2 Kb 20,271
bone” and “diterpenoid biosynthesis” sub-pathways, res-
pectively, and thus were more likely to be involved in SG
N50 value 1,547
biosynthesis for Stevia (Additional file 2).Chen et al. BMC Genomics 2014, 15:571 Page 4 of 11 http://www.biomedcentral.com/1471-2164/15/571 Figure 1 Histogram of gene ontology classification. The results are summarized in three main categories: biological process, cellular component and molecular function. SSR and SNP detection 20 primer pairs had amplicons in 3 Stevia varieties (SR_1, Molecular markers are extremely important for mole- SR_2 and SR_3), of which 5 primer pairs showed poly- cular biology research (e.g., gene mapping) and molecu- morphism and this results indicated that molecular mar- lar breeding [24,25]. We sought to identify candidate kers could be used for marker-assisted breeding in Stevia markers for the Stevia molecular research community (Additional file 4: Figure S2). As an alternative to SSRs, and for breeding. Two types of markers, SSR (Simple 44,510 SNP variations (in 11,000 unigenes) were also iden- Sequence Repeats) and SNP (Single Nucleotide Poly- tified among the three genotypes (Additional files 6, 7 morphism) were identified using MISA (MIcroSAtellite) and 8). The high density SNP markers may be useful (http://pgrc.ipk-gatersleben.de/misa/misa.html) [26] and for molecular research of Stevia in the event that no SOAPsnp (Short Oligonucleotide Analysis Package) soft- SSR markers are available. ware [27], respectively. In total, 10,070 SSRs were iden- tified among the 80,160 unigenes (Additional file 3), Transcript profiling accounting for 12.56% of all unigenes. Additionally, 1,136 The sensitivity of RNA-Seq facilitates the measurement unigenes contained more than 1 SSR. SSRs generally in- of both the molar concentration and transcript length. cluded 2 to 6 nucleotide repeat types and the number We used the normalized-RPKM (reads per kilobase of repeats changed significantly among geneotypes. The per million) to quantify the transcript level in reads, mono-, di-, tri-, tetra-, penta- and hexanucleotide repeat which facilitated the comparison of mRNA levels both SSRs in this study composed about 55.05%, 18.17%, within and between samples [28]. The three genotypes 25.48%, 0.99%, 0.14% and 0.16% of the SSRs, respectively showed similar RPKM density distribution (Figure 3), (Additional file 4: Figure S1). To facilitate the usage of the which suggested that the transcript profiles of the three SSR markers as a resource for the Stevia molecular biol- samples were similar. The RPKM density distribution of ogy and breeding community, we designed primers for the three samples also showed that the transcripts were each of the SSRs using Primer3 (http://primer3.source enriched at the RPKM region between 0.3 and 3.57; the forge.net/releases.php) (Additional file 5). Twenty primer percentages of transcripts in this region were 38.11%, pairs were randomly selected from the microsatellites. All 43.55% and 33.89% in SR-1, SR-2 and SR-3, respectively
Chen et al. BMC Genomics 2014, 15:571                                                                                           Page 5 of 11
http://www.biomedcentral.com/1471-2164/15/571

 Figure 2 Pathway assignment based on KEGG. (A) Cellular Processes; (B) Environmental Information Processing; (C) Genetic Information
 Processing; (D) Metabolism; (E) Organismal Systems.

(Figure 3). We identified the most abundantly expressed                 genes involved in ST and RA biosynthesis. The DEGSeq
unigenes in Stevia leaf because they were considered im-                program [29] was used to identify the differentially ex-
portant for Stevia development. We focused on the top                   pressed unigenes among SR-1, SR-2 and SR-3. For SR-1 vs
2% (598 unigenes) most highly expressed genes of each                   SR-2, 636 unigenes were differentially expressed, including
sample (Additional file 9). The RPKM of those unigenes                  248 genes that were obviously up-regulated in SR-1 and
were greater than 156, 163 and 186 in SR-1, SR-2 and SR-                388 genes that were obviously down-regulated. For SR-1
3, respectively. Interestingly, the abundantly expressed                vs SR-3, 2,464 unigenes were differentially expressed
unigenes in the three samples were enriched in metabolic                (1,185 up-regulated and 1,279 down-regulated in SR-1),
pathways according to both KEGG and GO analysis. This                   and for SR-3 vs SR-2, 2,041 unigenes were differentially
suggested that the genes involved in metabolism be                      expressed (1,156 up-regulated and 1,246 down-regulated
dominant in the three genotypes (Additional file 4: Figures             in SR-3). Among these differentially expressed genes, 114
S3 and S4), and many metabolism products, such as SGs,                  genes were differentially expressed among all threes geno-
be presented in Stevia.                                                 types (Figure 4, Additional file 10).
                                                                          To further analyze the possible function of unigenes
Differentially expressed genes among three genotypes                    with differential expression levels, we assessed their GO
The three genotypes (SR-1, SR-2 and SR-3) with signifi-                 classifications. The 636 unigenes with differential ex-
cantly different amounts of ST and RA in their leaves                   pression between SR-1 and SR-2 were classified into 95
(Table 1) had relatively higher similar transcript profiling            pathways by KEGG analysis, with clear enrichment in
(Figure 3). Consequently, we sought to analyze the diffe-               metabolic pathways (Additional file 4: Figure S5A). Be-
rentially expressed unigenes in order to identify candidate             cause the amount of ST in SR-1 was significantly lower
Chen et al. BMC Genomics 2014, 15:571 Page 6 of 11
http://www.biomedcentral.com/1471-2164/15/571
Figure 3 Frequency distribution of SR-1, SR-2 and SR-3 by reads per kilobase per million (RPKM).
than SR-2 (Table 1), some of the 248 up-regulated uni- likely to participate in the RA biosynthetic pathway.
genes of SR-1 vs SR-2 were likely to be directly or indir- In support of these data, both the down-regulated and
ectly involved in ST biosynthesis. Similarly, because the up-regulated unigenes were enriched in metabolic path-
amount of RA in SR-1 was significantly higher than ways as determined by KEGG analysis (Additional file 4:
SR-2, some of the 338 down-regulated unigenes were Figure S5B and C). The unigenes of SR-3 vs SR-2 were
also enriched in metabolic pathways by KEGG analysis
(Additional file 4: Figure S6A). However, the occurrence
of 2,041 unigenes with differential expressions between
SR-3 and SR-2 suggested that other differences may
contribute to the relatively larger number of differen-
tially expressed unigenes. The down-regulated and up-
regulated unigenes of SR-3 vs SR-2 were enriched in the
biosynthesis of secondary metabolites and metabolic
pathways, consistent with roles in ST and RA biosyn-
thesis, respectively (Additional file 4: Figure S6B and C).
In total, 315 overlapping unigenes were similar between
the two comparisons (Figure 4, Additional file 11),
which might narrow down the identification of genes
that directly participate in the RA and ST biosynthetic
pathway. As an example, one of the 315 unigenes
(comp68371_c0; predicted as UGT76G1) is reported
to be involved in the SG biosynthetic pathway. Add-
itionally, two cytochrome P450s (comp57120_c0 and
comp70800_c1), beta-1,3-glucanase (comp67196_c0) and
beta-1,4-xylosidase (comp32324_c0) are good candidates
for the SG biosynthetic pathway because they have all
Figure 4 Differential gene expression showed in Venn diagram
been reported to participate in the biosynthesis of SG
form.
precursors [30].Chen et al. BMC Genomics 2014, 15:571 Page 7 of 11
http://www.biomedcentral.com/1471-2164/15/571
Additionally, because the RA and ST amounts in SR-1 RT-qPCR, and the expressions of CPPS, KS and KO were
and SR-3 were similar, the overlapping unigenes of SR-1 similar to the RNAseq data (Figure 5B).
vs SR-3 might also be helpful for excluding unigenes that Because the last five of the 17 steps of the SG bio-
were not significantly associated with the RA and ST synthetic pathway were specific for Stevia, we next used
biosynthetic pathways. We found 114 overlapping uni- RT-qPCR to investigate the expression pattern of the
genes with SR-1 vs SR-3. Exclusion of these 114 unigenes genes (KAH, UGT85C2, UGT74G1 and UGT76G1), which
from the 315 overlapping unigenes for SR-1 vs SR-2 and are reported to be associated with the last five steps. Simi-
SR-3 vs SR-2 left 201 remaining unigenes (Additional lar to the RNA-seq expression patterns, KAH, UGT85C2
file 11), which were much more likely to be involved in and UGT76G1 were highest in the SR-3, compared to SR-
the ST and RA biosynthetic pathways. This gene set in- 1 and SR-2. The expressions of KAH and UGT76G1 in
cluded comp56279_c0 and comp57120_c0, which were SR-1 were obviously higher than that of SR-2 and SR-3,
predicted to encode UDP-glucuronosyltransferase and while UGT74G1 was equally expressed in SR-1, SR-2 and
cytochrome P450 mono-oxygenase, respectively. SR-3 (Figure 5B), which was similar to the RNA-seq data.
This verified that the RNA-seq in this study was reli-
able. Moreover, several reported genes known to be
The expression pattern of genes involved in the SG involved in SG synthesis had been identified in the
biosynthetic pathway differently expressed unigenes of SR-1 vs SR-2 and SR-3
Seventeen steps catalyzed by various enzymes have been vs SR-2, including UGT76G1 (comp68371_c0) and CPPS
identified in the SG biosynthetic pathway [2,31]. The ini- (comp68805_c0). This further verified that it was feasible
tial seven steps synthesizing isoprenoids are shared with to use the RNA-seq approach to identify the genes associ-
the MEP (methyl erythritol-4-phosphate) pathway; the ated with SG synthesis. Similarly, some triterpene biosyn-
next five steps are similar to the GA (gibberellic acid) thetic genes from Siraitia grosvenorii had been found
biosynthetic pathway; and the remaining five steps are using RNA-seq and digital gene expression analysis [30].
specific for the SG biosynthetic pathway. Sixteen genes
have been reported to be involved in the 17 steps, in- UGTs involved in SGs biosynthesis
cluding eight genes (DXS, DXR, MCT, CMK, MDS, HDS, Plant UDP-glycosyltransferases (UGTs) are a widely di-
HDR and IDI) in the initial seven steps, four genes vergent group of enzymes that transfer a sugar residue
(GGDPS, CPPS, KS and KO) in the next five steps and from an activated donor to an acceptor molecule [32]. In
four genes (KAH, UGT85C2, UGT74G1 and UGT76G1) Stevia, UGTs (such as UGT74G1 and UGT76G1) were
in the remaining five steps [2]. Using RNA-seq, we proposed to be involved in the production of SGs, which
investigated these reported genes using the data from were unique in the plant world because of their intense
the three genotypes to obtain more information about sweetness and high concentration in the leaf tissue. In
the transcription of these genes. All of the reported the study, we found 161 unigenes that were predicted to
genes were identified within the RNA-seq data, suggest- encode UDP-glycosyltransferases, including UGT85C2,
ing that they are all expressed. Two copies, comp51020 UGT74G1 and UGT76G1, which have been reported to
and comp68460, were found for the HDR gene (the 7th be involved in the SG biosynthetic pathway (Additional
step), and one copy (comp51020) had three alternative file 12). There were 121 UGTs expressed in the three ge-
splicing isoforms, which were comp51020_c0, comp51020_ notypes (RPKM >0). For each genotype, the expression
c1 and comp51020_c2. Three copies (comp54604_c0, of 141, 144 and 144 UGTs (RPKM >0) were detected in
comp61604_c0 and comp66218_c0) were found for SR-1, SR-2 and SR-3, respectively (Additional file 12).
KAH (the 13th step). Furthermore, one, two, and nine UGTs were specifically
We further investigated the expression levels of these expressed in SR-1, SR-2 and SR-3, respectively (Red
genes among the three genotypes. DXS, MDS, HDS, KO, UTGs in Additional file 12). Based on the expression
UGT85C2 and UGT76G1 were highly expressed in SR-1, levels of those UGTs in SR-1, SR-2 and SR-3, we classi-
SR-2 and SR-3 and showed obvious differences in ex- fied them into two groups (A and B). In group A, most
pression among the three genotypes. DXR, MCT, CMK, UGTs in SR-3 were highly expressed, whereas, the UGTs
HDR, IDI, KS, KAH and UGT74G1 were relatively lowly of SR-1 and SR-2, except for a few UGTs, showed low
expressed among the three genotypes (Figure 5A). Sur- expression. In contrast to the UGTs of SR-3 in group A,
prisely, the GGDPS gene, involved in the biosynthetic the UGTs in group B were expressed lowly. Most UGTs
pathway of an SG precursor (geranylgeranyl diphosphate) were highly expressed in SR-1 and SR-2, but about 1/3
was hardly detected in SR-1, SR-2 and SR-3 (Figure 5A). of the UGTs were relatively lowly expressed in SR-2
This might be due to the low expression of GGDPS (Additional file 4: Figure S7). The relationship between
among the three genotypes, which could not be detected these UGTs and the diverse SGs needs to be studied
by RNAseq. GDDPS was detected at very low levels by further.Chen et al. BMC Genomics 2014, 15:571 Page 8 of 11 http://www.biomedcentral.com/1471-2164/15/571 Figure 5 Expression patterns of genes involved in steviol glycosides biosynthesis for three chemical types (SR-1, SR-2 and SR-3) by DGE and qPCR. (A) Steviol glycosides biosynthesis genes detected by DGE. (B) Eight genes selected from above confirmed by qPCR. Results represent the means + standard deviation of triplicates. Conclusion genes encoding enzymes potentially involved in SG bio- We performed RNA-seq for three genotypes of Stevia, synthesis could be rapidly identified by this approach. which had different RA and ST contents. In total, 80,160 unigenes were identified and classified into 250 pathways. Methods A total of 10,070 SSRs and 44,510 SNPs were also identi- Plant materials fied. A total of 636, 2,464 and 2,041 unigenes showed dif- Three different chemical types of Stevia with divergent ferential expression in the comparison of SR-1 vs SR-2, SG composition from were selected in this study. Rou- SR-1 vs SR-3 and SR-2 vs SR-3. Moreover, the 315 uni- tinely, the Stevia leaves (3nd leaf from the top) were har- genes that ped between the two comparisons of SR-1 vs vested and collected for transcriptome sequencing in the SR-2 and SR-3 vs SR-2, were useful to identify the genes bud stage when the SGs peak. The plant leaves were related to the SG biosynthetic pathway. Our study pro- then cut into small pieces and were immediately frozen vided the first comprehensive report of the transcriptome in liquid nitrogen. All materials were stored at −80°C of Stevia and provided a comprehensive resource for the until further processing. research communities for Stevia or other closely related species. This study demonstrated the feasibility of using RNA isolation and library preparation for transcriptome a combination of RNA-Seq and DGE to identify and analysis study the genes involved in secondary metabolism for A total of 3 g RNA per sample was used as input mater- Stevia, a non-model herb plant. Moreover, candidate ial for the RNA sample preparations. All 3 samples had
Chen et al. BMC Genomics 2014, 15:571                                                                               Page 9 of 11
http://www.biomedcentral.com/1471-2164/15/571

RIN values above 8.0. Sequencing libraries were gener-           in order to retrieve proteins with the highest sequence
ated using Illumina TruSeq™ RNA Sample Preparation               similarity to the given unigenes along with putative
Kit (Illumina, San Diego, USA) following manufacturer’s          functional annotations. If results of different databases
recommendations, and 3 index codes were added to at-             conflicted, then Swiss-prot database results were given
tribute sequences to each sample. Briefly, mRNA was              precedence.
purified from total RNA using poly-T oligo-linked mag-
netic beads. Fragmentation was carried out using di-
                                                                 Polymorphism detection
valent cations under elevated temperature in Illumina
                                                                 The MISA program (http://pgrc.ipk-gatersleben.de/misa/
proprietary fragmentation buffer. First strand cDNA was
                                                                 misa.html) was used to detect simple sequence repeats
synthesized using random oligonucleotides and Super-
                                                                 (SSRs) among sequences in MSGI 1.0. The minimum
Script II. Second strand cDNA synthesis was subse-
                                                                 number of nucleotide repeats specified during SSR ana-
quently performed using DNA Polymerase I and RNase
                                                                 lysis was 20, 10, 7, 5, 5, and 5 for mono-, di-, tri-, tetra-,
H. Remaining overhangs were converted into blunt ends
                                                                 penta-, and hexanucleotide repeats, respectively. The
via exonuclease/polymerase activities and enzymes were
                                                                 maximum number of bases interrupting 2 SSRs in a
removed. After adenylation of 3′ ends of DNA frag-
                                                                 compound microsatellite was set at 100 bp. Primers span-
ments, Illumina PE adapter oligonucleotides were li-
                                                                 ning each SSR were designed using the default parameter
gated to prepare for hybridization. To select cDNA
                                                                 of the Primer3 program [33].
fragments of preferentially 200 bp in length the libra-
                                                                    For SNP detection, clean reads were aligned to the ref-
ry fragments were purified with AMPure XP system
                                                                 erence transcriptome using SOAP2 [34], then duplicated
(Beckman Coulter, Beverly, USA). DNA fragments with
                                                                 reads and multi-mapped reads were filtered from the
ligated adaptor molecules on both ends were selectively
                                                                 alignment results to eliminate the PCR interference and
enriched using Illumina PCR Primer Cocktail in a 10
                                                                 ambiguous mapping. SOAPsnp was used to call SNPs
cycle PCR reaction. Products were purified (AMPure
                                                                 based on the sorted alignment results [35]. SNPs quali-
XP system) and quantified using the Agilent high sensi-
                                                                 fied for the following standards were selected as the final
tivity DNA assay on the Agilent Bioanalyzer 2100 sys-
                                                                 SNP sets: quality score of not lower than 20 (in PHRED
tem. The clustering of the index-coded samples was
                                                                 scale), and base distance between two SNPs of greater
performed on a cBot Cluster Generation System using
                                                                 than 5.
TruSeq PE Cluster Kit v3-cBot-HS (Illumina) according
to the manufacturer’s instructions. After cluster gener-
ation, the library preparations were sequenced on an             Digital gene expression analysis
Illumina Hiseq 2000 platform and 100 bp paired-end               For digital gene expression analysis, differential expression
reads were generated.                                            analysis of two samples was performed using the DEGseq
                                                                 (2010) [29] R package. P values were adjusted using q
                                                                 values [36]. q value  1 was
Analysis of Illumina sequencing results                          set as the threshold for significantly differential expression.
The cDNA library was sequenced on the Illumina se-               Go enrichment analysis of the differentially expressed
quencing platform (GAII). Clean data (clean reads) were          genes (DEGs) was performed using the GOseq based
obtained by removing reads containing adapter, reads             Wallenius non-central hyper-geometric distribution [37],
containing poly-N and low quality reads from raw data.           which can adjust for gene length bias in DEGs. To correct
At the same time, Q20, Q30, GC-content and sequence              for selection bias in category testing, we employed the
duplication levels of the clean data were calculated. All        following three-step methodology: First, the genes that
the downstream analyses were based on clean data with            were significantly DEGs between conditions were identi-
high quality. The left files (read1 files) from all libraries/   fied. The GOseq method works with any procedure for
samples were pooled into one big left.fq file, and right         identifying DEGs. Second, the likelihood of DEGs as a
files (read2 files) into one big right.fq file. Transcrip-       function of transcript length was quantified by fitting a
tome assembly was accomplished based on the left.fq              monotonic function to DEGs versus transcript length.
and right.fq files using Trinity [20] with min_kmer_             Finally, the DEGs versus length function was incorpo-
cov set to 2 and all other parameters set to default.            rated into the statistical test of each category’s signifi-
Unigenes were used for BLAST searches with annota-               cance. This final step took into account the lengths
tion against the NCBI Nr database (NCBI non-redundant            of the genes that make up each category. KEGG path-
sequence database) using an E-value cut-off of 10–5              way enrichment analysis of the DEGs was done using
(E-value
Chen et al. BMC Genomics 2014, 15:571 Page 10 of 11
http://www.biomedcentral.com/1471-2164/15/571
BioPython (1.3.0) and Martel (0.9.0) to parse the KO to the method published previously [41]. The total glyco-
and KEGG GENES datasets. The parsed information side content was calculated as the sum of the contents of
was managed with SQLite, a small C library that stevioside and rebaudioside A.
implements a self-contained, embeddable and zero-
configuration SQL database engine. Blast2ko automa-
Availability of supporting data
tically annotated a set of new sequences (in FASTA
The data sets supporting the results of this article are in-
format) with KO functional terms. Pathfind identified
cluded within the article and its additional files.
both the frequent and the enriched pathways in a gi-
ven set of sequences. It calculated the FDR value by
invoking the GeneTS (2.3) [39] package of the R (2.00) Additional files
language [40] through RPy, an interface from Python to R.
KOBAS would run on most Linux systems, and execu- Additional file 1: GO classification of the unigenes expressed in
tables were freely available at http://kobas.cbi.pku.edu.cn/ Stevia leaf.
home.do. Additional file 2: KEGG classification of the unigenes expressed in
Stevia leaf.
Additional file 3: SSR markers identified in the unigenes expressed
Real-time quantitative RT-PCR (RT-qPCR) assay in Stevia leaf.
The total RNA from leaves of three samples was isolated Additional file 4: Figure S1. SSR density. Figure S2. Polymorphism of
using Qiagen RNA plant mini kit with on column the primers (SSR1-3) in 3 Stevia accessions. Figure S3. Pathway enrichment
DNAse digestion (Qiagen). Two micrograms total RNA by KEGG. A, B and C, statistics of pathway enrichment for SR-1, SR-2 and
SR-3, respectively. Figure S4. Enriched GO terms. A, B and C, GO term
was used for reverse transcription by M-MLVRT (Pro- enrichment for SR-1, SR-2 and SR-3, respectively. Figure S5. Pathway
mega) with oligo (dT18) primer, and 1 μL RT product enrichment by KEGG. A, B and C, statistics of pathway enrichment for SR-1
diluted to 20 μL ddH2O was used as template, three vs SR-2, down and up enriched KEGG pathways of SR-1 vs SR-2, respectively.
Figure S6. Pathway enrichment by KEGG. A, B and C, statistics of pathway
technical replicates and three biological replicates were enrichment for SR-3 vs SR-2, down and up enriched KEGG pathways of SR-3
applied for each gene expression analysis. Six hundred vs SR-2, respectively. Figure S7. Heat map of genes expressed in the steviol
nanograms total RNA was reverse transcribed using the glycosides biosynthesis process. A. UGTs in the comparison of SR-1 vs SR-2,
B. UGTs in the comparison of SR-2 vs SR-3.
Primescript RT reagent kit with gDNA eraser (TakaRa).
Additional file 5: Primers for SSR markers.
The cDNA diluted to 200 ng/μL was used for the qPCR
Additional file 6: SNP markers identified in the unigenes expressed
assay with each gene-specific primers and SsoFast Eva- in Stevia leaf.
Green supermix (Bio-Rad) on the Bio-Rad CFX96 real- Additional file 7: SNP markers identified in the unigenes expressed
time system. Reactions were performed at 95°C for 1 min, in Stevia leaf.
40 cycles of 95°C for 10s, and 58°C for 30s. All primers for Additional file 8: SNP markers identified in the unigenes expressed
RT-qPCR are listed in additional file 13. in Stevia leaf.
Additional file 9: Top 2% of unigenes in SR-1, SR-2 and SR-3.
Analysis of SGs by HPLC Additional file 10: The differently expressed unigenes of SR-2 vs
SR-1, SR-1 vs SR-3, and SR-2 vs SR-3.
The Stevia leaves were harvested and collected for tran-
Additional file 11: The overlapping unigenes between SR-2 vs SR-1
scriptome sequencing in the bud stage when the SGs and SR-2 vs SR-3, and the overlapping unigenes among SR-2 vs
peak, oven-dried, and powdered by using a grinder. The SR-1, SR-1 vs SR-3 and SR-2 vs SR-3.
extraction method of glycosides was based on the pub- Additional file 12: The unigenes predicted as UGTs.
lished method [39]. Briefly, for each sample, leaf powder Additional file 13: List of primers used for RT-QPCR.
(1.00 g) was first extracted with 50 mL of 80°C distilled
water for 3 h, with shaking once every hour. After that,
Abbreviations
the mixture was purified with 0.16 g of a mixture of DGE: Digital gene expression; KOBAS: KO-Based annotation system; MEP:
FeSO4 and CaCl2 (5:3) and centrifuged at 10,000 g for 2-Cmethyl-D-erythritol-4-phosphate pathway; GO: Gene ontology; KEGG: Kyoto
10 min, and the supernatant (30 mL) was diluted to encyclopedia of genes and genomes; DXS: 1-deoxy-D-xylulose-5-phosphate
synthase; DXR: 1-deoxy-D-xylulose-5-phosphate reductoisomerase;
50 mL with distilled water. Finally, the diluted super- MCT: 2-C-methyl-D-erythritol 4-phosphate cytidylyltransferase; CMK:
natant (2 mL) was filtered through a 1 μ m pore size 4-diphosphocytidyl-2-C-methyl-D-erythritol kinase; MDS: 2-C-methyl-D-
filter for measurement. Analyses were carried out by erythritol 2,4-cyclodiphosphate synthase; HDS: 4-hydroxy-3-methylbut-2-enyl
diphosphate synthase; HDR: (E)-4-hydroxy-3-methylbut-2-enyl diphosphate
HPLC (Agilent 1100, USA) using an Agilent carbohy- reductase; IDI: Isopentenyl diphosphate isomerase; IPI: Isopentenyl-
drate column of APS (250 × 4.6 mm, Phenomenex) main- diphosphate delta-isomerase; GGDPS: Geranylgeranyl diphosphate synthase;
tained at 30°C and the flow rate of 1.0 mL min−1. The CPPS: Copalyl diphosphate synthase; KS: Kaurene synthase; KO: Kaurene
oxidase; KAH: Kaurenoic acid hydroxylase; CYP450: Cytochrome P450;
mobile phase was acetonitrile/H2O (80:20). The UV de- UDPG: UDP-glucosyltransferase.
tector was set to a wavelength of 210 nm. Each sample
was assayed for 30 min. Identification and calculation of Competing interests
stevioside and rebaudio-side A were carried out according The authors declare that they have no competing interests.Chen et al. BMC Genomics 2014, 15:571 Page 11 of 11
http://www.biomedcentral.com/1471-2164/15/571
Authors’ contributions 20. Grabherr MG, Haas BJ, Yassour M, Levin JZ, Thompson DA, Amit I, Adiconis
JWC, KH, HCL and WW conceived and designed the experiment. JWC, WTY X, Fan L, Raychowdhury R, Zeng Q: Full-length transcriptome assembly
and BY participated in sample collection and RNA preparation. JWC and PQ from RNA-Seq data without a reference genome. Nat Biotechnol 2011,
analyzed and interpreted the sequence data. JWC, PQ, KH and WW drafted 29(7):644–652.
and revised the manuscript. All authors read and approved the final manuscript. 21. Altschul SF, Madden TL, Schaffer AA, Zhang J, Zhang Z, Miller W, Lipman DJ:
Gapped BLAST and PSI-BLAST: a new generation of protein database
Acknowledgements search programs. Nucleic Acids Res 1997, 25(17):3389–3402.
We acknowledge the Novogene at Beijing for its assistance in original data 22. Ashburner M, Ball CA, Blake JA, Botstein D, Butler H, Cherry JM, Davis AP,
processing and related bioinformatics analysis. This work was supported by Dolinski K, Dwight SS, Eppig JT: Gene ontology: tool for the unification of
“double support project” in Sichuan agricultural university (grant No.03570313). biology. Nat Genet 2000, 25(1):25–29.
23. Kanehisa M, Goto S, Sato Y, Furumichi M, Tanabe M: KEGG for integration
Author details and interpretation of large-scale molecular data sets. Nucleic Acids Res
1
Agronomy College of Sichuan Agricultural University, Wenjiang, Chengdu, 2012, 40(D1):109–114.
Sichuan 611130, China. 2Rice Research Institute of Sichuan Agricultural 24. Tanksley SD: Molecular markers in plant breeding. Plant Mol Biol Rep 1983,
University, Wenjiang, Chengdu, Sichuan 611130, China. 3Current address: 1(1):3–8.
Agronomy College of Guizhou University, Guiyang Huaxi, Guizhou 550025, 25. Xu Y, Crouch JH: Marker-assisted selection in plant breeding: from
China (HCL). 4Current address: Agricultural Bureau of Leshan, Sichuan 614000, publications to practice. Crop Sci 2008, 48(2):391–407.
China (WTY). 26. Varshney RK, Graner A, Sorrells ME: Genic microsatellite markers in plants:
features and applications. Trends Biotechnol 2005, 23(1):48–55.
Received: 16 December 2013 Accepted: 18 June 2014 27. Li R, Li Y, Fang X, Yang H, Wang J, Kristiansen K, Wang J: SNP detection for
Published: 7 July 2014 massively parallel whole-genome resequencing. Genome Res 2009,
19(6):1124–1132.
28. Mortazavi A, Williams BA, McCue K, Schaeffer L, Wold B: Mapping and
References quantifying mammalian transcriptomes by RNA-Seq. Nat Methods 2008,
1. Yadav AK, Singh S, Dhyani D, Ahuja PS: A review on the improvement of 5(7):621–628.
stevia [Stevia rebaudiana (Bertoni)]. Can J Plant Sci 2011, 91(1):1–27. 29. Wang L, Feng Z, Wang X, Wang X, Zhang X: DEGseq: an R package for
2. Brandle J, Telmer P: Steviol glycoside biosynthesis. Phytochemistry 2007, identifying differentially expressed genes from RNA-seq data.
68(14):1855–1863. Bioinformatics 2010, 26(1):136–138.
3. Wölwer-Rieck U: The leaves of Stevia rebaudiana (Bertoni), their 30. Tang Q, Ma X, Mo C, Wilson IW, Song C, Zhao H, Yang Y, Fu W, Qiu D: An
constituents and the analyses thereof: a review. J Agric Food Chem 2012, efficient approach to finding Siraitia grosvenorii triterpene biosynthetic
60(4):886–895. genes by RNA-seq and digital gene expression analysis. BMC Genomics
4. Gardana C, Scaglianti M, Simonetti P: Evaluation of steviol and its 2011, 12(1):343.
glycosides in Stevia rebaudiana leaves and commercial sweetener by 31. Kumar H, Kaul K, Bajpai-Gupta S, Kaul VK, Kumar S: A comprehensive
ultra-high-performance liquid chromatography-mass spectrometry. analysis of fifteen genes of steviol glycosides biosynthesis pathway in
J Chromatogr A 2010, 1217(9):1463–1470. Stevia rebaudiana (Bertoni). Gene 2012, 492(1):276–284.
5. Corcuff JB, Brossaud J: Rebaudioside A and cortisol metabolism: sweet 32. Ross J, Li Y, Lim E, Bowles DJ: Higher plant glycosyltransferases. Genome
news for consumers. Clin Chimica Acta 2014, 431:276–277. Biol 2001, 2(2):1–6. REVIEWS3004.
6. Brandle J, Starratt A, Gijzen M: Stevia rebaudiana: its agricultural, 33. Untergasser A, Cutcutache I, Koressaar T, Ye J, Faircloth BC, Remm M,
biological, and chemical properties. Can J Plant Sci 1998, 78(4):527–536. Rozen SG: Primer3—new capabilities and interfaces. Nucleic Acids Res
7. Goyal SK, Samsher, Goyal RK: Stevia (Stevia rebaudiana) a bio-sweetener: a 2012, 40(15):e115.
review. Int J Food Sci Nutr 2010, 61(1):1–10. 34. Li R, Yu C, Li Y, Lam T-W, Yiu S-M, Kristiansen K, Wang J: SOAP2: an improved
8. Prakash Chaturvedula VS, Prakash I: A new Diterpene Glycoside from ultrafast tool for short read alignment. Bioinformatics 2009, 25(15):1966–1967.
Stevia rebaudiana. Molecules 2011, 16(4):2937–2943. 35. Langmead B, Schatz MC, Lin J, Pop M, Salzberg SL: Searching for SNPs with
9. Totté N, Ende WV, Van Damme EJ, Compernolle F, Baboeuf I, Geuns JM: cloud computing. Genome Biol 2009, 10(11):134.
Cloning and heterologous expression of early genes in gibberellin and 36. Storey JD, Tibshirani R: Statistical significance for genomewide studies.
steviol biosynthesis via the methylerythritol phosphate pathway in Proc Natl Acad Sci U S A 2003, 100(16):9440–9445.
Stevia rebaudiana. Can J Bot 2003, 81(5):517–522. 37. Young MD, Wakefield MJ, Smyth GK, Oshlack A: Method gene ontology
10. Chaturvedi P, Misra P, Tuli R: Sterol glycosyltransferases—the enzymes analysis for RNA-seq: accounting for selection bias. Genome Biol 2010,
that modify sterols. Appl Biochem Biotech 2011, 165(1):47–68. 11:R14.
11. Madan S, Ahmad S, Singh G, Kohli K, Kumar Y, Singh R, Garg M: Stevia 38. Mao X, Cai T, Olyarchuk JG, Wei L: Automated genome annotation and
rebaudiana (Bert.) Bertoni-a review. Indian J Nat Prod Resour 2010, pathway identification using the KEGG Orthology (KO) as a controlled
1(3):267–286. vocabulary. Bioinformatics 2005, 21(19):3787–3793.
12. Chatsudthipong V, Muanprasat C: Stevioside and related compounds: 39. Wichert S, Fokianos K, Strimmer K: Identifying periodically expressed
therapeutic benefits beyond sweetness. Pharmacol Ther 2009, 121(1):41–54. transcripts in microarray time series data. Bioinformatics 2004, 20(1):5–20.
13. Chaturvedula VS, Prakash I: A new diterpene glycoside from Stevia 40. Storey JD: A direct approach to false discovery rates. J R Stat Soc Series B
rebaudiana. Molecules 2011, 16(4):2937–2943. Stat Methodol 2002, 64(3):479–498.
14. Ekblom R, Galindo J: Applications of next generation sequencing in 41. Woelwer-Rieck U, Lankes C, Wawrzun A, Wüst M: Improved HPLC method
molecular ecology of non-model organisms. Heredity 2010, 107(1):1–15. for the evaluation of the major steviol glycosides in leaves of Stevia
15. Yang SS, Tu ZJ, Cheung F, Xu WW, Lamb JF, Jung H-JG, Vance CP, Gronwald rebaudiana. Eur Food Res Technol 2010, 231(4):581–588.
JW: Using RNA-Seq for gene identification, polymorphism detection and
transcript profiling in two alfalfa genotypes with divergent cell wall
doi:10.1186/1471-2164-15-571
composition in stems. BMC Genomics 2011, 12(1):199.
Cite this article as: Chen et al.: RNA-Seq for gene identification and
16. Haas BJ, Zody MC: Advancing RNA-seq analysis. Nat Biotechnol 2010, transcript profiling of three Stevia rebaudiana genotypes. BMC Genomics
28(5):421. 2014 15:571.
17. Ilut DC, Coate JE, Luciano AK, Owens TG, May GD, Farmer A, Doyle JJ: A
comparative transcriptomic study of an allotetraploid and its diploid
progenitors illustrates the unique advantages and challenges of
RNA-seq in plant species. Am J Bot 2012, 99(2):383–396.
18. Iyer MK, Chinnaiyan AM: RNA-Seq unleashed. Nat Biotechnol 2011, 29(7):599.
19. Henschel R, Nista PM, Lieber M, Haas BJ, Wu L-S, LeDuc RD: Proceedings of the
1st Conference of the Extreme Science and Engineering Discovery Environment:
bridging from the eXtreme to the campus and beyond. 2012:45. ACM.You can also read