Scottish Government Central Analysis Division State of the Epidemic in Scotland - 25 March 2022 Background - The ...
←
→
Page content transcription
If your browser does not render page correctly, please read the page content below
Scottish Government Central Analysis Division

State of the Epidemic in Scotland – 25 March 2022

Background
This report summarises the current situation of the Covid-19 epidemic in Scotland. It
brings together the different sources of evidence and data about the epidemic in
Scotland at this point in time, why we are at that place, and what is likely to happen
next. This updates the previous publication published on 18 March 20221. The
information in this document helps the Scottish Government, the health service and
the wider public sector respond to the epidemic and put in place what is needed to
keep us safe and treat people who have the virus.

This edition of the State of the Epidemic summarises current data on Covid-19 at a
national and local level, and how Scotland currently compares to the rest of the UK.
It looks at the vaccination program in Scotland and its impact. Information is provided
about variants of concern and what impact these may have. Bringing this information
together in one place gives the opportunity to better understand the current state of
the epidemic in Scotland.

The State of the Epidemic report this week will summarise data up to and including
23 March 2022.

Notice on Change to Publication Schedule

The Scientific Pandemic Influenza Group on Modelling (SPI-M-O) and the United
Kingdom Health Security Agency (UKHSA) have been consulting on reducing the
frequency of modelling for R, incidence, growth rates and medium term projections
to fortnightly from weekly starting from 1 April . This consultation is complete and
UKHSA are therefore introducing a change in the frequency that Covid-19 estimates
are published, to every two weeks from 1 April. As a consequence, the Modelling the
Epidemic report is moving to a fortnightly publication schedule. To align with the
Modelling the Epidemic report, the State of the Epidemic report will also move to
publishing every two weeks. The State of the Epidemic report will be published on 1
April 2022, 14 April 2022 (brought forward due to public holiday), 29 April 2022, and
fortnightly thereafter.

1   Scottish Government: Coronavirus (Covid-19): state of the epidemic - gov.scot (www.gov.scot)

                                                                                                   i
Contents
Background ............................................................................................................... i
Summary ................................................................................................................... 1
   Key Points .............................................................................................................. 1
   Method.................................................................................................................... 3
Estimated Infection Levels and Case Numbers ..................................................... 4
   Estimated Infection Levels ...................................................................................... 4
   Wastewater Estimates ............................................................................................ 5
   Covid Infection Survey ............................................................................................ 6
   Omicron BA.2 ......................................................................................................... 8
   Covid-19 Cases .................................................................................................... 10
   Reinfections .......................................................................................................... 12
   LFD Testing .......................................................................................................... 13
Severe Illness: Hospitalisation, ICU and Deaths ................................................. 15
   Hospital and ICU Occupancy and Admissions ..................................................... 15
   Deaths .................................................................................................................. 18
Resilience: Vaccinations, Antibody Estimates, and Variants ............................ 20
   Vaccinations ......................................................................................................... 20
   Antibodies Estimates ............................................................................................ 21
   Vaccine Effectiveness Against Omicron ............................................................... 22
Situation by Local Authority within Scotland ...................................................... 23
Looking ahead ........................................................................................................ 24
   Scottish Contact Survey ....................................................................................... 24
   Modelling the Epidemic ......................................................................................... 25
   Long Covid ........................................................................................................... 25
Next steps ............................................................................................................... 26
Technical Annex ..................................................................................................... 27

                                                                                                                             ii
Summary
The daily positivity estimate from the Covid-19 Infection Survey for Scotland
continued to increase in the most recent week, reaching the highest estimated
percentage of people testing positive since the survey began reporting for Scotland
in October 2020. After sharply increasing case rates and Wastewater Covid-19 RNA
levels in recent weeks, wastewater Covid-19 RNA levels have continued to increase,
but at a slower rate. Meanwhile, the weekly case rate (including reinfections) in
Scotland has decreased slightly in the most recent week. However, it is too early to
say if this is a sustained trend. The prevalence of the dominant variant Omicron BA.2
in Scotland has continued to increase in the most recent week.
The Covid-19 Infection Survey estimates that Covid-19 positivity levels are rising
among older age groups in recent weeks. For context, case rates also continued to
increase among older age groups in the week to 20 March, but there are early signs
that the rapid increase seen in recent weeks may be slowing down.
Covid-19 related daily hospital occupancy has continued to increase in the most
recent week, reaching the highest levels seen throughout the pandemic. Combined
ICU occupancy has decreased in the most recent week, but low numbers in ICU
occupancy mean that the data is sensitive to small changes. Weekly average
hospital admissions have increased in the past four weeks, however, caution must
be advised when interpreting the latest data as we are currently seeing a large
number of daily revisions. Those aged 60 or older continue to represent the majority
of hospital admissions, but the average number of hospital admissions for children
and young people has reached its highest levels so far in the pandemic. The weekly
number of Covid-19 deaths has remained unchanged since last week, with the
majority of deaths occurring in those aged 65 and over.
Key Points
The UK Health Security Agency’s (UKHSA) consensus estimate for R in
Scotland as at 8 March is between 1.0 and 1.3. The lower and upper limit of the
R value have remained unchanged since the last published figure.
The latest growth rate for Scotland as at 8 March was between 1% and 4%.
The upper and lower growth limits have increased since the previous week.
As determined through the latest weekly ONS Covid-19 Infection Survey (CIS),
in Scotland, the percentage of people living in private residential households
testing positive for Covid-19 continued to increase in the week 14 to 20 March
2022 to 9.00% (95% credible interval: 8.28% to 9.73%)2, equating to around 1
in 11 people (95% credible interval: 1 in 12 to 1 in 10). In the latest three weeks
of the survey, the estimates of positivity have surpassed the previous peak from
early January 2022 to be the highest estimates since the survey began
reporting for Scotland in October 2020.
2 A credible interval gives an indication of the uncertainty of an estimate from data analysis based on a sample
population. 95% credible intervals are calculated so that there is a 95% probability of the true value lying in the
interval.
1 Nationwide, wastewater Covid-19 levels have continued to increase in the week
ending 22 March, however, the rate of increase appears to have slowed down.
The week ending on 22 March saw levels of around 212 million gene copies
per person per day (Mgc/p/d), an increase of only 3% from 205 Mgc/p/d the
week ending 15 March.
The sublineage Omicron BA.2 is now the dominant variant in Scotland, and its
incidence is increasing. The Covid-19 Infection Survey estimated that 7.05%
(95% credible interval: 6.40% to 7.73%) of the private residential population
would have tested positive with a Covid-19 infection compatible with BA.2 on
17 March. Of the new cases in Scotland that were notified on 18 March from
UKGov laboratories, 90.1% were S gene positive, which is used as a
reasonable proxy for tracking Omicron BA.2.
By specimen date, the seven-day combined PCR and LFD case rate (including
reinfections) has decreased slightly in the most recent week. There were 1,534
weekly combined PCR and LFD cases per 100,000 population in the week to
20 March, which is a slight 4% decrease from 1,591 weekly cases per 100,000
on 13 March.
The week leading up to 20 March saw decreasing case rates in all age groups
younger than 50 compared to the week ending 13 March. Case rates among
older age groups have been increasing since mid-February, and the most
recent week continued to see a further increase for those aged 50 and older but
there are early signs that the rapid increase seen in recent weeks may be
slowing down.
In the week to 20 March, there were 786 reported cases among care home
residents, which is at a similar level to the previous week ending 13 March (782
cases). This is lower than previous peak of 833 weekly cases in the week to 9
January 2022, but higher than the peak of 641 weekly cases in the week to 10
January 2021.
The proportion of reinfections among total weekly cases has increased in the
most recent week to 20 March to 10.0% of cases, which is the highest level of
reinfections seen in the pandemic.
In the week to 23 March, daily Covid-19 hospital occupancy continued to
increase to the highest level reported throughout the pandemic. NHS boards
reported 2,257 patients in hospital or in short stay ICU on 23 March, a 13%
increase compared to the previous week. Combined ICU occupancy has
decreased by 9 patients on 23 March compared to a week previously, to a total
of 32 patients.
There has been an increasing trend in Covid-19 admissions to hospital over the
past month. The latest data shows that there were 1,341 admissions to hospital
for people with confirmed Covid-19 in the week to 19 March which is a 41%
increase from four weeks prior (week to 19 February). There has been a
fluctuating trend in Covid-19 admissions to ICU over the past month. There are
2a large number of daily revisions to admissions data, so the number of
admissions for the latest week is likely to change.
According to data from the PHS Education Dashboard, average hospital
admissions related to Covid-19 in children and young adults have continued to
increase in the three-week period to 16 March, and have reached the highest
levels seen in the pandemic, at 163 average weekly admissions.
The overall number of Covid-19 deaths has remained unchanged in the week
leading up to 20 March compared to the week leading up to 13 March, at a total
of 118 deaths.
In the week leading up to 20 March 2022, Na h-Eileanan Siar had the highest
combined PCR and LFD weekly case rate by specimen date, reporting 3,079
cases per 100,000 population. Orkney Islands had the lowest weekly combined
LFD and PCR case rate in the same time period, reporting 902 cases per
100,000.
Method
This report brings together a wide range of publicly available figures from a range of
data sources. These include publications by Scottish Government, Public Heath
Scotland, National Records of Scotland and Office for National Statistics along with
scientific publications and SAGE and UKHSA summaries where appropriate to
summarise the state of the epidemic in Scotland in a given week. We also provide
information on public attitudes to the virus from weekly YouGov polling surveys.
3Estimated Infection Levels and Case Numbers
Estimated Infection Levels
The reproduction number (R) is the average number of secondary infections
produced by a single infected person. If R is greater than one the epidemic is
growing, if R is less than one the epidemic is shrinking. The higher R is above
one, the more people one infectious person might further infect and so the faster
the epidemic grows. Please note that R is an indicator that lags by two or
three weeks. For more information please visit the UK government website.
The UK Health Security Agency’s (UKHSA) consensus estimate for R in Scotland as
at 8 March is between 1.0 and 1.3. The lower and upper limit of the R value have
remained unchanged since the last published figure (Figure 1)3 4.
Figure 1: R in Scotland over time by publishing week5
1.6
1.4
1.2
1
0.8
0.6
0.4
Jul 2021
Nov 2021
Dec 2021
May 2021
Aug 2021
Sep 2021
Mar 2021
Jun 2021
Jan 2022
Mar 2022
Feb 2022
Oct 2021
Apr 2021
UKHSA was unable to form a consensus view on the incidence of new daily
infections in Scotland as at 8 March6.
3 Scottish Government: Coronavirus (Covid-19): modelling the epidemic
4
Using data to 21 March 2022.
5 No R value was published for the week beginning 27 December 2021 as publications were paused over the
festive period. The most recent data point for R is dated 23 March 2022, reflecting the R value as at 8 March.
6 Scottish Government: Coronavirus (Covid-19): modelling the epidemic
4The growth rate reflects how quickly the numbers of infections are changing day
by day. It is an approximation of the percentage change in the number of new
infections each day. More information can be found on the UK government
website.
The latest growth rate for Scotland as at 8 March was between 1% and 4%. The
upper and lower growth limits have increased since the previous week7 8.
Wastewater Estimates
The Scottish Government has been working with the Scottish Environment
Protection Agency (SEPA) to detect and analyse fragments of Covid-19 virus
RNA in wastewater. The number of locations where the levels of SARS-CoV-2 in
wastewater are monitored has increased to 141 sites around Scotland. In
contrast to Covid-19 case records, virus shedding into wastewater is a biological
process. This means that wastewater data is unaffected by factors that impact
whether testing is done.
Nationwide, wastewater Covid-19 levels have increased again, albeit at a slower rate
than in recent weeks. The week ending 22 March saw levels of around 212 million
gene copies per person per day (Mgc/p/d), an increase of 3% from 205 Mgc/p/d the
week ending 15 March (Figure 2)9.
While there are increases in wastewater Covid-19 levels across much of Scotland,
10 local authorities have decreased their levels over the past week. Decreases were
reported in Aberdeen, Aberdeenshire, East Ayrshire, Highland, North Ayrshire, North
Lanarkshire, Scottish Borders, South Ayrshire, South Lanarkshire and Stirling.
Please note that comparisons for Moray, Na h-Eileanan Siar, Shetland Islands and
Orkney Islands are not possible due to sampling coverage.
7 Using data to 21 March 2022.
8 Scottish Government: Coronavirus (Covid-19): modelling the epidemic
9 Scottish Government: Coronavirus (Covid-19): modelling the epidemic
5Figure 2: National running average trends in wastewater Covid-19 from 31
December 2021 to 22 March 2022, and CIS positivity estimates from 31
December to 12 March 202210 11 12.
Covid Infection Survey
The Covid-19 Infection Survey is a UK wide study carried out by the Office for
National Statistics (ONS) and the University of Oxford. The survey invites private
residential households to test whether they have the infection, regardless of
whether they have symptoms, using a PCR test. This means the study is
unaffected by testing policy changes in early 2022. Participants are also asked to
provide a blood sample to test for antibodies.
In Scotland, the percentage of people testing positive for Covid-19 as estimated by
the Covid Infection Survey continued to increase in the week ending 20 March 2022,
as seen in Figure 313. Meanwhile, the case rate (including reinfections) by specimen
date has shown a slight decrease in Scotland in the week to 20 March. The increase
in estimated infection levels in Scotland has correlated with the increasing
prevalence of the Omicron BA.2 variant in Scotland since early February.
The estimated percentage of people testing positive for Covid-19 in the private
residential population in the week 14 to 20 March in Scotland is 9.00% (95% credible
interval: 8.28% to 9.73%)14, equating to around 1 in 11 people (95% credible interval:
1 in 12 to 1 in 10). In the latest three weeks, the estimates of positivity have
10 Scottish Government: Coronavirus (Covid-19): modelling the epidemic
11 This chart shows data from early 2022, at which point the Omicron variant represents almost all cases in
Scotland.
12 Figure three was originally published on 17 March 2022, before updated CIS estimates were available for
publication. See the following section for updated figures.
13 Scottish Government: Coronavirus (COVID-19): infection survey
14 A credible interval gives an indication of the uncertainty of an estimate from data analysis based on a sample
population. 95% credible intervals are calculated so that there is a 95% probability of the true value lying in the
interval.
6surpassed the previous peak from early January 2022 to be the highest estimates
since the survey began reporting for Scotland in October 2020.
In the week 13 to 19 March 202215, estimates for the other nations of the UK are as
follows and can be seen in Figure 3:
In England, the percentage of people testing positive continued to increase:
6.39% (95% credible interval: 6.21% to 6.58%), equating to around 1 in 16
people (95% credible interval: 1 in 16 to 1 in 15).
In Wales, the percentage of people testing positive continued to increase:
6.35% (95% credible interval: 5.62% to 7.13%), equating to around 1 in 16
people (95% credible interval: 1 in 18 to 1 in 14).
In Northern Ireland, the percentage of people testing positive decreased:
5.92% (95% credible interval: 5.04% to 6.87%), equating to around 1 in 17
people (95% credible interval: 1 in 20 to 1 in 15).
Figure 3: Modelled daily estimates of the percentage of the private residential
population testing positive for COVID-19 in the four UK nations, between 7
February and 20 March 2022 for Scotland, and 7 February and 19 March for
England, Wales and Northern Ireland, including 95% credible intervals.
In Scotland, the percentage of people testing positive has increased for those in
older age groups in recent weeks. The latest trends for those of nursery and primary
15 Please note different reference dates for Scotland and other three nations. The ONS aims to
provide the estimates of positivity rate that are most timely and representative of each week, and
decides the most recent week to report on based on the availability of test results. On most
occasions, the reference dates align perfectly, but sometimes this is not feasible. For more
information see section “11. Measuring the data” in Coronavirus (COVID-19) Infection Survey, UK: 18
March 2022
7schools age, secondary school age and young adults are uncertain16. Meanwhile,
the case rates (including reinfections) by specimen date show a slight decrease
among those aged 50 or younger in the week to 20 March compared to the previous
week, while the rapid rise in case rates among older age groups is showing early
signs of slowing down17.
Omicron BA.2
The Omicron variant was first detected in Scotland on 29 November 202118. It had a
growth advantage over the previously dominant Delta variant, but a lower clinical
severity. The parent variant (Pango lineage B.1.1.529) can now be separated into
three main groups: BA.1, BA.2 and BA.3. The BA.1 lineage of Omicron was originally
dominant within Scotland, however, the first specimen date reported for BA.2 was 23
December 2021; BA.2 is now the dominant variant in Scotland and its incidence is
increasing19. The latest BA.2 risk assessment update issued on 25 February
indicates that BA.2 has a growth advantage compared to BA.1; however, it is likely
that the clinical severity of BA.2 is similar to that of BA.120. The increasing
prevalence of BA.2 has correlated to increasing Covid-19 prevalence in Scotland
since mid-February.
According to estimates from the Covid-19 Infection Survey, the proportion of people
with Covid-19 infections compatible with Omicron BA.2 in Scotland continued to
increase in the most recent week to 20 March, while the percentage of people with
infections compatible with the Omicron BA.1 decreased in the most recent two
weeks, but the trend is uncertain in the most recent week (Figure 4). The Covid
Infection Survey estimated that 7.05% (95% credible interval: 6.40% to 7.73%) of the
private residential population would test positive with a Covid-19 infection compatible
with BA.2 on 17 March21.
16 Scottish Government: Coronavirus (Covid-19): infection survey
17 Scottish Government: Coronavirus (COVID-19): trends in daily data (accessed 23 March 2022)
18 Scottish Government: Omicron variant
19 Public Health Scotland: COVID-19 statistical report
20 Risk assessment for SARS-CoV-2 variant: VUI-22JAN-01 (BA.2) 23 January 2022 (publishing.service.gov.uk)
21 Scottish Government: Coronavirus (COVID-19): infection survey
8Figure 4: Modelled percentage of infections compatible with the Omicron BA.1
variant and Omicron BA.2 variant, based on nose and throat swabs, daily, in
Scotland, 7 February to 20 March 202222.
Unlike Omicron BA.1, BA.2 does not contain the deletion that leads to S Gene
Target Failure in a widely used PCR testing platform available at UKGov Pillar 2
Lighthouse Laboratories. This is used as a reasonable proxy to track BA.2 as
opposed to BA.1. UKGov laboratories process around 85% of PCR tests in Scotland,
and of the new cases in Scotland that were notified on 18 March from UK
Government laboratories, 90.1% were S gene positive. This is an increase from
84.2% of cases on 11 March23.
Details of risk assessments for both BA.1 and BA.2 carried out by UKHSA can be
found on the UK government’s website24 and in the State of the Epidemic reports
published on 4 February and 28 January 2022. For more information on vaccine
effectiveness and Omicron BA.2, please see the Vaccine Effectiveness Against
Omicron section.
22
Scottish Government: Coronavirus (COVID-19): infection survey
23 Public Health Scotland: COVID-19 statistical report - 23 March 2022 - COVID-19 statistical report
24 https://www.gov.uk/government/publications/investigation-of-sars-cov-2-variants-of-concern-variant-risk-
assessments
9Covid-19 Cases
Please note that from 5 January, the Covid-19 case definition includes cases
confirmed by either a PCR or LFD test, or both. Comparisons over time need to
be made with caution. For more information on the difference between reporting
and specimen date, please see this earlier publication. Cases data by specimen
date includes reinfections (where a person has a positive test 90 days or more
since their last positive test) since the beginning of the pandemic, while cases
data by reporting date includes reinfections starting from 1 March.
In previous reports there was an update on Covid-19 cases by reporting date to give
readers an indication of the most recent data. However, due to the inclusion of
reinfections on 1 March and technical issues experienced by PHS in the days to 15
March, cases by reporting date do not yet show a reliable trend and this analysis has
therefore been excluded.
By specimen date, the seven-day combined PCR and LFD case rate (including
reinfections) decreased slightly in Scotland in the week leading up to 20 March. This
follows a period of sharply increasing case rates from late February. There were
1,534 weekly combined PCR and LFD cases per 100,000 population in the week to
20 March, which is a 4% decrease from 1,591 weekly cases per 100,000 on 13
March. This remains a very high case rate compared to previous phases of the
pandemic in Scotland (Figure 5)25.
Comparisons with data from before 5 January 2022 must be made with caution as
differences are likely to reflect changes in testing behaviour and policy rather than
changing infection levels alone.
Figure 5: Seven-day combined PCR and LFD case rate (including reinfections)
per 100,000 for Scotland by specimen date. Data to 20 March 202226.
2,500
Seven-day Case Rate per
From 5 Jan
2,000 2022 cases
include PCR
1,500 and LFD
100,000
confirmed
1,000 cases
500
0
Sep 2020
May 2020
Jul 2020
Nov 2020
Dec 2020
May 2021
Jul 2021
Nov 2021
Dec 2021
Aug 2020
Aug 2021
Sep 2021
Mar 2020
Jun 2020
Jan 2021
Feb 2021
Mar 2021
Jun 2021
Jan 2022
Feb 2022
Mar 2022
Oct 2020
Oct 2021
Apr 2020
Apr 2021
Specimen date
25 Public Health Scotland: Covid-19 Daily Dashboard (accessed 23 March 2022)
26 Before 5 January 2022, the case rate includes only positive laboratory confirmed PCR tests.
10The week leading up to 20 March saw decreasing case rates in all age groups
younger than 50 compared to the week ending 13 March. Case rates among older
age groups have been increasing since mid-February, and the most recent week
continued to see a slight increase for those aged 50 and older which ranged from 3%
among those aged 50 to 59, to 7% among those aged 80 or older. However, there
are early signs the rise in case rates among older age groups has started to slow
down in the most recent days (Figure 6)27.
Figure 6: Weekly total combined PCR and LFD cases (including reinfections)
per 100,000 population in Scotland by age group, by specimen date. Data to 20
March 202228 29.
4,000
From 5 Jan
2022 cases
Weekly Case Rate per 100,000
3,500
include PCR 40 to 49
3,000 and LFD
confirmed 20 to 39
2,500 cases 50 to 59
2,000 All Scotland
19 or younger
1,500
60 to 69
1,000 70 to 79
500 80 or older
-
Dec 2021 Jan 2022 Feb 2022 Mar 2022
Rising numbers of weekly Covid-19 cases among care home residents throughout
February and March were in line with the increasing case numbers among older age
groups in the same period. In the week to 20 March, there were 786 reported cases
among care home residents, which is at a similar level to the previous week ending
13 March (782 cases). The number of cases in the most recent week is lower than
the previous peak of 833 weekly cases in the week to 9 January 2022, but higher
than the peak of 641 weekly cases in the week to 10 January 202130.
27
Public Health Scotland: Covid-19 Daily Dashboard (accessed 23 March 2022)
28 Before 5 January 2022, the case rate includes only a positive laboratory confirmed PCR tests.
29 Scottish Government: Coronavirus (COVID-19): trends in daily data (accessed 23 March 2022)
30 Scottish Government: Coronavirus (COVID-19): trends in daily data (accessed 23 March 2022)
11Due to different case definitions across the UK, comparisons between
countries cannot be made at this time. The four nations rely on different sets of
Covid-19 tests for reporting cases. Cases data from Scotland includes PCR and
LFD test results. Cases data from England includes PCR, LFD and LAMP (loop-
mediated isothermal amplification) test results. For both Scotland and England,
positive rapid lateral flow test results can be confirmed with PCR tests taken
within 48 hours and if this PCR test result is negative, these are removed as
cases. Cases data from Northern Ireland includes both PCR and LFD tests
results, while cases data from Wales relies only on PCR test results. Cases from
Scotland, Northern Ireland and England include reinfections based on a 90-day
threshold, while cases data from Wales includes reinfections based on a 42-day
threshold.
Due to the different case definitions outlined above, we have not included case
comparisons across the four UK nations using data from the UK Government
dashboard in this edition of the report. When these definitions are more aligned we
will resume reporting on these comparisons. To compare trends in estimated
infection levels in private residential households across the UK, please see the
previous section on the Covid Infection Survey.
Reinfections
A reinfection is defined as a positive test 90 days or more after a previous
positive test. This amount of time is set in order to be able to distinguish
between viral persistence of the primary Covid-19 episode and a true reinfection.
The increase in the proportion of reinfections seen in late 2021 corresponds to the
emergence of the now dominant Omicron BA.1 variant in the UK. The proportion of
reinfections in Scotland when Omicron BA.1 was first detected on 29 November31
was 0.8% percent of total cases. These are cases in individuals for whom it has
been 90 or more days since their last positive Covid-19 test.
The proportion of reinfections among the total weekly cases has increased in the
most recent week. By specimen date, there was a total number of 8,418 reinfection
cases confirmed by either a PCR or LFD test in the week leading up to 20 March.
These are cases in individuals for whom it has been 90 or more days since their last
positive Covid-19 test. This represents 10.0% of reported cases and compares to
9.7% in the week leading up to 13 March. This is the highest level of reinfections
seen in the pandemic (Figure 7).
31 Scottish Government: Omicron variant
12Figure 7: Number of PCR and LFD positive cases by episode of infection and
specimen date. Data to 20 March 202232.
30,000 15.0%
Weekly proportion of Reinfections
From 5 Jan
25,000 2022 cases 12.5%
Low testing
include PCR
Daily New Cases
numbers
20,000 and LFD 10.0%
confirmed
15,000 cases 7.5%
10,000 5.0%
5,000 2.5%
0 0.0%
Jul 2020
Nov 2020
Jul 2021
Nov 2021
May 2020
May 2021
Mar 2020
Sep 2020
Jan 2021
Mar 2021
Sep 2021
Jan 2022
Mar 2022
Reinfections First Infections % Reinfections
LFD Testing
The weekly number of reported LFD tests peaked on 26 December 2021 with
867,417 reported tests, and showed a decreasing trend until early March33. The
weekly total of tests reported in the week to 20 March increased by 9% from the
previous week leading up to 13 March. There were 630,799 reported tests in the
week to 20 March (Figure 8)34.
32 Public Health Scotland: Covid-19 Daily Dashboard (accessed 23 March 2022)
33 Public Health Scotland: Covid-19 Statistical Report (accessed 23 March 2022)
34 Public Health Scotland: Covid-19 Statistical Report (accessed 23 March 2022)
13Figure 8: Weekly Number of Reported LFD Tests. Data up to the 20 March
2022.
1,000,000
Number of LFD Tests Reported
800,000
600,000
400,000
200,000
0
Dec 2020
May 2021
Jul 2021
Nov 2021
Dec 2021
Aug 2021
Sep 2021
Jan 2021
Feb 2021
Mar 2021
Jun 2021
Jan 2022
Feb 2022
Mar 2022
Oct 2021
Apr 2021
Date (by week ending)
YouGov survey results have shown that on 15 to 16 March, 53% of respondents had
taken a LFD/antigen test and 9% a PCR test in the past week35. Of those who had
taken a LFD/antigen test, 44% recorded the result of their last LFD/antigen test
online and 54% did not record the results online36.
The Scottish Contact Survey asks whether people use LFD tests and if so how often.
Approximately 77% of individuals had taken at least one lateral flow test within the
last 7 days for the survey pertaining to the 10 March to 16 March 37.
There are differences in the results from the YouGov and the Scottish Contact
Survey (SCS) which may be likely to be due to differences in sampling and
methodology. YouGov is an online survey based on an active sample which is
representative of the Scottish population with around 1,000 respondents38. The
35 Results are taken from questions run on behalf of Scottish Government on the YouGov online omnibus survey.
Question ‘Coronavirus tests typically take two forms – Rapid ‘Lateral Flow or LFD’ tests (sometimes called
Antigen Tests), which give a test result in 30 minutes and are usually self-administered, or PCR Tests mostly
conducted at official Test Sites (but also available as a ‘Home Kit) – processed by a laboratory, with results
available within 48 hours. In both tests, a swab of nose and/or throat is needed. Which of the following applies to
you in relation to testing for Covid-19 in the past week (i.e. since 8 March)?’
36 Question -Thinking about the last lateral flow/antigen test you did in the past week…Which of the following best
describes you in relation to that test? (Base: 533 - All who have taken a Lateral Flow/antigen test in the last
week)
37 Scottish Government: Coronavirus (COVID-19): modelling the epidemic
38 The sample is demographically and geographically representative of adults 18+ across Scotland, with circa
1000 responses each week fieldwork is conducted. YouGov apply weighting to the data to match the population
profile to adjust for any over/under representations and to maximise consistency from wave to wave. Parameters
used include age, gender, social class, region and level of education.
14SCS39 is based on a longitudinal survey with a larger sample of around 3,000, with
the responses being modelled to represent the Scottish population.
Severe Illness: Hospitalisation, ICU and Deaths
Hospital and ICU Occupancy and Admissions
Following changes in the Covid-19 Case definition and changing testing policies
on 5 January 2022, hospital and ICU occupancy figures include patients with
Covid-19 cases confirmed by either PCR or LFD from 9 February and onwards.
Prior to this date, it only included cases confirmed by a PCR test. Hospital and
ICU occupancy both include reinfection cases. Covid-19 occupancy figures
presented in this section may include patients being admitted and treated
in hospital or ICU for reasons other than COVID-19.
In the week to 23 March, daily Covid-19 hospital occupancy continued to increase to
the highest level of Covid-19 related hospital occupancy reported throughout the
pandemic. NHS boards reported 2,257 patients in hospital or in short stay ICU on 23
March with recently confirmed Covid-19, compared to 1,999 on 16 March. This is an
increase of 258 patients, or 13%, from a week previously, and an increase of 748
patients, or 50%, compared to two weeks previously (9 March). This is 10% higher
than the peak of 2,053 patients in hospital in January 2021 (Figure 9).
Combined ICU occupancy (including short and long stay) has decreased to 32
patients on 23 March, a decrease of 9 patients, or 22%, compared to a week
previously on 16 March. Low numbers in ICU occupancy means that the data is
sensitive to minimal changes, which had led to the trend fluctuating in recent weeks.
Combined ICU occupancy remains lower than the peak of 172 ICU patients recorded
in January 2021.
This decrease in ICU occupancy was seen among both short and long stay ICU
patients. There were 25 patients in short stay ICU on 23 March, compared to 32 a
week previously (16 March). This is a decrease of 7 patients. There were 7 patients
in long stay ICU on 23 March, compared to 9 a week previously (16 March). This is a
decrease of 2 patients (Figure 9)40.
39 The sample is demographically representative of adults 18+ across Scotland, with circa 3000 responses over
two alternating panels. This is modelled to represent the Scottish population.
40 Scottish Government: Coronavirus (Covid-19): Trends in Daily Data (accessed 23 March 2022)
15Figure 9: Patients in hospital (including short stay ICU), and patients in
combined ICU with recently confirmed Covid-19, data up to 23 March 202241 42.
2,500 250
Daily Combined ICU Occunapcy
From 9 Feb 2022
Daily Hospital Occupancy
patients include
2,000 PCR and LFD 200
confirmed cases
1,500 150
1,000 100
500 50
0 May 2021 0
Nov 2020
Dec 2020
Jul 2021
Nov 2021
Dec 2021
Sep 2020
Jan 2021
Feb 2021
Mar 2021
Jun 2021
Aug 2021
Sep 2021
Jan 2022
Feb 2022
Mar 2022
Oct 2020
Oct 2021
Apr 2021
Date
Hospital and short stay ICU Combined (short and long stay) ICU
1
Covid-19 admissions to hospital (including for children and young people) include
patients with Covid-19 cases confirmed either by PCR or LFD from 5 January
and onwards. Prior to this date, it only included cases confirmed by a PCR test.
Hospital admissions include reinfection cases. Please note that admissions to
ICU only include PCR confirmed Covid-19 cases. Covid-19 occupancy figures
presented in this section may include patients being admitted and treated
in hospital or ICU for reasons other than COVID-19.
Please note that hospital admissions data in Scotland is dynamic and
subject to daily revisions. We are currently seeing a large number of daily
revisions, which is likely due to infections being identified after patients have
been admitted to hospital. This means that week-on-week comparisons are likely
to rely on incomplete data. As a result we have moved to reporting comparisons
over a longer period of time. Greatest revisions are likely to impact the latest
two weeks of data; however, longer time periods could be subject to
revision.
According to data from Public Health Scotland, there has been an increasing trend in
Covid-19 admissions to hospital over the past month. There were 1,341 admissions
to hospital for people with confirmed Covid-19 in the week to 19 March which is a
41 ICU includes combined ICU/HDU figures and both patients with length of stay 28 days or less and with length
of stay more than 28 days. Please note that only patients with length of stay 28 days or less in ICU were
recorded until 20 January 2021. From 20 January 2021 ICU short and long stay includes both ICU or combined
ICU/HDU with length of stay 28 days or less and with length of stay more than 28 days.
42 Before 9 February 2022, patients were only included if they had a recent positive laboratory confirmed PCR
test. Hospital and ICU occupancy includes reinfections from 7 March 2022 onwards.
1641% increase from four weeks prior (week to 19 February)43. As noted above, we are
currently seeing a large number of daily revisions, so the number of admissions for
the latest week is likely to change44.
There has been a fluctuating trend in Covid-19 admissions to ICU over the past
month. There have been 23 admissions to ICU for people with confirmed Covid-19 in
the week to 22 March which compares to 22 in the week to 22 February 45. As noted
above we are currently seeing a large number of daily revisions, so the number of
admissions to ICU for the latest week is likely to change (Figure 10)46.
Figure 10: Weekly total of Covid-19 admissions to hospital and ICU with a
positive Covid test in Scotland. Hospital admission data to 19 March 2022 and
ICU admission data to 22 March 202247 48 49.
From 5 Jan
2,000 200
2022 hospital
Weekly Total Hospital Admissions
Weekly Total ICU Admissions
admissions
include PCR
1,500 and LFD 150
confirmed cases
1,000 100
500 50
0 0
May 2020
Jul 2020
Nov 2020
May 2021
Jul 2021
Nov 2021
Sep 2020
Sep 2021
Mar 2020
Jan 2021
Mar 2021
Jan 2022
Mar 2022
Date of Admission
Hospital Admissions ICU Admissions
43 The State of the Epidemic report incorporates data up to and including 23 March 2022, so any revisions since
then will not be included in this report.
44 Public Health Scotland: Covid-19 Daily Dashboard (accessed 23 March 2022)
45 The State of the Epidemic report incorporates data up to and including 23 March 2022, so any revisions since
then will not be included in this report.
46 Public Health Scotland: Covid-19 Daily Dashboard (accessed 23 March 2022)
47 Covid-19 related admissions have been identified as the following: A patient’s first positive test for Covid-19 up
to 14 days prior to admission to hospital, on the day of their admission or during their stay in hospital. If a
patient’s first positive test is after their date of discharge from hospital, they are not included in the analysis. An
admission is defined as a period of stay in a single hospital. If the patient has been transferred to another hospital
during treatment, each transfer will create a new admission record.
48 Before 9 January 2022, hospital admissions were only included if the patient had a recent positive laboratory
confirmed PCR test. ICU admissions rely on PCR testing only. Hospital admissions data in the chart now
includes reinfections and has been updated to include this methodology retrospectively to the start of the
pandemic.
49 Greatest revisions are likely to impact the latest two weeks of data; however, longer time periods could be
subject to revision.
17According to data from the PHS Education Dashboard, average hospital admissions
related to Covid-19 in children and young adults have continued to increase in the
three-week period to 16 March, and have reached the highest levels seen in the
pandemic, at 163 average weekly admissions. This is a 17% increase compared to
the previous three-week period to 9 March (138 average weekly admissions), and
compares to 155 average weekly admissions at the previous peak in three-week
period to 19 January. These figures refer both to young patients in hospital because
of Covid-19 and with Covid-19, and link to both PCR and LFD test results50.
The highest number of hospital admissions in the week to 15 March were among
those aged 80 and over. In the same week, approximately 58% of the hospital
admissions related to patients aged 60 or older. This is a decrease from 63% in the
week to 22 February51.
While it may be helpful to compare hospital occupancy and admissions
between the UK nations, any comparisons must be made with caution.
Definitions are not consistent across the nations and data are not reported daily
by each nation. Data from Scotland, Wales and Northern Ireland is updated
retrospectively if errors come to light, while data from England is not revised
retrospectively, but instead is corrected in the following day's data update. This
means Covid-19 hospital occupancy and admissions figures are not directly
comparable across the four nations. For more information see UK Government
dashboard.
The seven-day average hospital occupancy in Scotland per one million people was
381 patients in the week to 22 March 2022. This is an increase of 21% from one
week prior (week to 15 March 2022). The seven-day average hospital occupancies
per one million in the same period for other UK nations were as follows 52 53:
England: 211 per one million (an increase of 21% from one week prior),
Northern Ireland: 299 per one million (a decrease of 8% from one week prior),
Wales: 259 per one million (an increase of 29% from one week prior).
Due to revisions to the hospital admissions data mentioned above (page 16), we
have removed the four nations comparisons in this week’s publication. We will
continue to monitor the data to see when it is appropriate to reintroduce this analysis.
Deaths
After a period of decreasing numbers of Covid-19 deaths throughout the last two
months of 2021, the week to 23 January 2022 saw a peak of 146 deaths where
Covid-19 was mentioned on the death certificate. This came after three weeks of
increasing numbers of deaths, largely consisting of fatalities among those aged 45 or
above. Covid-19 deaths among younger age groups have remained at similar low
50 Public Health Scotland: PHS Covid-19 Education Report
51
Public Health Scotland: Covid-19 statistical report - 2 March 2022
52 UK Government: Coronavirus (Covid-19) in the UK (accessed 23 March 2022)
53 Hospital occupancy data across the four nations refers to the week ending 22 March due to availability of data,
whereas the main hospital occupancy section for Scotland only in this report refers to the week ending 23 March.
18levels throughout the pandemic. While the weekly total number of deaths has
decreased since January, the number of deaths are at higher levels among those
aged 45 and older but are fluctuating on a weekly basis (Figure 11).
The overall number of Covid-19 deaths has remained unchanged at a total of 118
deaths in the week leading up to 20 March, compared to the week leading up to 13
March. This figure is 82% lower than the peak in 2020, when the week ending 27
April saw a total of 663 deaths where Covid-19 was mentioned on the death
certificate54. National Records of Scotland publish a weekly detailed analysis on
deaths involving Covid-19 in Scotland in their weekly report55.
Figure 11: Weekly total number of deaths where Covid-19 was mentioned on
the death certificate, by age group. Data to the week ending 20 March 2022.
Excess deaths are the total number of deaths registered in a week minus the
average number of deaths registered in the same week over the previous five
years (excluding 2020). Measuring excess deaths allows us to track seasonal
influenza, pandemics and other public health threats. Excess deaths include
deaths caused by Covid-19 and those resulting from other causes.
In the week ending 20 March, the total number of deaths registered in Scotland was
1,245. This was 8% higher than the five year average for this week56.
54 NRS Scotland: Deaths involving coronavirus (Covid-19) in Scotland
55 NRS Scotland: Deaths involving coronavirus (Covid-19) in Scotland
56 NRS Scotland: Deaths involving coronavirus (Covid-19) in Scotland
19Deaths data from England, Northern Ireland, Scotland and Wales use
different methodologies, so they cannot be directly compared. The death
figures below are the daily numbers of people who died within 28 days of being
identified as a COVID-19 case by a positive test. The definition of a Covid-19
case aligns with the case definition used in each nation. Deaths following a
possible reinfection are included from 1 February for England and Northern
Ireland, and from 1 March in Scotland. For more information see UK Government
website.
There were 4 average daily deaths per one million population in the week leading
up to 23 March 2022 in Scotland. This compares to 3 weekly deaths per one million
in the week to 16 March. In the same time period, average daily deaths for the other
UK nations were as follows57 58:
England: 2 per one million. This compares to 1 weekly death per one million
in the week to 16 March.
Northern Ireland: 2 per one million. This compares to 2 weekly deaths per
one million in the week to 16 March.
Wales: 2 per one million. This compares to 1 weekly death per one million in
the week to 16 March.
Resilience: Vaccinations, Antibody Estimates, and Variants
Vaccinations
Vaccinations started in Scotland on 8 December 2020 and there has been a very
high uptake. Covid-19 vaccines protect most people against severe outcomes of
a Covid-19 infection, but some people will still get sick because no vaccine is
100% effective. The current evidence suggests that you may test positive for
Covid-19 or be reinfected even if you are vaccinated, especially since the
emergence of the Omicron variant in the UK. The major benefit of vaccination
against Omicron is to protect from severe disease.
From 24 March 2022, PHS began reporting the number of people who have
received a fourth dose of Covid-19 vaccination and they will include further
updates as the Spring/Summer vaccination programme rolls out. In addition, the
methodology of counting the vaccine uptake statistics have been reviewed to be
in line with other UK nations. This means that from 24 March 2022, the deceased
and those who no longer live in Scotland will no longer be included in vaccine
uptake statistics. While the State of the Epidemic report data cut is 23 March,
cumulative figures reported on 24 March will be lower in comparison to previous
days as a result of this change. The data presented in the state of the epidemic
report remains correct as reported on the 23 March 2022. More details on the
methodology changes are available on PHS website.
57 Deaths within 28 days of positive test.
58 UK Government: Coronavirus (Covid-19) in the UK (accessed 23 March 2022)
20By 23 March, almost 4.5 million people had received their first dose, an estimated
92.4% of the population aged 12 and older, and almost 4.2 million people had
received their second dose, an estimated 87.2% of the population aged 12 and
older. Almost 3.5 million people in Scotland had received a third vaccine dose or
booster, an estimated 72.7% of the population aged 12 and older59.
By 23 March, booster vaccine uptake is at least 93% for those aged 60 or over, 91%
for those aged 55 to 59, 86% for those aged 50 to 54, 76% for those aged 40 to 49,
61% for those aged 30 to 39, 52% for those aged 18 to 29, 17% for those aged 16-
17 and 1% for those aged 12 to 15.
By local authority, the highest uptake of dose 3 or booster of the Covid-19
vaccination by 23 March was seen in East Dunbartonshire (82.5%), Argyll and Bute
(80.2%), Shetland Islands (80.1%), Scottish Borders (79.8%), and Orkney Islands
(79.4%). The lowest uptake of dose 3 or booster of the Covid-19 vaccination by 23
March was seen in Glasgow City (62.8%), Dundee City (65.5%), Aberdeen City
(66.0%) and Edinburgh (69.5%)60.
Antibodies Estimates
The analysis of antibody prevalence can be used to identify individuals who
have had COVID-19 in the past or who have developed antibodies as a
result of vaccination. As detailed by the ONS, there is a clear pattern between
vaccination and testing positive for COVID-19 antibodies but the detection of
antibodies alone is not a precise measure of the immunity protection given by
vaccination.
The antibody threshold of 179 ng/ml is higher than the previously reported
standard threshold of 42 ng/ml and will provide the earliest signs of any changes
in antibody levels. Academic research on antibody thresholds using data from
when the Delta variant was the dominant strain indicate that the higher antibody
threshold is needed to provide protection from new COVID-19 infections for those
who are vaccinated. For more information, see the Covid-19 Infection Survey.
The ONS Covid-19 Infection Survey estimated that in Scotland, 99.0% of the adult
(aged 16+) population living in private residential households (95% credible interval:
98.7% to 99.2%) had antibodies against SARS-CoV-2 at the 179 ng/ml threshold,
from a blood sample in the week beginning 28 February 2022. This would be as a
result of having the infection in the past or being vaccinated. This compares to:
99.0% in England (95% credible interval: 98.8% to 99.2%),
98.9% in Wales (95% credible interval: 98.6% to 99.2%),
98.8% in Northern Ireland (95% credible interval: 98.2% to 99.2%).
The percentage of children living in private residential households in Scotland who
are estimated to have antibodies against SARS-CoV-2 at the 179 ng/ml threshold
was 81.6% for those aged 8 to 11 years (95% credible interval: 70.4% to 89.9%) and
59 Public Health Scotland: Covid-19 Daily Dashboard | Tableau Public (accessed 23 March 2022)
60 Public Health Scotland: Covid-19 Daily Dashboard | Tableau Public (accessed 23 March 2022)
2197.1% for those aged 12 to 15 years (95% credible interval: 94.6% to 98.4%), from a
blood sample in the week beginning 28 February 2022.
The estimated percentage of the adult (aged 16+) population living in private
residential households in Scotland testing positive for antibodies against SARS-CoV-
2 at the 179 ng/ml threshold ranged from 98.3% for those aged 80 years and over
(95% credible interval: 96.9% to 99.0%) to 99.5% for those aged 65 to 69 years
(95% credible interval: 99.3% to 99.7%), in the week beginning 28 February 2022.
Vaccine Effectiveness Against Omicron
The UKHSA reported that vaccine effectiveness against symptomatic disease,
hospitalisation, or mortality with the Omicron variant is lower compared to the Delta
variant and that it wanes rapidly. Vaccine effectiveness against all outcomes is
restored after the booster dose, with effectiveness against symptomatic disease
ranging initially from around 60% to 75% and dropping to around 25% to 40% after
15 weeks. Vaccine effectiveness against hospitalisation ranged from 85% to 95% up
to six months after the booster dose with little variation between the type of vaccine
used for priming or boost. The high level of protection against mortality was also
restored after the booster dose with vaccine effectiveness of 95% two or more weeks
following vaccination for those aged 50 and older61.
Vaccine effectiveness against symptomatic disease with Omicron BA.2 compared to
Omicron BA.1, showed similar results, with BA.1 having an effectiveness of below
20% and BA.2 having an effectiveness of above 20% after 25 or more weeks
following the second dose. The booster dose of vaccine increased effectiveness to
around 70% for BA.1 and BA.2 at two to four weeks following a booster vaccine.
Effectiveness dropped to around 50% for BA.1 and BA.2 15 weeks after vaccination.
Vaccine effectiveness against hospitalisation ranged from 83% for BA.1 to 87% for
BA.2 at 14 to 34 days after the booster dose, and dropped to 73% for BA.1 and 70%
for BA.2 after 70 days. These estimates have large overlapping confidence
intervals62.
More data on vaccine effectiveness against the Omicron variant can be found in the
UKHSA vaccine surveillance reports. There is evidence that there is reduced overall
risk of hospitalisation for Omicron compared to Delta63 64, with the most recent
estimate of the risk of presentation to emergency care or hospital admission with
Omicron approximately half of that for Delta65. A recent, non-peer reviewed UK study
revealed that risk of COVID-19 related death was 67% lower for Omicron when
compared with Delta66.
61 COVID-19 vaccine surveillance report - week 12 (publishing.service.gov.uk)
62 COVID-19 vaccine surveillance report - week 12 (publishing.service.gov.uk)
63 University of Edinburgh: Severity of Omicron variant of concern and vaccine effectiveness against symptomatic
disease
64
Imperial College Covid-19 response team: Report 50: Hospitalisation risk for Omicron cases in England
65 UK Health Security Agency: SARS-CoV-2 variants of concern and variants under investigation
66 Risk of COVID-19 related deaths for SARS-CoV-2 Omicron (B.1.1.529) compared with Delta (B.1.617.2) |
medRxiv
22Situation by Local Authority within Scotland
From March 1, cases data includes reinfections (where a person has a positive
test 90 days or more since a last positive test). For cases by specimen date,
historical cases have been retrospectively updated to include reinfections from
the start of the pandemic.
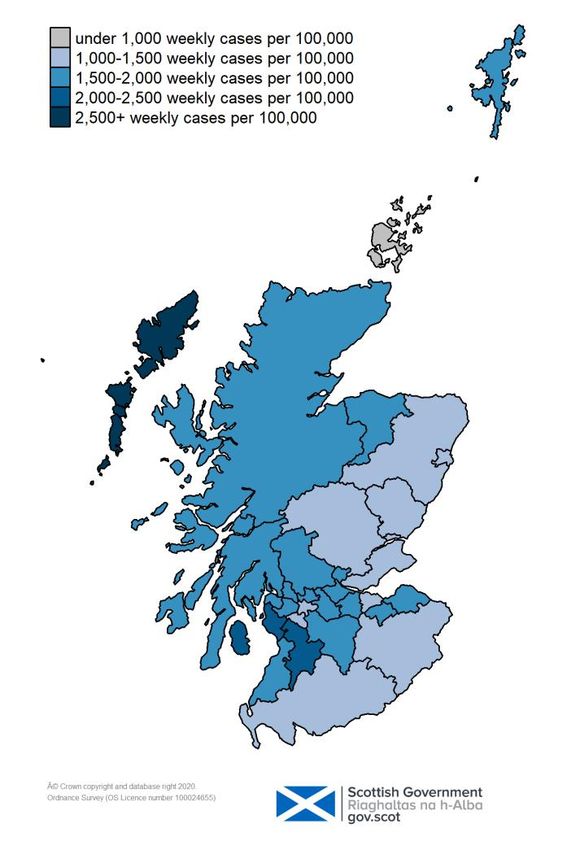
In the week leading up to 20 March 2022, Na h-Eileanan Siar had the highest
combined PCR and LFD weekly case rate by specimen date, reporting 3,079 cases
per 100,000 population. Orkney Islands had the lowest weekly combined LFD and
PCR case rate in the same time period, reporting 902 cases per 100,000. The total
combined LFD and PCR weekly case rates by specimen date per 100,000 had
increased in 10 local authorities in the week leading up to 20 March 2022 compared
with the weekly case rate leading up to 13 March 2022, while 22 local authorities
saw a decrease in the same period (Figure 12)67.
Figure 12: Weekly total LFD or PCR case rates (including reinfections) per
100,000 people in Local Authorities across Scotland on 20 March 2022 by
specimen date68.
67 Public Health Scotland: Covid-19 Daily Dashboard (accessed 23 March 2022)
68 For the case rates behind the map, please refer to Annex Table 1.
23Please note that the following local authority hotspot modelling uses data to 21
March 2022 from several academic groups to give an indication of whether a
local authority is likely to experience high levels of Covid-19. The local authority
modelling has not been compiled via UKHSA into a consensus this week and is
based on one modelling group.
In less populated regions in which case numbers are small, there is a greater
variation in model estimates, and hence increased uncertainty. This has led to Na
h-Eileanan Siar, Orkney Islands and Shetland Islands not being included this
week. The modelled weekly case rate below is not directly comparable to
the weekly case rate reported in the section and figure above.
Modelled rates of positive tests per 100,000 indicate that for the week commencing 3
April, all 29 of the local authorities included are expected to exceed 100 cases per
100,000 with at least 75% probability. The same 29 local authorities are also
expected to exceed 300 cases per 100,000, with at least 75% probability.
24 out of the 29 local authorities are expected to exceed 500 cases per 100,000,
with at least 75% probability. The exceptions are Aberdeenshire, Aberdeen, Angus,
East Renfrewshire and Moray. One local authority (South Ayrshire) is expected to
exceed 1,000 cases per 100,000 with at least 75% probability69.
Looking ahead
Scottish Contact Survey
Changes in patterns of mixing will impact on future case numbers. The Scottish
Contact Survey measures the times and settings in which people mix where they
could potentially spread Covid-19. Average contacts from the most recent Panel B
cohort of the Scottish Contact Survey (week ending 16 March) indicate an average
of 5.2 contacts.
Mean contacts have increased in the majority of location settings with the exception
of contacts within the school setting which has decreased by 47% in the last two
weeks. Contacts have risen in the work setting by 44%, in the other setting (contacts
outside home, school and work) by 12% and in the home setting by 6%. Individuals
within the youngest age groups (18-39) have reported a decrease in contacts within
the last two weeks, with the 18-29 age group reducing by approximately 20%. Those
within the older age groups (40+) have increased their contacts in the last two weeks
with those in the 40-49 age group increasing the most, by 39%.
69 Scottish Government: Coronavirus (Covid-19): modelling the epidemic
24You can also read