Simultaneous Selection Index as a Tool for Identication of Stable High Yielding Maydis Leaf Blight Resistant Maize Prebreeding Lines
←
→
Page content transcription
If your browser does not render page correctly, please read the page content below
Simultaneous Selection Index as a Tool for Identification
of Stable High Yielding Maydis Leaf Blight Resistant Maize
Prebreeding Lines
Anjali Joshi ( anjali999aj@gmail.com )
GBUA&T: Govind Ballabh Pant University of Agriculture & Technology https://orcid.org/0000-0002-7841-2326
Sneha Adhikari
IIWBR-ICAR, Shimla
Narendra Kumar Singh
GB Pant University of Agriculture and Technology
Amarjeet Kumar
MTTC and VTC, Selesih, CAU, Imphal, India
Jai Prakash Jaiswal
GB Pant University of Agriculture and Technology College of Forestry and Hill Agriculture: Uttarakhand University of
Horticulture and Forestry
Usha Pant
GB Pant University of Agriculture and Technology
Rajesh Pratap Singh
GB Pant University of Agriculture and Technology
Research Article
Keywords: AMMI, GGE biplot, Maize, Pre breeding, Teosinte
Posted Date: June 1st, 2021
DOI: https://doi.org/10.21203/rs.3.rs-513562/v1
License: This work is licensed under a Creative Commons Attribution 4.0 International License. Read Full
License
Page 1/29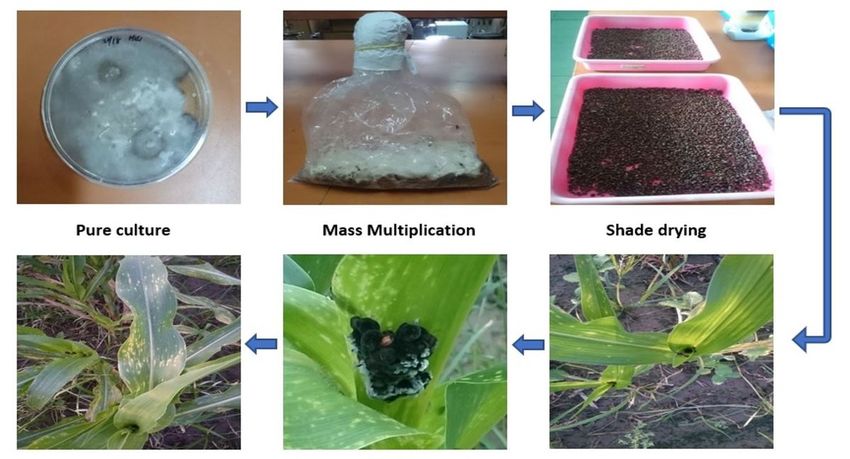
Abstract
Maize is a crop possessing high adaptability however, large differential genotypic responses have been reported when
evaluated under multiple environments. Using randomized complete block design with two replications a total of 169
teosinte derived maize backcross inbred lines (BILs) were evaluated in three different environments namely, E2, E4
and E6 for maydis leaf blight (MLB) resistance and grain yield. Out of these, 73 BILs were identified displaying
resistance to MLB in at least one of the environments and were subjected to additive main effect and multiplicative
interaction (AMMI) analysis and genotype and genotype X environment (GGE) biplot analysis for identification of lines
showing stable and high MLB resistance and grain yield. Highly significant effects of genotype, environment and
genotype X environment interaction (GEI) were observed for both the traits studied. AMMI ANOVA for percent disease
index (PDI) revealed that highest percentage of total sum of squares (SS) was attributed to GEI (40.55%) while 32.86%
and 26.59% was contributed by genotype and environment, respectively. For grain yield largest contribution of 68.02%
towards SS was done by genotype component followed by GEI (17.50%) and E (14.48%). GGE biplot analysis
identified two mega environments for both PDI (E2, E4/E6) and grain yield (E2/E4, E6). Based on AMMI stability value
(ASV), genotype MT-90 (32) was observed to be most stable for PDI. While for grain yield highest stability was
displayed by genotype MT-83 (28). Simultaneous selection index (SSI) helped in identification of ten stable high
yielding MLB resistant genotypes namely, MT-120 (45), MT-14 (2), MT-166 (62), MT-148 (55), MT-190 (72), MT-37 (9),
MT-19 (3), MT-114 (42), MT-77 (27) and MT-94 (35) which could be used in future breeding programmes either as
donor of MLB resistance and grain yield or after combining ability analysis these genotypes could be used as parents
for development of superior yielding MLB resistant hybrids.

Introduction
Maize, exhibiting highest genetic yield potential amongst different cereals thereby earning for itself the title “queen of
cereals” is a crop of global repute. Grown in more than seventy countries (Anonymous 2018) along with rice and
wheat maize provides 60% of the world’s energy intake (Anonymous 2008) and contributes 39% of grain production
globally. In Indian context, maize is the third largest produced and consumed crop after wheat and rice (Kumar et al.
2013) and contributes significantly towards the poultry industry (Hellin and Erenstein 2009). Like other crops, maize
cultivars are also confronting with various factors during different developmental phases to realize its genetic
potential while grown commercially at farmers’ field or grown at experimental site. Consequently, the crop growth and
development is severely affected leading to sub-optimum outputs. Apart from abiotic factors that constitute all the
non-living components and interacts right from the seed germination to maturity stages, maize crop is also affected
by biotic factors, many of them are beneficial while others are harmful, interfering at different stages, from
germination to maturity and during storage, leading to loss of green biomass, green ears including baby corn and
sweet corn and, grain yield. Diseases caused by a fraction of biotic factors are 61 in numbers and have been reported
to cause about 13.2% loss in economic product per annum (Payak and Sharma 1985; Kumar et al. 2013). Maydis leaf
blight (MLB) is one of the diseases significantly affecting maize production in India and abroad.

A disease of historical significance due to its epidemic propositions in 1970 in the US, MLB is caused by a
necrotrophic ascomycete fungi Bipolaris maydis. The disease can cause as high as 70% yield losses to maize
production (Mubeen et al. 2017). Almost all the yield losses in India are attributed to race O of the pathogen as race C
is confined only to China (Wei et al. 1988) and race T affects Texas male sterile cytoplasm (cmsT) maize (Carson et
al. 2004) which is not widely cultivated in the country. Though chemical fungicides can be used for controlling the
disease, yet the additional input requirement and the associated ill effects necessitate the search of novel genes and
alleles and their deployment to incorporate gene-based protection mechanism in the plant. In fact, development of
tolerant genotypes by integrating novel alleles/genes seems to be the most feasible, attractive, cost effective and
                                                        Page 2/29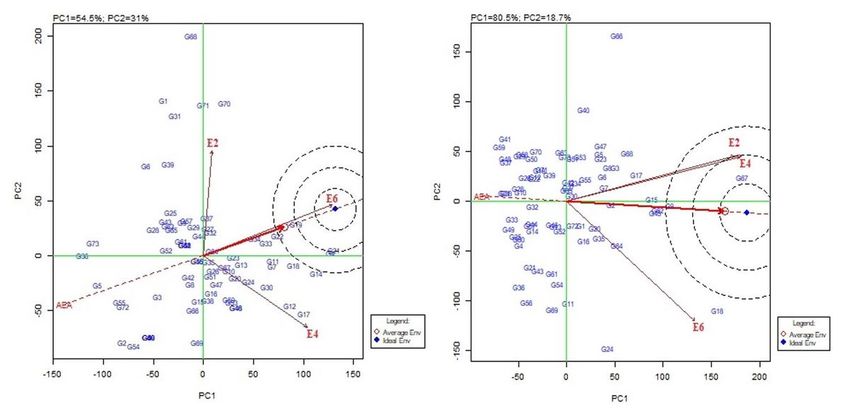
long-term alternative for management of MLB in maize. Resistance to MLB in maize is reported to be both qualitative
(Faluyi and Olorode 1984; Zaitlin et al. 1993; Chang and Peterson 1995)and quantitative (Pate and Harvey 1954;
Kumar et al. 2016) in nature. The development of MLB resistance using quantitative genetic factors is advantageous
in many ways as it not only provides resistance against many pathogenic races but also prevents the evolution of
new and more virulent pathogen variants. A number of MLB resistant varieties have been derived using maize
germplasm belong to primary gene pool however prospects of wild relatives and biological progenitor of maize in
incorporating resistance to MLB has remained largely unexplored. The narrow genetic base of cultivated maize is an
important factor limiting the breeding of new maize varieties for high-yield and disease resistance (Wallace et al.
2014). Sourcing resistance from wild relatives is advantageous because they possess a plethora of novel resistance
alleles on account of being exposed to difficult environments from times immemorial and still surviving, flourishing
and thereby continuously evolving under the existing and emerging climatic conditions. The breeding goals would be
easier to address if the enormous genetic variation present in wild progenitors is available to the breeders in a form,
they could use in their breeding programs.

Teosinte (Zea mays ssp. parviglumis), the nearest and most probable wild progenitor of maize is interfertile with
maize and produces viable hybrids (Doebley et al. 1984; Singh et al. 2017) and in certain parts of the world is still
believed to be exchanging genes with maize naturally. Teosinte can be used as donor of pre-domestication alleles for
the improvement of maize with respect to different traits (Liu et al. 2016; Kumar et al. 2019; Adhikari et al. 2019, 2021;
Singh et al. 2021; Joshi et al. 2021, Sahoo et al. 2021). This could be done by creation of diverse prebreeding lines
which would serve as donor of novel genetic variation and could be employed to breed for high value characteristics
such as MLB disease resistance. Only a single study has been performed by Lennon et al. (2017) in which maize wild
relative Zea mays spp. parviglumis was used as a donor of MLB resistance alleles.

Development of resistant genotype is essential, however, besides being resistant, a genotype must be high yielding
and stable in performance in order to be commercially viable and substantially accepted by maize growers over a
wide range of agroclimatic conditions. Yield alike MLB resistance is a complex quantitative trait and greatly
influenced by external environment which may result in shift in scale or rank of the genotype performance when
grown in diverse environments (Dia et al. 2016a). Differential genotypic response with respect to yield and disease
resistance when grown in diverse environments have also been observed by Aina et al. (2007) and Ssemakula and
Dixon (2007). Popularly called as the GxE interaction, the differential sensitivity of genotype performance to
environments complicates the identification of superior genotype across the environments (Dia et al. 2016b). The
presence of GxE interaction reduces the correlation between genotype and phenotype therefore slows the progress
due to selection (Chalwe et al. 2017). Therefore, the nature and magnitude of GxE interaction must be taken into
consideration during the identification of superior genotypes. Multi environment trials are an effective tool for
identification of GxE interaction. A number of different methods (Wricke 1962; Eberhart and Russell 1966; Perkins and
Jinks 1968; Shukla 1972; Francis and Kannenberg 1978; Lin and Binns 1988) are available for stability assessment
however, the most commonly used methods for studying GxE interaction is the additive main effect and multiplicative
interaction (AMMI) model and the genotype and genotype x environment (GGE) biplot (Yan et al. 2001).

The GGE biplot is a statistical tool utilized for examining the performance of genotypes tested in different
environments. The which-won-where biplot helps in identification of mega environments and the winning genotypes
for each mega environment (Yan 2001). The AMMI model combines analysis of variance for additive main effects
with principal component analysis for the multiplicative interaction. Stability of a genotype can be assessed by
calculating the AMMI stability value (ASV) (Hagos and Abay 2013) which is based on interaction principal
components axes 1 (IPCA1) and 2 (IPCA2) (Purchase et al. 2000). A widely adapted genotype displays least ASV
value (Adjebeng-Danquah et al. 2017). Selection of genotypes with stable MLB resistance and grain yield over a range
                                                        Page 3/29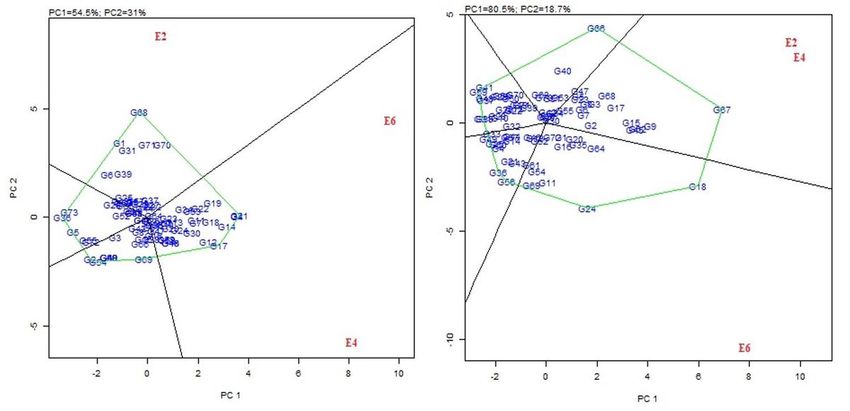
of different environmental conditions and in the presence of variable disease pressure is an ideal strategy for making
optimal progress in resistance breeding (Gyawali et al. 2019). Keeping all these observations in perspective a study
was planned to generate diverse pre breeding lines by crossing maize inbred line DI-103 with MLB resistant teosinte
(Zea mays spp. parviglumis) and using the MLB resistant inbred lines so produced for AMMI analysis for grain yield
and MLB reaction score parameters with objective to identify genotypes that displays stable and high grain yield
combined with resistance to MLB. Lines identified to be high yielding and MLB resistant can be used as potential
germplasm in maize breeding programme.

Materials And Methods
Experimental materials

The genetic materials for the experiment were developed at Norman E. Borlaug Crop Research Centre, G. B. Pant
University of Agriculture and Technology, Pantnagar, Uttarakhand, India. Wild relative of maize, teosinte (Z. mays
ssp.parviglumis) was crossed as pollen parent with a superior maize inbred line DI-103 used as a seed parent. The F1s
thus produced were subjected to a single generation of backcrossing with DI-103 followed by selfing for four
consecutive generations leading to development of BC1F5 backcross inbred lines (BILs) population. A total of 169
BILs were subsequently utilised for the purpose of experimentation.

Experimental Layout

The evaluation of experimental material consisting of 169 BC1F5 lines was done in Kharif 2018-2019. Each line was
planted in a single row 2 m long and 75 cm apart. These lines were evaluated in Randomized Complete Block Design
with two replications in three different environments namely E2, E4 and E6. The details of study environments along
with magnitude of whether parameters during the crop season is presented in table 1.

Observation procedure

Data on MLB reaction and grain yield was recorded for all the 169 BILs in three different environments. For the
purpose of screening of BILs for MLB response by creating artificial epiphytotic conditions in E2 and E4 the causal
organism Bipolaris maydis, was aseptically isolated from locally collected infected maize leaves. The pathogen was
initially cultured on sterilized solidified Potato Dextrose Agar (PDA) medium containing petri plates. For the purpose of
mass multiplication of the pathogen the autoclave bags containing sorghum grains were seeded with 1.5x1.5cm
rectangular pieces of Bipolaris maydis mycelium containing solidified PDA medium under aseptic conditions and
incubated at a temperature of 25-270C for 10 days with intermittent shaking after every 2-3 days to facilitate uniform
mycelium growth on grains. After shade drying 15-20 mycellium covered sorghum grains were placed in the leaf
whorls of 35 days old plant. The field was frequently sprayed with water for effective spore germination and disease
development. The entire process of mass multiplication and field inoculation of pathogen have been presented in Fig.
1. For natural spread of MLB in E6, a susceptible check was sown after every ten BILs and also as a border crop so as
to ensure uniform disease inoculum for all the lines. Data on disease severity was recorded 35 days after inoculation
for each line in all three environments by following 1 to 9 rating scale of Hooda et al. (2018) (Table 2). Disease rating
was converted into percent disease index (PDI) by using the following formula:

                                                        Page 4/29
In order to assess grain yield per plant, ears from three plants per entry per replication per environment were harvested
after physiological maturity and weighed. Average grain yield over three plants was calculated and expressed in gm
and further utilized for analysis.
Statistical Analysis
Combined Analysis of Variance
Combined Analysis of variance with respect to both PDI and grain yield was done. For both the traits the data was
heterogenous at 5% level of significance as revealed by Bartlett’s Chi-square test therefore, the data was transformed
before combined ANOVA was carried out.
AMMI and GGE biplot analysis
AMMI analysis was conducted for both PDI and grain yield in order to divide the total variation into variation due to
genotype, environments, and interaction as per the model given by Gauch and Zobel (1996) as mentioned below:
where,
Yger = Performance of genotype g in environment e for replicate r, µ = grand mean, αg = genotype mean deviation
(genotype means minus grand mean), βe = environment mean deviation, n = number of principal component analysis
(PCA) axes retained in the model, ʎn = singular value for PCA axis n, ygn = genotype eigenvector values for PCA axis n,
δen= environment eigenvector values for PCA axis n, ρge = residuals, Eger = error term.
Both AMMI and GGE biplot analysis was done with the help of GEA-R (Genotype x Environment Analysis with R for
Windows) software version 2.0.
AMMI stability value (ASV)
Stability of genotype with respect to MLB resistance and grain yield was assessed across environments by means
ASV as suggested by Purchase et al. (2000). ASV was calculated as per the formula given below and was used to
rank genotypes according to trait stability. Lower ASV signifies more stable genotypes.
Genotype Stability Index (GSI)
The rank of genotype (RT) based on overall mean of the genotype for a specific trait across seasons and ASV rank of
the genotype for that particular trait (RASV) were added up to calculate the GSI as given below and suggested by
Chalwe et al. (2017).
GSI= RASV + RT
Genotype with lowest GSI was considered to be superior and stable for the trait under consideration.
Page 5/29Simultaneous Selection Index (SSI)
GSI for both MLB resistance and grain yield were summed up to calculate SSI for each genotype.
SSI= GSIMLB resistance + GSIgrain yield
A genotype with lower SSI was considered to be superior and stable with respect to both MLB resistance and grain
yield.
Results And Discussion
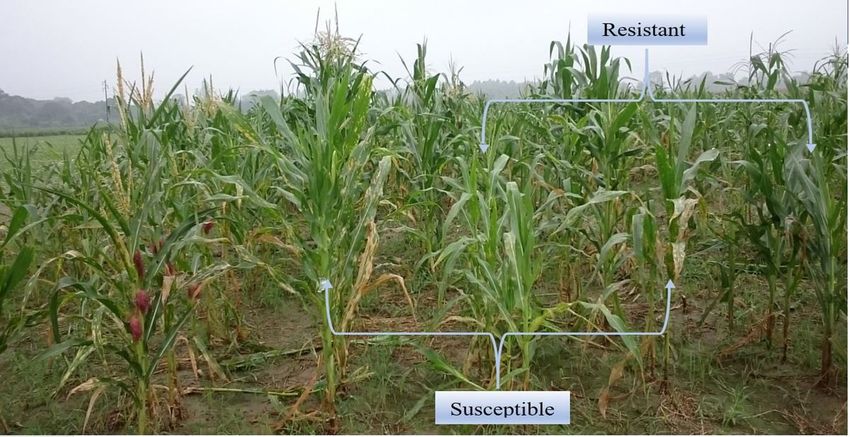
Categorisation of BC1F5 lines into different disease resistance classes when evaluated in multiple environments
Differential response for MLB resistance was observed amongst the evaluated lines (Fig. 2) and on the basis of rating
scale proposed by Hooda et al. (2018) the BILs were categorised into four groups i.e., susceptible, moderately
susceptible, moderately resistant and resistant (Table 3). When evaluated under E2 the PDI varied from 22.2 to 95.49%
and a mean PDI of 59.46% was observed. Of the 169 BILs investigated, 26, 77, 51 and 15 were scored as susceptible,
moderately susceptible, moderately resistant and resistant to MLB, respectively. In E4, the mean PDI of 70.96% was
observed with PDI value ranging from 29.63% to 85.19 %. A total of 64, 91, 10 and 4 lines were scored as susceptible,
moderately susceptible, moderately resistant and resistant to MLB, respectively. Screening for MLB resistance under
E6 revealed a mean PDI of 54.48% with PDI ranging from 23.5 to 94%. A total of 62, 63, 33 and 11 lines were grouped
into susceptible, moderately susceptible, moderately resistant and resistant categories with respect to MLB response,
respectively. Ott (2008) also observed variability for northern leaf blight resistance in the teosinte derived maize
introgression lines. As the parental maize inbred line DI-103 was susceptible to MLB, the MLB resistance in the derived
BILs were thought to be the result of teosinte genomic introgression. In accordance with our study, the near isogenic
lines containing teosinte genomic introgression in the background of the maize inbred B73 were also developed by Liu
et al. (2016) and when screened for grey leaf spot (GLS) resistance by Lennon et al. (2016) the lines were identified
with different GLS resistance alleles sourced from teosinte. The unimproved germplasm though a source of novel
resistant alleles is scarcely used in breeding programme due to associated inferior characteristics as low productivity,
high plant and ear height and high stalk and root lodging (Teixeira and Guimarães 2021). The MLB resistant pre-
breeding lines developed in this study can serve as a link between unimproved and improved germplasm and can be
utilized effectively in future breeding activities as source of MLB resistance. When all three environments were
considered together a total of 73 BILs which showed resistance in at least one of the environments were identified. As
the objective of our study was mainly to detect superior and stable genotypes for MLB resistance and grain yield and
also to reduce clutter in biplots, based on the preliminary MLB resistance evaluation, a subset of only 73 resistant BILs
were subsequently utilised for combined ANOVA, AMMI analysis, GGE biplot analysis and computation of GSIMLB
resistance, GSIgrain yield and SSI.
Combined Analysis of Variance for PDI and grain yield
Combined Analysis of Variance of the shortlisted 73 resistant BILs was done for PDI and grain yield using the data
obtained after evaluation under three environments. Combined ANOVA (Table 4) across the environments revealed
presence of highly significant differences (P < 0.01) for genotypes, environment and GXE interaction (GEI) for both PDI
and grain yield. In accordance with our study significant G, E and GEI effects were also reported by Sibiya et al. (2012)
for grey leaf spot disease resistance and grain yield in elite African maize germplasm. (Gyawali et al. 2019) also
reported significant G and GEI while evaluating barley genotypes in multiple environments for resistance to spot form
of net blotch. For grain yield, significant G, E and GEI in maize genotypes were also detected by Mafouasson et al.
Page 6/29(2018) and Aktas and Ure (2020). Highly significant environmental effect demonstrated that the experiments were
carried out under differing climatic conditions affecting both PDI and grain yield of genotypes. The presence of
significant GEI indicates that MLB resistance response and the yield of the evaluated BILs varies with the
environments which reduces the correlation between genotype and phenotype for a specific trait thereby making the
selection of genotype less effective and hence ultimately reducing the speed of crop improvement. Therefore,
reducing the magnitude of GEI is important. Reduction in GEI can be achieved by means of stability analysis and
selection of only those genotypes which shows wider adaptability (Yaghotipoor and Farshadfar 2007).
AMMI analysis of variance for PDI and grain yield
AMMI ANOVA for PDI revealed that highest percentage of total sum of squares (SS) was attributed to GEI (40.55%)
while 32.86% and 26.59% was contributed by genotype and environment, respectively (Table 5). GEI was further
divided into interaction principal components axes (IPCA) the first two of which were statistically significant. The first
IPCA (IPCA1) had maximum share of 64.09% whereas IPCA2 had share of 35.91% in the total GEI sum of square. In
accordance with our study, significant G, E and GEI was also observed by Persaud et al. (2019) for sheath blight
resistance in rice with GEI contributing as high as 39.52% to the total SS. They also identified two significant principal
components contributing greater than 70% of the total GEI effect. Highly significant G and GEI were also observed for
spot form of net blotch disease in the evaluated 340 barley genotypes by Gyawali et al. (2019). As GEI effect was
larger than the genotype effect the genotypes were ascribed to show variable performance for MLB resistance in
different environments which makes the identification of stable genotypes more crucial.
For grain yield, AMMI ANOVA revealed the largest contribution of 68.02% towards SS by the genotype main effect
followed by GEI (17.50%) and E (14.48%) as presented in Table 5. The contribution by GEI to SS was 3.88 times
smaller when compared to genotype component however it was greater than contribution due to environment. Two
statistically significant principal components namely, IPCA1 and IPCA2 accounted for 96.25% and 3.75% of the GEI
effect, respectively. Significant G, E and GEI was also observed earlier by Mafouasson et al. (2018) while evaluating
yield stability of single cross maize hybrids. A large SS for genotypes displayed that the diverse nature of genotypes
with greater differences among the mean grain yield was responsible for causing most of the variations. GEI was 3.89
times smaller than that for the sum of square for G. Further, sum of square due to G x E was 1.2 times larger than that
for E. This clearly showed that grain yield was mainly ascertained by the genotype and GEI and E had a very little role
to play thereby suggesting the possible existence of different genotype groups (Mohammadi et al. 2011). It is evident
from table 5 that for both PDI and grain yield using biplots in interactions was very advantageous as the first two PCA
axes explained 100% of the total interaction effect. The conclusion drawn on genotype stability based on these two
axes was therefore very reliable. Different researches have also indicated that GEI was precisely predicted by two
PCAs (Gauch and Zobel 1996; Nayak et al. 2008; Mukherjee et al. 2013). Accordingly, the stability values and index
were calculated by retaining two PCA axes in the model for both the traits.
Predictions from AMMI1 biplot
AMMI1 biplot consists of main effects for the trait in question displayed on the X axis and IPCA1 scores displayed on
the Y axis. On the basis of mean of the trait and the IPCA1 scores the genotypes and environments are plotted on to
the biplot. The central vertical line on the biplot denotes grand mean of the genotypes for the trait while the horizontal
line indicates an IPCA1 value of zero. IPCA1 scores are an indication of genotype stability. Lesser the IPCA1 score
more stable the genotype. An IPCA1 score of zero indicates highly stable genotypes across all the environments. The
larger the IPCA scores, either positive or negative, the more specifically adapted a genotype is to certain environments
(Mafouasson et al. 2018). AMMI1 biplot (Fig. 3a) between IPCA1 and PDI revealed that four genotypes namely MT-40
Page 7/29(10), MT-107 (39), MT-120 (45) and MT-151 (56) falling almost on vertical line had PDI equivalent to the PDI grand
mean of all genotypes while seven genotypes namely MT-19 (3), MT-114 (42), MT-120 (45), MT-148 (55), MT-151 (56),
MT-172 (64) and MT-190 (72) falling almost on horizontal line had equal GEI effects with IPCA1 scores of almost zero
signifying a small interaction with the environments and were considered to be the most stable with respect to MLB
resistance. Out of these MT-148 (55) was located on the extreme left and therefore was identified as line having high
degree of resistance and lower fluctuations to MLB. On the other hand, MT-172 (64) was located on the extreme right
showing stable and susceptible disease response. The highly resistant genotype MT-148 (55) identified in the present
study could be used as potential source for disease resistance while MT-172 (64) could be used as susceptible host
for producing pathogen inoculum for MLB screening notwithstanding the diverse environments. Similar identification
and utilisation of stable blast resistant and susceptible genotypes was also proposed by Persaud and
Saravanakumar (2018).
Thirty four genotypes i.e., 1, 4, 7, 11, 12, 13, 14, 17, 18, 19, 20, 21, 22, 23, 24, 27, 30, 31, 32, 33, 34, 37, 38, 44, 46, 47, 51,
53, 59, 64, 67, 68, 70 and 71 falling on the right side of the vertical line were expected to be more susceptible to MLB
while thirty three genotypes namely, 2, 5, 6, 8, 9, 15, 16, 25, 26, 28, 29, 35, 36, 40, 41, 43, 48, 49, 50, 52, 54, 55, 57, 58,
60, 61, 62, 63, 65, 66, 69, 72 and 73 situated on left side of the vertical line were expected to have higher degree of
resistance to the disease. The situation of the E4 on right side of the vertical axis indicates that the environment was
more suitable for development of MLB while the E2 was least suitable. Environment E6 on the other hand had
intermediate suitability for MLB development. The E4 therefore could be preferentially used for screening of
genotypes for MLB resistance. The suitability of E4 to support greater disease development can also be validated
from the initial MLB screening experiments conducted in all three environments which showed that highest number of
155 susceptible lines were identified in E4 followed by E6 with 125 susceptible lines and E2 with 103 susceptible lines.
The E6 with low IPCA1 scores of 0.193 had little interactions, while a greater GEI was recorded for E2 and E4 with
IPCA1 score of -1 and 0.807, respectively. A significantly larger number of genotypes recorded low IPCA1 scores of
-0.5 to 0.5 and showed small interactions, which led to clustering of the genotypes on the biplot. Genotypes MT-184
(68) and MT-9 (1) showed the highest IPCA1 score of -1 and -0.945, respectively. Genotypes possessing stable
response to disease severity across the environments are possessing quantitative disease resistance while genotypes
showing specific adaptations to particular environments are expected to harbour monogenic or oligogenic qualitative
resistance (Gyawali et al. 2019). Based on this criteria genotypes, MT-9 (1), MT-27 (6), MT-45 (12), MT-55 (14), MT-60
(17), MT-89 (31), MT-107 (39), MT-184 (68), MT-187 (70) and MT-188 (71) were identified harbouring qualitative
resistance against MLB. These lines can be investigated further in order to identify novel genes imparting MLB
resistance in maize.
For grain yield (Fig. 3b) a total of three genotypes MT-77 (27), MT-114 (42) and MT-174 (65) were situated on the
vertical line and displayed similar means. While genotypes namely, MT-14 (2), MT-40 (10), MT-83 (28), MT-85 (30), MT-
89 (31), MT-105 (38) and MT-120 (45) with IPCA1 scores of nearly zero lied near the horizontal line and showed stable
grain yield across environments. Out of these MT-120 (45) was situated on the extreme right side of the vertical line
and near the horizontal line signifying high and stable grain yield. This genotype after assessment of combining
ability can therefore be used as parental line for production of high yielding hybrids or as a component line in
development of synthetic varieties. A total of thirty-one and thirty-seven genotypes were located on the right and left
side of the vertical line. Genotypes located on the right side namely, 1, 2, 3, 5, 6, 7, 8, 9, 11, 15, 16, 17, 18, 20, 23, 24, 30,
34, 35, 40, 45, 47, 51, 53, 55, 62, 64, 66, 67, 68 and 72 displayed higher grain yield while those located on left side i.e.,
4, 12, 13, 14, 19, 21, 22, 25, 26, 29, 31, 32, 33, 36, 37, 38, 39, 41, 43, 44, 46, 48, 49, 50, 52, 54, 56, 57, 58, 59, 60, 61, 63,
69, 70, 71 and 73 showed inferior yield. Environment vector for E6 was situated on the right side while those for E2
and E4 was situated on the left side of the vertical axis thereby indicating that these environments were associated
Page 8/29with higher and lower grain yield, respectively. AMMI1 biplot for PDI also revealed that E6 environment was associated
with reduced development of MLB compared to E2 and E4 and lower disease development could be one of the
reasons for higher yield in E6. The E6 vector had the longest length followed by E4 and E2. The length of the
environment vector serves as an indication for the IPCA1 score of the environments. E2 and E4 with low IPCA1 scores
of 0.498 and 0.502, respectively, had little interactions, while a greater GEI was recorded for E6 with IPCA1 score of -1.
A significantly larger number of genotypes recorded IPCA1 scores of -0.667 to 0.334 leading to clustering of the
genotypes on the biplot. Genotypes MT-176 (66) and MT-72 (24) showed the highest IPCA1 score of 1 and -0.759,
respectively and therefore were specifically adapted.
Predictions from AMMI2 biplot
In the AMMI2 biplot for PDI (Fig. 4a), more responsive genotypes and environments are displayed away from the
origin. E2 was the most differentiating environment followed by E4 and E6. Genotypes MT-9 (1), MT-25 (4), MT-45 (12),
MT-55 (14), MT-60 (17), MT-67 (21), MT-89 (31), MT-126 (46), MT-140 (53), MT-156 (59) MT-184 (68), MT-185 (69), MT-
187 (70) and MT-188 (71), were some of the most responsive lines as they were situated away from the origin while
genotypes MT-74 (26), MT-77 (27), MT-84 (29), MT-90 (32), MT-101 (37), MT-129 (48), MT-136 (51) and MT-166 (62)
situated in the vicinity of the origin were least responsive and hence more stable with respect to MLB disease
reactions. The genotypes falling in same sector with a particular environment shows positive interaction with that
environment while those falling in opposite sector showed opposite interaction with that environment. The genotypes
falling in adjacent sector to a particular environment showed complex interactions. Genotype MT- 136 (51) and MT-
166 (62) were situated closer to E2 while MT-35 (8), MT-69 (23), MT-93 (34) and MT-94 (35) were closer to E6 and
therefore, displayed better adaptation in respective environments.
The AMMI2 biplot for grain yield (Fig. 4b) revealed that genotypes MT-41 (11), MT-45 (12), MT-72 (24), MT-176 (66) are
away from the origin while genotypes MT-40 (10), MT-68 (22), MT-74 (26), MT-83 (28), MT-85 (30), MT-89 (31), MT-90
(32), MT-105 (38), MT-120 (45), MT-166 (62) are near the origin and thus they were respectively, more responsive and
more stable for grain yield. The E6 was most differentiating environment followed by E4 and E2. Hence E6 can be
used for screening of genotypes for grain yield. Genotypes MT-114 (42), MT-120 (45), MT-129 (48), MT-195 (73) were
closer to E2; genotypes MT-32 (7), MT-37 (9), MT-63 (19), MT-68 (22), MT-74 (26), MT-93 (34), MT-101 (37), MT-107
(39) were closer to E4 and genotypes MT-9 (1), MT-61 (18), MT-95 (36), MT-137 (52), MT-144 (54), MT-151 (56), MT-161
(61), MT-172 (64) were closer to E6 indicating their specific adaptation to the respective environments and therefore
varieties or hybrids derived from these genotypes can be recommended for cultivation in the respective environments.
GGE biplot analysis for PDI and grain yield
The magnitude of GEI was further studied by genotype and genotype x environment (GGE) biplot analysis. The first
two principal components (PCs) of the GGE biplot accounted for 85.5% (PC1 = 54.5%, PC2 = 31.0%) of the total
variation for PDI over three environments, while for grain yield the PCs explained a total of 99.2% (PC1 = 80.5%, PC2 =
18.7%) of the total variation.
The average environment coordination (AEC) view of GGE biplot for PDI (Fig. 5a) revealed that E6 was the most
discriminating environment followed by E4 while E2 was least discriminating. The average environment axis (AEA)
was used to show the ideal test environment for MLB. The E6 was placed closest to the “average environment” and
was considered suitable for MLB resistance screening. However, E4 and E2 being situated away from the AEA were
least representative of the ideal environment. For grain yield, E4 was identified as the most discriminating
environment followed by E2 while E6 was least discriminating environment (Fig. 5b). E4 on account of being located
closest to the AEA was also identified as the most representative of the ideal environment and was followed by E2.
Page 9/29The E6 was the least discriminative environment for grain yield. In Fig. 5a and Fig. 5b, the genotypes dispersed away
from the origin and distanced from each other were different with respect to MLB resistance and grain yield,
respectively. These genotypes were least stable and contributed to both G and GEI. While genotypes situated near to
the origin were highly stable and contributed insignificantly to both G and GEI as discussed by Persaud et al. (2019)
while evaluating rice genotypes in multiple environments for resistance to sheath blight.
An ideal test environment that can be recommended for testing of genotypes for a specific trait must have high
discriminating ability for the genotypes as well as be true representative of all the environments (Yan and Kang 2002;
Tekalign et al. 2017). In our study E6 had high discriminating ability for MLB resistance of genotypes and was also an
ideal representative of all the environments as evident from the AEC view of GGE biplot for PDI. The E6 can therefore
be recommended for selecting generally adapted genotypes for MLB resistance. For grain yield E4 could be used for
selecting broadly adapted genotypes. The E4 was discriminating but was not an ideal representative of test
environment this could therefore be used to select specifically adapted genotypes for MLB resistance as proposed by
Yan and Tinker (2005).
Which-won-where biplot for PDI and grain yield
The which-won-where biplot confirmed that only two mega environments existed for PDI (Fig. 6a). The E2 constitutes
one mega environment while E4 and E6 present in same sector constitute the second mega environment. Genotypes
MT- 60 (17) and MT-67 (21) were the vertex genotypes in the sector that had environments E4 and E6. As these
genotypes had high PC1 scores they were most susceptible to MLB in the environment they were located in. While MT-
184 (68) was the vertex genotype for the sector containing environment E2 and had negative PC1 score indicating it to
be the most resistant in E2. The other genotypes in the polygon view situated near the origin displayed low positive or
negative PC1 scores signifying moderate resistance to moderate susceptibility and showed reduced responsiveness
when compared with vertex genotypes (Tekalign et al. 2017) in a particular mega environment. For grain yield also
two mega environments were observed (Fig. 6b). One mega environment consisted of E2 and E4 and MT-183 (67) was
the vertex genotype while E6 was a part of second mega environment with MT-61 (18) and MT-72 (24) as vertex
genotypes displaying highest grain yield in their respective environments. These genotypes can therefore be
recommended as high yielding genotypes for their respective mega environments. Two mega environments for grain
yield with different winning genotypes were also detected by Erdemci (2018) while evaluating chickpea genotypes in
multi environment trials.
Stability of genotypes based on ASV for PDI and grain yield
ASV was calculated in order to estimate stability of genotypes with respect to MLB resistance and yield under three
environments (Table 6). The genotypes having lower ASV were said to be more stable. For PDI, the genotype MT-90
(32) with lowest ASV of 0.193 was observed to be the most stable. Other genotypes with lower ASV scores were MT-
148 (55), MT-77 (27), MT-151 (56), MT-120 (45), MT-172 (64) and MT-190 (72) having ASV scores of 0.210, 0.212,
0.214, 0.214, 0.214 and 0.214, respectively. These genotypes are assumed to exhibit broad adaptation for PDI while
genotypes MT-184 (68), MT-9 (1), MT-89 (31), MT-60 (17), MT-188 (71) with relatively higher ASV scores of 1.934,
1.695, 1.483, 1.308 and 1.286 are expected to show specific adaptation and greater GEI for PDI. The genotypes
identified to be promising were MT-83 (28), MT-40 (10), MT-85 (30), MT-105 (38) and MT-89 (31) with least ASV scores
of 0.056, 0.395, 0.993, 1.117 and 1.210, respectively. High ASV scores of 25.700, 19.494, 15.979, 15.950 and 14.473
were noted with MT-176 (66), MT-72 (24), MT-185 (69), MT-151 (56) and MT-41 (11), respectively and opined that such
situation leads to a tendency of specific adaptation of the genotypes. Gyawali et al. (2019) used the criteria of ASV in
their investigation and identified 16 genotypes with stable spot form of net blotch disease resistance in barley.
Page 10/29Identification of superior genotypes
Genotypic selection index (GSI) for MLB resistance and grain yield and simultaneous selection index was calculated
for 73 BILs (Table 7). Based on the GSI for PDI, five genotypes namely MT-148 (55), MT-190 (72), MT-19 (3), MT-26 (5)
and MT-137 (52) which had the lower GSIPDI score of 7, 11.5, 20.5, 21 and 32.5 amongst the evaluated BILs, exhibiting
high stability and increased MLB resistance across environments were identified (Table 8). The genotypes MT-120
(45), MT-166 (62), MT-14 (2), MT-37 (9) and MT-57 (15) having lower GSI of 13, 17, 18, 25.5 and 31, respectively, for
grain yield were identified. These genotypes possessed better adaptability and higher grain yield (Table 8). Summing
up the GSI for PDI and GSI for grain yield, the genotype exhibiting the lowest score was considered to be the best as it
combined stability and best trait mean for grain yield and resistance to MLB. Based on simultaneous selection index
(SSI) (Table 8) ten genotypes namely, MT-120 (45), MT-14 (2), MT-166 (62), MT-148 (55), MT-190 (72), MT-37 (9), MT-
19 (3), MT-114 (42), MT-77 (27) and MT-94 (35) with SSI of 54.5, 55, 57.5, 58, 58.5, 77.5, 81.5, 82, 88 and 88,
respectively, were identified to be promising. Such genotypes could be potential germplasm for development of high
yielding MLB resistant genotypes or can be used as parent in generating biparental mapping population.
Conclusion
The present investigation identified a total of 73 BILs displaying resistance to MLB in at least one of the
environments. AMMI1 biplot identified MT-148 (55) as genotype having high degree of resistance and lower
fluctuations to MLB while MT-172 (64) showed stable and susceptible disease response. The resistant genotypes can
therefore be used as potential donor for stable disease resistance trait and the susceptible line can be used for
producing pathogen inoculum for MLB screening notwithstanding the diverse environments. MT-120 (45) as revealed
by AMMI1 biplot could serve as source of high and stable grain yield. The study was also able to classify different
environments into various mega environment, as well as to identify the most discriminating ideal environments for
assessing the variability with respect to MLB resistance and grain yield. For both PDI and grain yield two mega
environments were identified. Mega environments are composed of environments falling in the same sector and
consisting of same winning genotypes. Genotypes MT-60 (17) and MT-67 (21) were winning genotypes in the sector
that had environments E4 and E6 for PDI. These genotypes showed highest MLB susceptible reaction in these
environments. Therefore, if MLB screening is undertaken in E4 or E6 these genotypes can be used as susceptible
checks. MT-184 (68) was the winning genotype for the sector containing environment E2 and showed resistant
response. This genotype would hence be important MLB resistance donor for breeding resistant genotypes
specifically adapted for E2. For development of high yielding varieties specifically for first mega environment
consisting of E2 and E4, MT-183 (67) could be used as donor while for E6 MT-61 (18) and MT-72 (24) could be used
as donor for high yield. The study ultimately identified ten genotypes namely, MT-120 (45), MT-14 (2), MT-166 (62),
MT-148 (55), MT-190 (72), MT-37 (9), MT-19 (3), MT-114 (42), MT-77 (27) and MT-94 (35) as the best genotypes
containing both high and stable MLB resistance and grain yield. These genotypes can serve as an important source of
MLB resistance and grain yield in future breeding programmes and after analysis of combining ability can also serve
as parent for development of hybrids or synthetic varieties characterized with resistance to MLB and possessing high
yield. As the studied BILs fall into highly susceptible, susceptible, resistant and highly resistant categories it could be
easily predicted that MLB resistance in these BILs were governed by both oligogenes and polygenes. However, this
study did not aim to dissect the genes or the mechanisms accompanying MLB resistance. Hence further research is
needed in this aspect to identify novel genes and QTLs governing MLB resistance so that the information can be
helpful in development of reliable MLB specific molecular markers. The developed molecular marker will then be
useful in reliable identification of resistant cultivars without the need to evaluate them in field trials which would
ultimately speed up the process of resistance breeding and varietal development.
Page 11/29Declarations
Funding
Innovation in Science Pursuit for Inspired Research (INSPIRE) scholarship of the Department of Science and
Technology and All India Coordinated Research Project on maize of ICAR, New Delhi.
Conflict of interest
The authors declare no conflict of interest.
Availability of data and material
Not applicable
Code availability
Not applicable
Author’s contribution
Conception or design of the work (AJ, NKS, RPS, JPJ, UP), Development of experimental material (NKS, AK, SA, AJ),
Data collection (AJ, SA), Data analysis and interpretation (AJ, NKS), Drafting the article (AJ), Critical revision of the
article (NKS).
Ethics approval
Not applicable
Consent to participate
Not applicable
Consent for publication
The authors grant the publisher consent to publish the manuscript.
Acknowledgements
The Innovation in Science Pursuit for Inspired Research (INSPIRE) scholarship of the Department of Science and
Technology, Ministry of Science and Technology, Government of India received by the first author for her PhD degree
program as well as the technical and financial support from All India Coordinated Research Project on maize of ICAR,
New Delhi is duly acknowledged.
References
Adhikari S, Joshi A, Kumar A, Singh NK (2021) Diversification of maize (Zea mays L.) through teosinte (Zea mays
subsp.parviglumisIltis&Doebley) allelic introgression. Genetic Resources and Crop Evolution.
https://doi.org/10.1007/s10722-021-01170-z.
Page 12/29Adhikari S, Joshi A, Singh NK (2019) Phenotypic characterization and microsatellite marker analysis of elite maize
inbred and teosinte (Zea mays ssp.parviglumis) accession. Pantnagar Journal of Research 17(2):123-128.
Adjebeng-Danquah J, Manu-Aduening J, Gracen VE, Asante IK, Offei SK (2017) AMMI stability analysis and estimation
of genetic parameters for growth and yield components in cassava in the forest and guinea savannah ecologies of
Ghana. International Journal of Agronomy, https://doi.org/10.1155/2017/8075846.
Aina O.O., Dixon A.G.O., Akinrinde E.A. (2007) Additive main effects and multiplicative interaction (AMMI) analysis for
yield of cassava in Nigeria. Journal of Biological Sciences 7:796-800.
Aktas B, Ure T (2020) Evaluation of multi-environment grain yield trials in maize hybrids by GGE-Biplot analysis
method. Maydica 65:3. https://journals-crea.4science.it/index.php/maydica/article/view/2194/1320.
Anonymous (2008) Importance and Utilization of Maize. Corn India. http://cornindia.com/importance-and-utilisation-
of-maize/.
Anonymous (2018) Corn/Maize – Bayer - Crop Science. https://www.cropscience.bayer.com/en/crop-
compendium/crops/corn-maize.
Carson ML, Stuber CW, Senior ML (2004) Identification and mapping of quantitative trait loci conditioning resistance
to southern leaf blight of maize caused by Cochliobolusheterostrophus race O. Phytopathology 94: 862-867.
Chalwe A, Chiona M, Sichilima S, Njovu J, Chama C, Ndhlovu D (2017) Genotype stability index for root yield and
tolerance to sweetpotato weevil Cylaspuncticolis: A tool for identifying climate smart varieties. Open Agriculture
2:166–174.
Chang RY, Peterson PA (1995) Genetic control of resistance to Bipolaris maydis: One gene or two genes? Journal of
Heredity 86:94–97.
Dia M, Wehner TC, Arellano C (2016b) Analysis of genotype x environment interaction (GxE) using SAS programming.
Agronomy Journal 108 (5):1-15.
Dia M, Wehner TC, Hassell R, Price DS, Boyhan GE, Olson S, King S, Davis AR, Tolla GE (2016a) Genotype x
environment interaction and stability analysis for watermelon fruit yield in the United States. Crop Science 56:1645-
1661.
Doebley J, Goodman M, Stuber C (1984) Isoenzymatic variation in Zea (Gramineae). Syst Bot 93: 203–218.
Doebley JF, Goodman MM, Stuber CW (1984) Isoenzymatic variation in Zea(Gramineae). Systematic Botany 9:203-
218.
Eberhart SA, Russell WA (1966) Stability parameters for comparing varieties. Crop Science 6:36-40.
Erdemcı I (2018) Investigation of Genotype x Environment interaction in chickpea genotypes using AMMI and GGE
biplot analysis. Turkish Journal Of Field Crops 23(1):20-26.
Faluyi JO, Olorode O (1984) Inheritance of resistance to Helminthosporium maydis blight in maize (Zea mays L.).
Theoretical and Applied Genetics 67:341–344.
Page 13/29Francis TR, Kannenberg LW (1978) Yield stability in short-season maize. I. A descriptive method for grouping
genotypes. Canadian Journal of Plant Science 58:1029-034.
Gauch HG, Zobel RW (1996) AMMI analysis of yield trials. Page 85-122 in: Genotype by environment interaction. M. S.
Kang and H. G. Gauch, eds. CRC Press, Boca Raton, FL. https://doi.org/10.1201/9781420049374.ch4 Crossref.
Gyawali S, Amezrou R, Verma RPS, Brueggeman R, Rehman S, Belqadi L, Arbaoui M, Tamang P, Singh M (2019)
Seedling and adult stage resistance to spot form of net blotch (SFNB) in spring barley and stability of adult stage
resistance to SFNB in Morocco. European Journal of Plant Pathology 153:475–487.
Hagos HG, and Abay F (2013) AMMI and GGE biplot analysis of bread wheat genotypes in the northern part of
Ethiopia. Journal of Plant Breeding and Genetics 1:12–18.
Hellin J, Erenstein O (2009) Maize-Poultry Value Chains in India: Implications for Research and Development. Journal
of New Seeds 10:245-263. 10.1080/15228860903303932.
Hooda KS, Bagaria PK, Khokhar M, Kaur H, Rakshit S (2018) Mass Screening Techniques for Resistance to Maize
Diseases. ICAR-Indian Institute of Maize Research, PAU Campus, Ludhiana- 141004, 93pp.
Joshi A, Adhikari S, Singh NK (2021) Mapping genomic regions for red flour beetle (Triboliumcastaneum (Herbst))
resistance in teosinte (Zea mays L. subsp. parviglumis H. H. Iltis&Doebley) derived maize backcross inbred line
population. Genetic Resources and Crop Evolution 68(4):1529-1544.https://doi.org/10.1007/s10722-020-01083-3.
Kumar A, Jat SL, Kumar R, Yadav OP (2013) Directorate of Maize Research, Pusa Campus, New Delhi- 110 012, 123p.
https://iimr.icar.gov.in/wp-content/uploads/2020/03/Maize-production-system-book.pdf.
Kumar A, Singh NK, Adhikari S and Joshi A (2019) Morphological and molecular characterization of teosinte derived
maize population. Indian Journal of Genetics and Plant Breeding. 79(4):670-677.
Kumar B, Hooda KS, Gogoi R, Kumar V, Kumar S, Abhishek A et al. (2016) Inheritance study and stable sources of
maydis leaf blight (Cochliobolusheterostrophus) resistance in tropical maize germplasm. Cereal Research
Communication 44:424–434.
Kumar R, Srinivas K, Sivaramane N (2013) Assessment of the maize situation, outlook and investment opportunities
in India. Country Report – Regional Assessment Asia (MAIZE-CRP), National Academy of Agricultural Research
Management, Hyderabad, India. https://naarm.org.in/wp-content/uploads/2016/07/Assessment-of-the-Maize-
Situation-outlook-and-investment-opportunities-in-India.pdf.
Lennon J, Krakowsky M, Goodman M, Flint-Garcia S, Balint-Kurti PJ (2016) Identification of alleles conferring
resistance to gray leaf spot in maize derived from its wild progenitor species teosinte. Crop Science 56:209–218.
Lennon JR, Krakowsky M, Goodman M, Flint-Garciz S, Balint-Kurti PJ (2017) Identification of teosinte alleles for
resistance to southern leaf blight in near isogenic maize lines. Crop Science 57:1973–1983.
Lin CS, Binns MR (1988) A superiority measure of cultivar performance for cultivar x location data. Canadian Journal
of Plant Science 68:193-198.
Liu Z, Cook J, Melia-Hancock S, Guill K, Bottoms C, Garcia A, Ott O, Nelson R, Recker J, Balint-Kurti P, Larsson S, Lepak
N, Buckler E, Trimble L, Tracy W, McMullen MD, Flint-Garcia SA (2016) Expanding maize genetic resources with
Page 14/29predomestication alleles: maize–teosinte introgression populations. Plant Genome 9:1.
Mafouasson HNA, Gracen V, Yeboah MA, Ntsomboh-Ntsefong G., Tandzi LN, Mutengwa CS (2018) Genotype-by-
Environment Interaction and Yield Stability of Maize Single Cross Hybrids Developed from Tropical Inbred
Lines. Agronomy8:62. https://doi.org/10.3390/agronomy8050062.
Mohammadi R, Davood SE, Mohammad A, Ahmed A (2011) Evaluation of durum wheat experimental lines under
different climate and water regime conditions of Iran. Crop and Pasture Science 62:137-151.
Mubeen S, Rafique M, Farooq M, Hassaan HM, Chaudhary J (2017) Study of southern corn leaf blight (SCLB) on
maize genotypes and its effect on yield. Journal of the Saudi Society of Agricultural Sciences 16 (3):210-217.
Mukherjee AK, Mohapatra NK, Bose LK, Jambhulkar NN Nayak P (2013) Additive main effects and multiplicative
interaction (AMMI) analysis of G × E interactions in rice-blast pathosystem to identify stable resistant genotypes.
African Journal of Agricultural Research 8:5492-5507.
Nayak D, Bose LK, Singh S, Nayak P (2008) Additive main effects and multiplicative interaction analysis of host-
pathogen relationship in rice bacterial-blight pathosystem. Plant Pathology Journal 24:337-351.
Ott OO (2008) The Search for Novel Resistance Alleles: Screening Teosinte-Maize Introgression Lines for Resistance
to Northern Leaf Blight. Honors Thesis Presented to the College of Agriculture and Life Sciences, Plant Science
Research Honors Program, of Cornell University in Partial Fulfillment of the Requirements for the Research Honors
Program.
Pate JB, Harvey PH (1954) Studies on the inheritance of resistance in corn to Helminthosporium maydis leaf spot.
Agronomy Journal 46:442–445.
Payak MM, Sharma RC (1985) Maize diseases and approaches to their management in India. Tropical Pest
Management 31(4):302-310.
Perkins JM, Jinks JD (1968) Environmental and genotype-environmental components of variability. III. Multiple lines
and crosses. Heredity 23:339-356.
Persaud R, Saravanakumar D (2018) Screening for blast resistance in rice using AMMI models to understand G x E
interaction in Guyana. Phytoparasitica https://doi.org/10.1007/s12600-018-0681-7.
Persaud R, Saravanakumar D, Persaud M (2019) Identification of resistant cultivars for sheath blight and use of AMMI
models to understand genotype and environment interactions. Plant Disease 103:2204-2211.
Purchase JL, Hatting H, Van Deventer CS (2000) Genotype * environment interaction of wheat in South Africa: stability
analysis of yield performance. South African Journal of Plant and Soil 17(3):101–107.
Sahoo S, Adhikari S, Joshi A, Singh NK (2021) Use of Wild Progenitor Teosinte in Maize (Zea mays subsp. mays)
Improvement: Present Status and Future Prospects. Tropical Plant Biology. https://doi.org/10.1007/s12042-021-
09288-1.
Shukla GK (1972) Some statistical aspects of partitioning genotype environmental components of variability. Heredity
29:237-245.
Page 15/29Sibiya J, Tongoona P, Derera J, Rij NV (2012) Genetic analysis and genotype 3 environment (G 3 E) for grey leaf spot
disease resistance in elite African maize (Zea mays L.) germplasm. Euphytica 185:349–362.
Singh NK, Joshi A, Sahoo S, Prasad B (2021) Resistance Breeding and Exploitation of Wild Relatives for New
Resistance Sources. In: Singh K.P., Jahagirdar S., Sarma B.K. (eds) Emerging Trends in Plant Pathology. Springer,
Singapore. https://doi.org/10.1007/978-981-15-6275-4_10.
Singh NK, Kumar A, Chandra H, Pal K, Verma SS (2017) Enhancement of maize allelic diversity using wild relative
teosinte (Zea mays ssp. Parviglumis). Indian Journal of Plant Genetic Resources 30(3):253–257.
Ssemakula G, Dixon AGO (2007) Genotype x environment interaction, stability and agronomic performance of
carotenoid-rich cassava clones. Scientific Research and Essay 2:390-399.
Teixeira FF,Guimarães CT (2021) Maize genetic resources and pre-breeding. Wild germplasm for genetic improvement
in crop plants. 81-99. https://doi.org/10.1016/B978-0-12-822137-2.00005-9.
Tekalign A, Sibiya J, Derera J, Fikre A (2017) Analysis of genotype × environment interaction and stability for grain
yield and chocolate spot (Botrytis fabae) disease resistance in faba bean (Vicia faba). Australian Journal of Crop
Science 11(10):1228-1235.
Wallace JG, Larsson SJ, Buckler ES (2014) Entering the second century of maize quantitative genetics.
Heredity 112:30-38.
Wei J, Lui K, Chen J, Luo P, Stadelmann OY (1988) Pathological and physiological identification of race C of Bipolaris
maydis in China. Phytopathology 78: 550-554.
Wricke G (1962) On a method of understanding the biological diversity in field research. Z. Pflanzenzucht 47:92-46.
Yaghotipoor A, Farshadfar E (2007) Non-parametric estimation and component analysis of phenotypic stability in
chickpea (Cicer arietinum L.). Pakistan Journal of Biological Science 10:2646- 2652.
Yan W, Cornelius PL, Crossa J, Hunt LA (2001) Two types of GGE biplots for analysing multi-environment trial data.
Crop Science 41:656-663.
Yan W, Kang MS (2002) A graphical tool for breeders, geneticists, and agronomists. CRC Press, UK.
Yan W, Tinker NA (2005) An integrated biplot analysis system for displaying, interpreting, and exploring genotype ×
environment interaction. Crop Science 45:1004-1016.
Zaitlin D, DeMars S, Ma Y (1993) Linkage of rhm, a recessive gene for resistance to southern corn leaf blight, to RFLP
marker loci in maize (Zea mays) seedlings. Genome 36:555–564.
Tables
Table 1: Description of the environments
Page 16/29Environment Total Total Relative humidity Sun Wind Evaporation Source of
rainfall temperature during trial (%) shine velocity (mm) MLB
during during trial hrs (Km/hr) infection
trial (˚ Celsius)
(mm)
Max Min Morning Afternoon
(07 hrs) (14 hrs)
E2 12.3 31.4 22.7 89 72.9 5.0 4.1 3.6 Artificial
inoculation
E4 9.5 30.7 20.6 90 70.0 5.4 3.8 3.2 Artificial
inoculation
E6 9.5 30.7 20.6 90 70.0 5.4 3.8 3.2 Natural
inoculation
Table 2: Scale used for assessing MLB resistance in maize*.
Rating Degree of infection PDI Disease
scale reaction
(% Diseased leaf area)
1.0 Nil to very slight infection (≤10%). ≤11.11 Resistant
(R)
2.0 Slight infection, a few lesions scattered on two lower leaves (10.1-20%). 22.22 (Score: ≤
3.0)
3.0 Light infection, moderate number of lesions scattered on four lower leaves 33.33
(20.1-30%). (PDI: ≤
33.33)
4.0 Light infection, moderate number of lesions scattered on lower leaves, a few 44.44 Moderately
lesions scattered on middle leaves below the cob (30.1-40%). resistant
(MR)
5.0 Moderate infection, abundant number of lesions scattered on lower leaves, 55.55 (Score:
moderate number of lesions scattered on middle leaves below the cob (40.1- 3.1–5.0)
50%).
(PDI: 33.34-
55.55)
6.0 Heavy infection, abundant number of lesions scattered on lower leaves, 66.66 Mod.
moderate infection on middle leaves and a few lesions on two leaves above susceptible
the cob (50.1-60%). (MS)
(Score: 5.1-
7.0 Heavy infection, abundant number of lesions scattered on lower and middle 77.77 7.0)
leaves and moderate number of lesions on two to four leaves above the cob
(60.1-70%). (PDI: 55.56-
77.77)
8.0 Very heavy infection, lesions abundant scattered on lower and middle leaves 88.88 Susceptible
and spreading up to the flag leaf (70.1-80%). (S)
(Score:
>7.0)
9.0 Very heavy infection, lesions abundant scattered on almost all the leaves, 99.99
plant prematurely dried and killed (>80%).
(PDI:
>77.77)
*Hooda et al. (2018)
Page 17/29You can also read


