SINE2020 GENERAL ASSEMBLY - WP 6 MACROMOLECULAR CRYSTALLOGENESIS PROGRESS REPORT FROM JULICH - JUSER
←
→
Page content transcription
If your browser does not render page correctly, please read the page content below
SINE2020 General Assembly

WP 6 Macromolecular Crystallogenesis

   Progress report from Julich

         Marialucia Longo
        Tobias E. Schrader

        Parma, 04.06.2018
Outline:

1 Vapour diffusion studies on Streptavidin with Biotin

2 Temporal evolution of the crystallization process of
  lysozyme with small angle scattering techniques

3 Temporal evolution of the crystallization process of
  lysozyme by means of Neutron diffraction

4 In-situ macroseeding crystallization apparatus
1 Vapour diffusion studies on Streptavidin with Biotin
1. Vapour diffusion studies on Streptavidin with Biotin

Homotetrameric protein (52.8 kDa)

Each monomer of the protein binds one molecules
of Biotin (Vitamin H) non-covalently

Kd ≈ 10-14 mol/L

One of the strongest non-covalent interaction known

                              222 symmetry

                              The tetramer can be considered as a dimer of
                              a dimer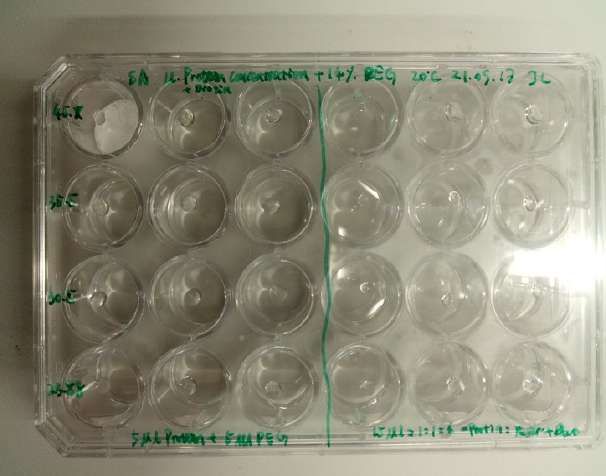
What is the origin of the binding energy?

Tryptophan contact (Trp79,Trp92,Trp10
Trp 120):
• Hydrophobic interaction
• Van der Waals interaction

Specific hydrogen bonding
interaction:
Asn23, Tyr 43, Ser27,Ser45, Asp45,
Ser88, Asp128

 Asp45 key residue

Neutron crystallography to obtain information
on the exact hydrogen pattern
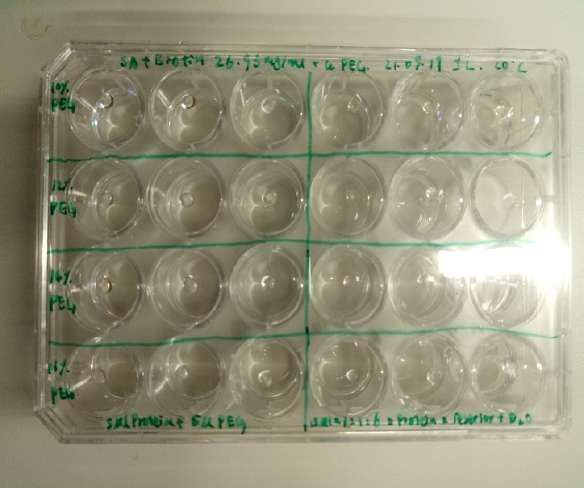
1. Vapour diffusion studies on Streptavidin with Biotin

   Hanging drop                      • Streptavidin + Biotin at constant
                                       concentration of 26.6 mg/ml

                                     • Buffer solution:10 mM Tris/DCl pD=7.5
                                       with 100 mM NaCl added

                                     • Different PEG concentration (10%-16%)
                                       in reservoir solution

                                     • Reservoir solution: 100mM MES/NaOD,
                                       pH=6.0

                                     • T=20°C

 Best PEG concentration condition: 14 to 16 % PEG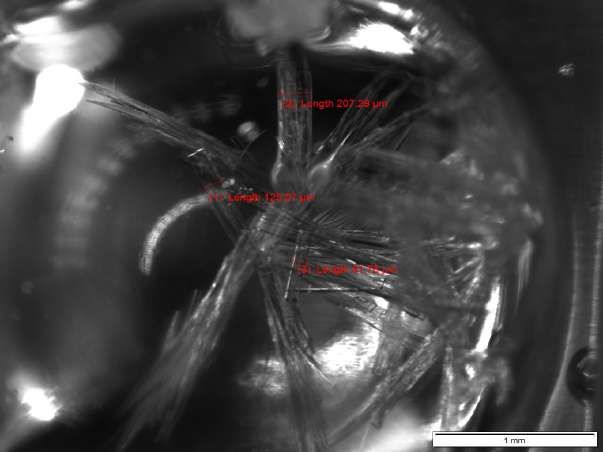
1. Vapour diffusion studies on Streptavidin with Biotin
   Hanging drop
                                       • Fixed PEG concentration at 14%

                                       • Protein concentration (23.9-45)mg/
                                         ml

                                       • 1:1 mixture of reservoir and protein
                                         solution

                                       • T=20°C

 Best results: protein concentration in the range (30.5-35.5) mg/ml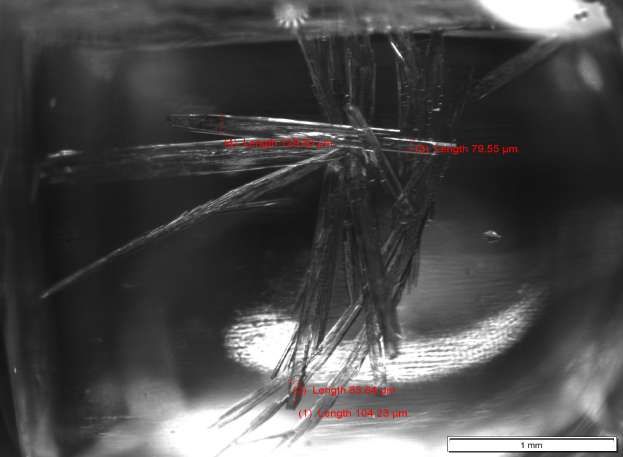
1. Sitting drop method results:

 Condition 1:
                                      Best results: 80mM NaCl
 Fixed concentration: 14% PEG         concentration

 •   Protein concentration:30 mg/ml   Crystal volume: 1 x 0.15 x 0.15 mm3

 •   Buffer: 10 mM Tris/DCl @ 7.5pD

 •   Salt concentration: 60, 70,
     80,90 mM NaCl

 •   Reservoir solution:100 mM MES
     @ 6.0 pD

 •   T=20°C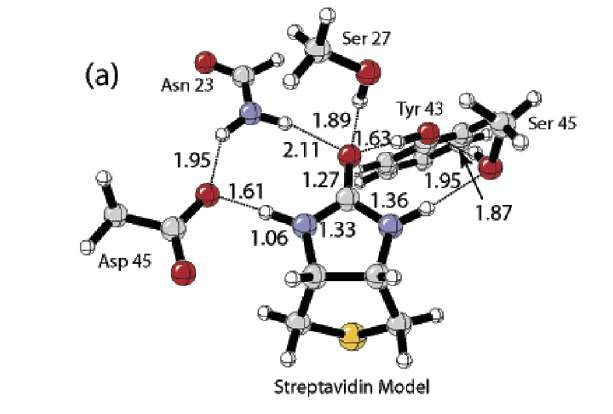
1. Sitting drop method results:

 Condition 2:
                                    Best results: 90mM NaCl
 Fixed concentration: 16% PEG       concentration

 •   Protein concentration:30 mg/   Crystal volume: 1 x 0.13 x 0.13 mm3
     ml

 •   Buffer: 10 mM Tris/DCl @
     7.5pD

 •   Salt concentration: 60, 70,
     80,90 mM NaCl

 •   Reservoir solution:100 mM
     MES @ 6.0 pD

 •   T=20°C
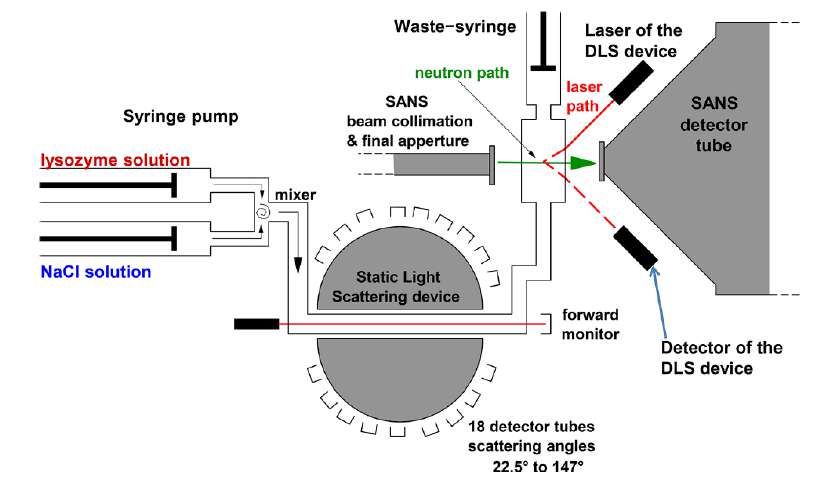
2. Temporal evolution of the crystallization process of
    lysozyme with small angle scattering techniques
2. Temporal evolution of the crystallization process of lysozyme with small angle scattering techniques DLCA (Diffusion Limited Cluster- Cluster Aggregation) EB
2. Temporal evolution of the crystallization process of lysozyme
with small angle scattering techniques

  The crystal growth is due to not only by the addition of small dimers, but also
  of large fractal aggregates.
4. Temporal evolution of the crystallization of
Lysozyme with neutron diffraction @ BIODIFF
(FRM II,Garching)
Temporal evolution of the crystallization of Lysozyme with
neutron diffraction @ BIODIFF (FRM II,Garching)

 Goal: study of the origin and evolution of Bragg Peaks during the crystallization
       process of Hen-egg White Lysozyme

  No diffraction pattern at the beginning of the experiment: protein solution!
Temporal evolution of the crystallization of Lysozyme with neutron diffraction @ BIODIFF Diffraction pattern after 70 hours:
Temporal evolution of the crystallization of Lysozyme with
neutron diffraction @ BIODIFF
 Integrated intensity of the Bragg peaks as a function of the time:
                                                              X Axis Title
                                             0           20           40     60   80
                                                                                    10

                                       1.4
                                                 Peak5
                                                 Peak2
     Normalized Integrated Intensity

                                                                                   8
                                                 Peak3
                                       1.2       Peak4
                                                 Peak1

                                                                                         Y Axis Title
                                                 Peak6                             6
                                       1.0       Peak7
                                                 Peak8
                                                                                   4
                                       0.8

                                       0.6                                         2

                                       0.4                                          0
                                             0           20           40     60   80
                                                               Time (h)
Temporal evolution of the crystallization of Lysozyme with
neutron diffraction @ BIODIFF
The normalized intensity peak are well fitted by a sigmoid function:
X Axis Title
0 10 20 30 40 50 60 70 0.0 0.5 1.0 1.5 2.0 2.5
Integrated Intensity Peak
70 70
Sigmoid function Inflection point
1.0
1.2
60 60
Normalized Intensity
Inflection Point (h)
50 50
Y Axis Title
Y Axis Title
0.8 40 40
0.8
30 30
0.4 20 20
0.6
10 10
0.0 0 0
0 10 20 30 40 50 60 70 0 5 10 15 20
Time (h) Peak numbers
Inflection point Isotropic growth of the crystal4. In-situ macroseeding crystallization apparatus
4. In-situ macroseeding crystallization apparatus
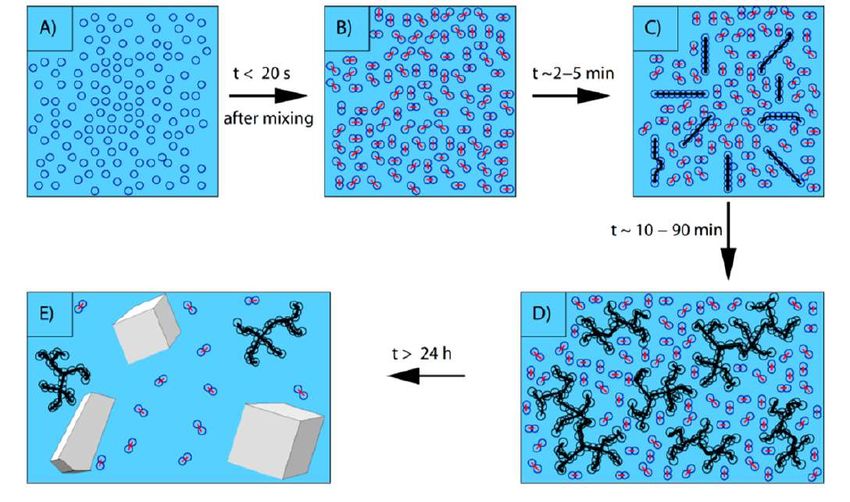
Nucleation:
Transition from a disordered
state to an ordered one
How?
High level of supersaturation
Growth of large crystal:
Increasing of the crystal size
How?
Lower level of supersaturationSeparation of Nucleation and Growth
How? Nucleated crystals are introduces as “seeds” in
new drop at lower level of supersaturation.
Microseeding: Macroseeding:
Transfer of submicroscopic
Transfer of single crystal
seeds: too small to be
distinguished
Disavantages: Disavantages:
It is not possible to The moving of the
control the number of crystal seed is most likely
transferred seeds not easyHow do we reach the Metastable zone from the nucleation zone?
CPROTEIN=k Solubility-1
CPEG=k Solubility-1
Metastable
zone
• Lower the CPROTEIN and/or
CPRECIPITANT
• Seed in a completely different
mother liquor
Seed without moving the seeds: in-situ seedingIn-situ macroseeding apparatus:
Change the crystallization condition without move the crystal:
• Round flat glass windows (20 mm diameter and
1 mm thickness)
• Crystallization chamber • O-ring
Internal volume ≈ 0.5 ml3 • Internal spacer built by a 3-D printerInverted microscope to visualize
the crystal during the growth
Peltier Element to control and keep
constant the temperature during the
crystallization process
Symmetric Round shape: isotropic
diffusion of heat
Central hole: inverted microscope useIn-situ macroseeding apparatus: The exchange of the mother liquor is allowed by means of two capillarity built in the spacer Prevent Continuous variation from solution 1 osmotic shock: to solution 2 with a slow gradient
How can we avoid microconvective flux?

 Sitting drop bridge in the                      Micro-pipe to change the drop
 crystallization chamber                         Crystallization condition e.g.
                                                 more protein
                                                 (3D built)

Powerful flexibility of the set-up due to the 3D printing option
Thanks for the attention!
You can also read