Skyfall 2020: Smartphone data from a 36 km drop - Preprints.org
←
→
Page content transcription
If your browser does not render page correctly, please read the page content below
Preprints (www.preprints.org) | NOT PEER-REVIEWED | Posted: 8 September 2021

               Article
              Skyfall 2020: Smartphone data from a 36 km drop
              Milton Garcés 1,2, Daniel Bowman 3, Cleat Zeiler 4, Anthony Christe 2, Tyler Yoshiyama 1, Brian
              Williams 1, Meritxell Colet 1, Samuel Takazawa 1, Sarah Popenhagen 1, Yusuke Hatanaka 1,
              Jonathan Tobin 1, 5, Kale McLin 4
               1   Infrasound Laboratory, University of Hawaii, Manoa, HI 96740, USA; milton@isla.hawaii.edu
               2   RedVox, Inc., Kailua-Kona, HI 96740, USA
               3   Sandia National Laboratories, Albuquerque, NM 87123, USA
               4   Nevada National Security Site, Nevada, USA
               5   Augustus Aerospace Company

               Abstract: A smartphone plummeted from a stratospheric height of 36 km (~119,000 feet), providing
               a complete record of its rapid descent and abrupt deceleration when it hit the ground. The
               smartphone was configured to collect internal sensor data at high rates. We discuss the state-of-the-
               art of smartphone environmental and sensing capabilities at the closing of year 2020 and present a
               flexible mobile sensor data model. The associated open-source application programing interface
               (API) and python software development kit (SDK) used in this work is transportable to any
               hardware platform and operating system.

               Keywords: smartphones; balloons, internet of things; cyber-physical systems

              1. Introduction
                   A smartphone was hoisted by a helium-filled mylar balloon over southern Nevada, USA, to
              capture high-altitude acoustic signatures from a surface chemical explosion on October 27, 2020 [1].
              The smartphone was running the RedVox [2, 3] application to collect geophysical and state of health
              information using its on-board sensors. Additional location and barometric pressure information was
              provided by a HAB Bounder Balloon Cut-Down Device [4]. The balloon reached an altitude of 36.3
              km before the payload was released and fell back to Earth. The payload descent through the
              stratosphere and troposphere was slowed down by a parachute. Although the landing was abrupt –
              as expected from a non-steerable canopy - the instruments were recovered intact and have been
              deployed in subsequent missions.
                   This paper concentrates on the geophysical data recorded by the smartphone during its rapid
              descent until hits the ground ~30 minutes later. Signals from the explosion are explicitly excluded in
              this work as they are part of separate studies [1, 5].
                   The primary aims of this paper are to demonstrate how commercial, off-the-shelf smartphones
              can be viable geophysical data collection platforms and to provide algorithms and open-source code
              to access their digital sensor data. We describe one approach to handling these data under the RedVox
              Application Programming Interface (API) [6] and associated Software Development Kit (SDK) [7].
              The RedVox-Pandas [8] framework builds on the Pandas [9] serialized data structures and is used to
              process the smartphone data. The raw data [10] and open-source code [8] used in this paper are
              provided, and a reader with minimal Python experience should be able to reproduce the results.
                   Since smartphones and their kindred cyber-physical platforms are rapidly evolving, this paper
              will only be a snapshot of the technology at the closing of the year 2020. To compensate for this rapid
              obsolescence cycle, we also report on present-generation RedVox API 1000 (API M) which was
              released globally in June 2021 through the Google Play and Apple App stores. Some of the merits
              and limitations of the API 900 deployed in 2020 are highlighted, with strategies to overcome known
              issues. The RedVox SDK converts now-obsolete API 900 to the current API M field specifications.

           © 2021 by the author(s). Distributed under a Creative Commons CC BY license.
Preprints (www.preprints.org) | NOT PEER-REVIEWED | Posted: 8 September 2021

              As of the time of this writing, data collection and transmission under API M has been implemented
              in Android, iOS, Linux, and Mac OS operating systems.

              2. Materials and Methods
                   This paper presents data collected during the Skyfall plunge, starting at a height of ~36 km a few
              seconds before the initiation of descent and ending on the ground. The raw smartphone data are
              available at http://redvox.io/@/3f3f [6]
                   Although human-readable local time is more readily accessible in daily life, our computations
              use Unix time (also referred to as the epoch time) UTC, the number of seconds since 1 January 1970
              relative to the Greenwich meridian. Although our highest sample rate was only 8 kHz, present-day
              smartphone audio systems are able to record at 192 kHz, corresponding to a sampling interval of 5.2
              microseconds. Throughout this work, the native unit of time for computations is epoch in
              microseconds.

              2.1. Balloon platform
                   The flight system consisted of a 4 kg Totex [11] weather balloon carrying a 2.25 kg
              instrumentation package (Figure 1). The flight line consisted of a 10 m paracord tether from the
              balloon nozzle to a Balloon Ascent Technologies HAB Bounder Balloon Cut-Down Device [4]. The
              Bounder was geofenced to automatically terminate the flight if the balloon approached the Las Vegas
              metro area. The Bounder was connected to a fishing swivel, which was tied to the top loop of a 4 ft
              Rocketman parachute [12]. The descent rate for the 4 ft (1.21 m) standard parachute at 5 lbs (2.3 kg)
              is specified at 20ft/s (6 m/s ~ 21 km/h). The fishing swivel allows the payload to rotate independently
              of the balloon, which tends to prevent violent spinning during ascent. A High-Altitude Science
              Stratotrack APRS (Automated Packet Reporting System) [13] transmitter beneath the parachute was
              intended to provide one minute balloon location and ambient temperature readings during flight.

                   Figure 1. A meteorological balloon carrying infrasound sensors in a PolarTech insulated shipping
                   container in 2015. The parachute is visible between the box and the balloon. The Skyfall setup is
                   very similar to the one described here.
Preprints (www.preprints.org) | NOT PEER-REVIEWED | Posted: 8 September 2021

                    The key elements of the payload box consisted of a PolarTech insulated shipping carton
              containing a SPOT Trace [14] asset tracker to report the landing location, and a Samsung Galaxy S10
              [15] in a protective case taped screen-down to the bottom of the box. The dimensions of the payload
              box were L15” x W13” x H10” (~38.1 cm long, 33 cm wide, and 25.4 cm high); the rectangular shape
              of the payload enclosure may have helped stabilize the descent, as the vertical axis remained
              relatively stable until impact. The payload box was sealed with duct tape prior to launch, but a hole
              in the side allowed a venting tube to pass between the outside air and the interior of the box.
                    There were four independent instruments for estimating location; however, two of the four
              instruments only provided sparse estimates intended for recovery. The APRS and SPOT trace were
              primarily intended to provide redundancy for the payload recovery. Only the Bounder and the S10
              smartphone had sufficiently high sample rates to reconstruct the details of the rapid descent
              trajectory, and both of these instruments had a barometer to provide secondary height estimates. The
              Bounder relies exclusively on the Global Navigation Satellite System (GNSS) for position, whereas
              the S10 uses both GNSS and cellular location when available. Only the RedVox S10 used a cellular
              network to transmit data in real time when possible.
                    The balloon was inflated in a hangar from Desert Rock Airport, then launched at 12:16 UTC,
              October 27, 2020 into a brisk wind blowing to the south/southwest. The APRS tracker provided the
              balloon’s location every minute until it became too cold during the early dawn ascent. It resumed
              reporting positions once the sun had risen above the horizon and the unit had risen high enough in
              the stratosphere for ambient temperatures to come back into range.
                    The balloon burst at 13:47:50 UTC at an altitude of 36,296 m, landing at 14:13:25 UTC at an
              elevation of 1,038 m. Landing was first indicated by the RedVox phone, which reported that it was
              no longer moving and that the ambient temperature was rising as the payload box warmed up after
              landfall. The SPOT Trace then confirmed the landing site. The payload was recovered at 1700 UTC
              on the same day. The payload box was upside down, and large amounts of balloon material was
              tangled on the flight line and the parachute (Figure 2). This suggests that the parachute may not
              have deployed properly and that the payload may have descended faster than planned. Although
              the box was externally scraped after the landing, the S10 was undamaged and has been redeployed
              in other missions.
Preprints (www.preprints.org) | NOT PEER-REVIEWED | Posted: 8 September 2021

                  Figure 2. Landing site, with payload box flipped upside down on the lower right and the parachute
                  (blue and red) tangled with balloon shreds in the upper left.

              2.2. Bounder
                    We use the Balloon Ascent Technologies HAB Bounder TM Balloon Cut-Down Device [4] as a
              primary reference for the balloon trajectory. Unlike smartphones, the Bounder is designed for high-
              altitude balloons (HAB) so its barometer specifications are better matched to the 36 km balloon
              height. Furthermore, the Bounder provides a continuous record, whereas the smartphone location
              has a gap at the higher altitudes.
                    The Bounder exports balloon GNSS location and barometric pressure data collected at a rate of
              ~ 1 Hz to a text file. Per the documentation sheet, the pressure rating on the Bounder barometer is 8
              to 1200 hPa (0.8 – 120 kPa). The Bounder trajectory fields and observations for the event of interest
              are presented in Tables 1 and 2 and shown in Figure 3; this paper concentrates on the rapid descent
              after the peak height shown to the right of the red arrow in Figure 3. The Bounder’s peak recorded
              elevation at 13:47:50 GMT was 36,296 m above the WGS84 geoid, and the balloon was still ascending
              before the payload release.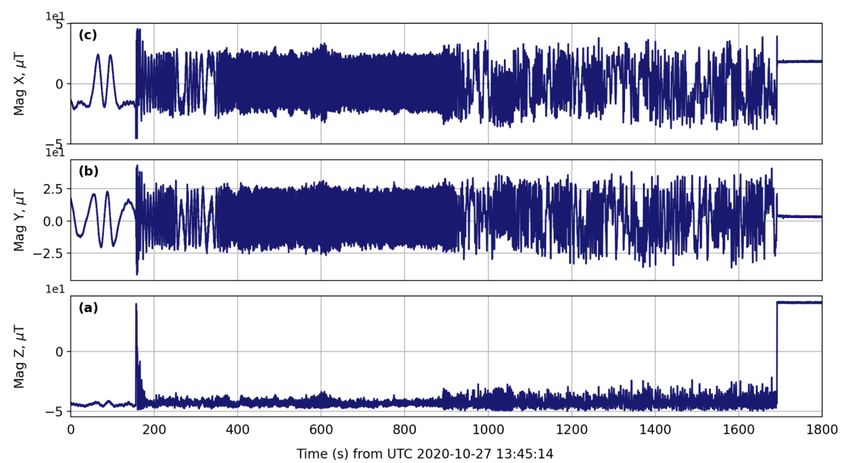
Preprints (www.preprints.org) | NOT PEER-REVIEWED | Posted: 8 September 2021

                                                    Table 1. Bounder Event Information

                                  Description                         Value

                                  Start Date Time                     2020-10-27 13:45:00

                                  Start Epoch s                       1603806300

                                  Start Latitude degrees              36.07616

                                  Start Longitude degrees             -115.62339

                                  Start Altitude m (WGS-84)           35538

                                  Stop Date Time                      2020-10-27 14:16:00

                                  Start Epoch s                       1603808160

                                  Stop Latitude degrees               35.83728

                                  Stop Longitude degrees              -115.57234

                                                     Table 2. Bounder Location Sensor

                           Description               Field                               Units

                           Pres                      Atmospheric pressure                hPa = mbar

                           Lon /Lat                  GNSS longitude and latitude         degree decimal

                           Alt                       GNSS altitude above ellipsoid       meters

                           Date                      GNSS date                           YYYMMDD

                           Time                      GNSS time                           HH:MM:SS

                           Sample Interval           1.004, Derived from Time            seconds

                           Interval St Dev           0.061, Derived from Time            seconds
Preprints (www.preprints.org) | NOT PEER-REVIEWED | Posted: 8 September 2021

                  Figure 3. Balloon trajectory for complete event. The Skyfall data concentrates on the rapid descent.

              2.3. Smartphone
                   All modern-day commercial-off-the-shelf (COTS) smartphones come loaded with a suite of
              advanced small weight, power, and cost (SWAP-C) sensors. From the beginning, all mobile phones
              contain a microphone (mic) for voice communication. Starting with flip phones and continuing with
              smartphones, cameras shortly followed, with accelerometers, gyroscopes, barometers, and other
              more esoteric sensor modalities. All operating systems (OSs) have an Application Programming
              Interface (API) to access data from internal sensors. An API is a formal definition of inputs and
              outputs for a given computational system. The API describes what fields or methods are available,
              the data and types of data that can be accepted, and the data and types of data that can be returned.
              An API provides a contract and documentation to a developer for how to interact with a given
              system. This paper concentrates on the RedVox APIs [6].
                   RedVox APIs are tailored for collecting a wide range of heterogeneous sensor data from
              distributed stations running on diverse OSs. The current version, at the time of this writing, is API
              1000 (API M), although API (version number 900) was utilized for this event. Google’s Protocol
              Buffers were used when designing API 900 and API M, allowing them to be accessed from multiple
              programming languages. The API is designed to store both device-specific metadata as well as
              diverse user-specified sensor data. Metadata includes station identification information as well as a
              summary of the station’s hardware and configuration.
                   The API accepts data from a wide range of sensor hardware. This includes sensors with stable,
              (mostly) evenly spaced sampling rates such as audio, sensors with unevenly spaced sampling rates,
              single channel sensors, and multi-channel sensors. The API includes enhanced metadata for the
              storage of location information and for the storage of timing and timing correction information.
                   Data are quantized into individual files called packets. The duration of a packet is determined
              by the requested number of audio samples stored in the packet for a given sampling rate. Packets are
              compressed for both transport and storage using the LZ4 compression algorithm. The packets are
              always stored on the device, and are also streamed to the RedVox server in the Amazon Web Services
              cloud if either cellular or wifi communications are available. Data packets collected during the Skyfall
              were transmitted over the cellular network in flight and after landing.
Preprints (www.preprints.org) | NOT PEER-REVIEWED | Posted: 8 September 2021

                   API M expands on the types of metadata stored with each packet with an emphasis on storing
              SWAP-C metrics. API M also provisions for storing real-time, edge-computed event results derived
              on stations at runtime.
                   Associated with the API is a Software Developer Kit (SDK) [7] which facilitates access to the API
              fields. The purpose of the SDK is to provide a wide range of tools to acquire, process, and analyze
              the data. The SDK functions on a variety of configurations of hardware and software, and should
              produce the consistent result when run across each of the configurations.
                   The components of the SDK critical to Skyfall are the Station and DataWindow objects. A Station
              object represents a single device, which we refer to as a Station. Each Station is capable of holding a
              variety of data from various sensors (e.g. audio, barometer, location, accelerometer, gyroscope and
              magnetometer). A DataWindow object is a grouping of Station objects with a defined start and end
              datetime, and is created by loading and processing raw API M or API 900. DataWindow is intended
              for export to more traditional geophysical data formats such as miniseed or SAC, or converted to
              other data structures for analysis by data scientists.
                   A Samsung Galaxy S10 station was deployed for the Skyfall collection, and the high-level
              specifications returned by the Android OS to the RedVox SDK are provided in Table 3.

                                                Table 3. Smartphone Station Specifications

                        Description         Field                                  Value

                        Station ID          station.id                             1637610021

                        Make                station.metadata.make                  samsung

                        Model               station.metadata.model                 SM-G973U1

                        OS                  station.metadata.os                    ANDROID

                        OS Version          station.metadata.os_version            10

                        App Version         station.metadata.app_version           2.6.20

                        SDK Version         station.metadata.os_version            3.0.0rc37

                   As of the time of this writing, the Android RedVox application is supported by >10,000 different
              Android smartphone and tablet models, not including Chrome notebooks and other devices running
              Android virtual machines.
                   For the purposes of the Skyfall event, there are three defining timescales of importance: the start
              of the clock (station start date), the start of the event, and the end of the event. Although the precision
              of these time scales are microseconds, only the corresponding epoch times in seconds are shown on
              Table 4. The station clock resets every time the app is stopped and started, and the station recording
              parameters can only be changed if the app recording is stopped. Therefore, it is possible to identify a
              station and its data collection settings during a recording session by its Station ID (Table 3) and its
              Station Start Date (Table 4).

                                                         Table 4. Station and Event Date

                      Description             Field                                     Epoch s      Human UTC

                      Station Start Date1     station.start_timestamp                   1603719281   2020-10-26 13:34:41

                      Event Start Date        station.first_data_timestamp              1603806314   2020-10-27 13:45:14

                      Event End Date          station.first_data_timestamp              1603808114   2020-10-27 14:15:14
                                                          1   Not available before v.2.6.3
Preprints (www.preprints.org) | NOT PEER-REVIEWED | Posted: 8 September 2021
2.3.1. Microphone
Since sound quality is a key competitive feature between makes and models, Original
Equipment Manufacturers (OEMs) are protective of their microphone specifications and
configurations. It is neither possible nor practical to characterize the response of the >10,000 different
models of smartphones in the market, although some traditional methods have been pursued [16,
17]. We work with the raw digital, uncalibrated output and concentrate on the signal to noise ratio
(SNR) of the observed signal. The nominal and observed sample rate of the primary internal front-
facing smartphone microphone are presented in Table 5.
Table 5. Audio Sensor
Description Field Value
Sensor Name station.audio_sensor().name I/INTERNAL MIC
Nominal Rate Hz station.audio_sample_rate_nominal_hz 8000
Sample Rate Hz station.audio_sensor().sample_rate_hz 8000.043426
Sample Interval s station.audio_sensor().sample_interval_s 0.000124999
Interval Standard
Deviation s station.audio_sensor().sample_interval_std_s 5.20E-08
2.3.2. Barometer
The specifications for the station barometer obtained through the Android framework under
RedVox API900 are listed in Table 6.
Table 6. Barometer Sensor
Description Field Value
Sensor Name station.barometer_sensor().name LPS22HH Barometer
Sample Rate Hz station.barometer_sensor().sample_rate_hz 24.40309971
Sample Interval s station.barometer_sensor().sample_interval_s 0.040978401
Interval Dev s station.barometer_sensor().sample_interval_std_s 0.006281194
The pressure range of STMicroelectronics LPS22HH [18] is 260-1260 hPa (26-126 kPa), in contrast
to the 0.8–120 kPa Bounder range. The LPS22HH accuracy is 0.05 kPa, with a low-pressure sensor
noise of 0.65 Pa. The digital output is specified as 24 bit, and its sensitivity as 4096 LSB/hPa.
It is known that height above the ellipsoid from GNSS constellations has relatively large errors,
and we can use the barometer as a secondary estimate for height. We expect the Bounder barometer
to perform much better at high elevation as it can go down to 0.8 kPa. Barometric pressure is
transitory and depends strongly on the specific time and location. Since the Bounder provides
independent measures of the height and pressure, we can construct an empirical function to compute
height from pressure for the balloon height profile. Since pressure is expected to drop as the
exponential of height, we performed a polynomial fit to the natural logarithm of scaled pressure. The
method for the polynomial fit is provided in the redvox-pandas repository as the function
bounder_model_height_from_pressure.
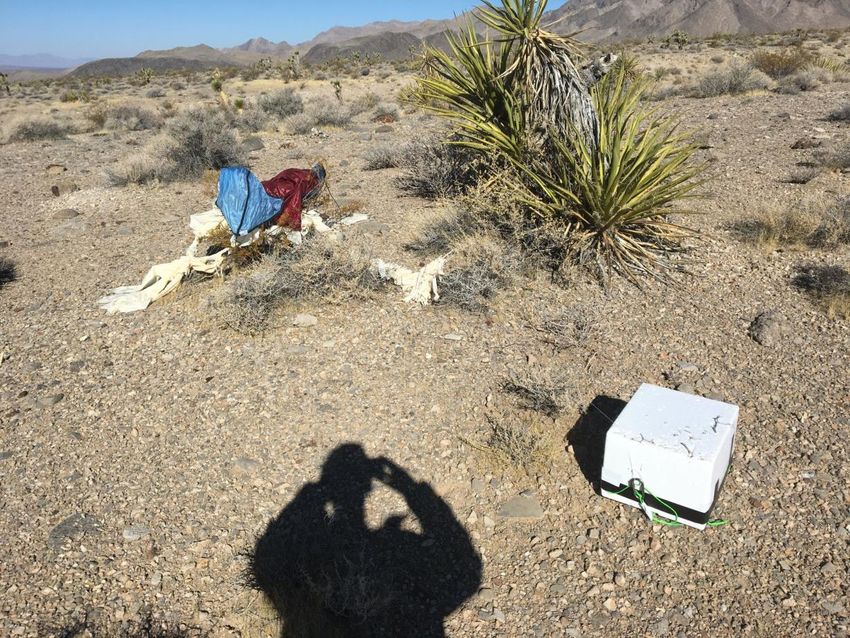
Figure 4 compares the Bounder and S10 barometer data, showing divergence above 20 km
heights. We assume the Bounder barometer will be the most accurate of the two as its low-pressure
specifications are better matched to the ~36 km heoight of this case study. Note the sample rate of the
Bounder is ~1 Hz, whereas the sample rate of the S10 barometer is ~24 Hz.
Preprints (www.preprints.org) | NOT PEER-REVIEWED | Posted: 8 September 2021

                  Figure 4. Comparison of barometer in Bounder and S10, and height above the ellipsoid from the
                  Bounder, and the S10 inferred from the Barometer and Location sensor.

              2.3.3. Accelerometer and Gyroscope
                  The Accelerometer and Gyroscope specifications obtained through the Android framework
              under RedVox API900 are listed in Tables 7 and 8.

                                                   Table 7. Accelerometer Sensor

                Description         Field                                                     Value

                                                                                              LSM6DSO
                Sensor Name         station.accelerometer_sensor().name                       Accelerometer

                Sample Rate Hz      station.accelerometer_sensor().sample_rate_hz             401.0575129

                Sample Interval s   station.accelerometer_sensor().sample_interval_s          0.002493408

                Interval Dev s      station.accelerometer_sensor().sample_interval_std_s      0.001007224

                                                    Table 8. Gyroscope Sensor

                Description         Field                                                     Value

                                                                                              LSM6DSO
                Sensor Name         station.gyroscope_sensor().name                           Gyroscope

                Sample Rate Hz      station.gyroscope_sensor().sample_rate_hz                 401.057526

                Sample Interval s   station.gyroscope_sensor().sample_interval_s              0.002493408

                Interval Dev s      station.gyroscope_sensor().sample_interval_std_s          0.000992285
Preprints (www.preprints.org) | NOT PEER-REVIEWED | Posted: 8 September 2021
The documentation sheet for the ST Microelectronics LSM6DSO [19] 3D always-on, low-power
accelerometer and gyroscope is through. This component has many possible configurations; the
specific S10 configuration parameters are not saved under API 900, and a high level of detail is not
available under the Android framework.
2.3.4. Magnetometer
The magnetometer specifications obtained through the Android framework under API900 are
listed in Table 9.
Table 9. Magnetometer Sensor
Description Field Value
AK09918
Sensor Name station.magnetometer_sensor().name Magnetometer
Sample Rate Hz station.magnetometer_sensor().sample_rate_hz 100.1370283
Sample Interval s station.magnetometer_sensor().sample_interval_s 0.009986316
Interval Dev s station.magnetometer_sensor().sample_interval_std_s 0.001235985
The specification sheet for the Asahi Kasei AK09918 3-axis Electronic Compass [20]
provides a nominal sensitivity of 0.15 microTesla/LSB and states the digital output is 16-bit per axis.
2.3.5. Station State of Health Information
The state of Health (SOH) information supported by the API 900 framework is minimal, and
consists of the station internal temperature and remaining battery percentage. This information is
useful for maintaining station uptime, as sustained temperatures below 0 C and exceeding 40 C
impact mobile device’s batteries and battery charging capabilities. The device’s battery status and
temperature information are collected once per packet, which is 32.8 seconds in API 900 at 8000 Hz
audio sample rate, corresponding to 218 points per packet. Although useful, the coarse temporal
granularity of the SOH information under API 900 is marginal for SWAP-C optimization.
API M has expanded SOH recording capabilities to include network type, network strength,
data transmission rate, temperature, cell service state, battery remaining, battery current, available
RAM, available disk, CPU utilization, power state, and WiFi wake lock, when available. Note not all
hardware and operating systems make these sensors accessible. The API M apps permits collection
of SOH data once per packet or once per second, where the packet length is also configurable.
2.4. Station Timing, Orientation, and Location
When, where, and how a recording station is deployed is captured by various sensor fields. In
the simplest scenario, the station is stationary and connected to a stable communication network. For
Skyfall, the station only stops moving after the payload hits the ground, rolls over, and is dragged by
the parachute.
2.4.1. Timing
There are various timelines available to a smartphone. When first booted a smartphone
internal clock does not know the time, and it would naturally go to the Unix epoch time zero of 1
January 1970 00:00 UTC. It will try to find time via GNSS, cell, or wifi. The operating system time (OS
time) will use any and all available combinations to update its internal clock. OS time will jump back
and forth as needed to keep up with the various clocks at its disposal. GNSS time will also jump about
depending on which satellites are available. A third timeline, the machine time, is initialized when
the unit is booted. Although the machine time is monotonic, it is only as accurate as its internal
oscillator. Accurately estimating true time is beyond the scope of this work; our aim is to get anPreprints (www.preprints.org) | NOT PEER-REVIEWED | Posted: 8 September 2021
estimate of timing errors for a given network configuration relative to a reference clock. In this case,
the reference clock is at Amazon Web Services and it is only available when there is either cellular or
wifi connectivity.
The application uses well-established tri-message exchange algorithms for synchronization and
relies on three assumptions: that the message propagation delay is nearly symmetrical, errors of the
timestamp itself have been mostly compensated, and the clocks’ skew is negligible during the
message exchange. The synchronization process starts when the reference server sends a message of
its current timestamp to the device, the device then records the time of receipt and returns the
message after a delay with its current timestamp and the server records the time of receipt. Using the
time stamps we can find the average latency to calculate the offset between the clocks, the best-fit
offset is selected by finding the best minimal statistically significant latency to compute the offset.
Timing correction is built into the RedVox SDK, and is only possible when communication is
available to either a reference synchronization clock or GNSS satellites during data collection.
2.4.2. Station Orientation
The S10 coordinate frame follows the Android and iOS smartphone-centered cartesian xyz axis,
with z positive away from the screen (Figure 5). A smartphone accelerometer laying screen up on a
flat level surface has a constant value of -9.8 m/s2 in the z axis. If the long horizontal axis (y) is pointing
towards the North, the magnetometer x axis should be zero and the z axis will be the projection of
the magnetic line on the vertical. The gyroscope will respond to rotation around the specified axis,
positive counterclockwise (right hand rule), and shown by rotation arrows in Figure 5.Preprints (www.preprints.org) | NOT PEER-REVIEWED | Posted: 8 September 2021
Figure 5. Reference frame for three component (3C) smartphone sensors.
2.4.3. Smartphone Location
As with timing, a smartphone will attempt to get its location via GNSS, cell, or wifi. Skyfall
represents an extreme high-altitude collection event, and the location framework did not perform
well above 20 km height (twice aircraft cruising altitudes) as there is a data gap. The RedVox API900
did not collect sufficient location information to disambiguate between cell, wifi, or GNSS location.
This omission is corrected under API M.Preprints (www.preprints.org) | NOT PEER-REVIEWED | Posted: 8 September 2021
Table 10. Smartphone Location Sensor
Description Field Value
Sensor Name station.location_sensor().name GNSS
Sample Rate Hz station.location_sensor().sample_rate_hz 0.709595563
Sample Interval s station.location_sensor().sample_interval_s 1.409253456
Interval Dev s station.location_sensor().sample_interval_std_s 12.22592513
However, the location data that was obtained matched the bounder location (Figure 6) within
the vertical scale of descent (km). As shown in Figure 7, synchronization via cell did not begin until
the S10 dropped below 10 km. The spike just before 800 s probably corresponds to communications
from a different cell tower. This suggests the height measurements above 8 km were from GNSS.
Figure 6. Comparison between Bounder and smartphone location.Preprints (www.preprints.org) | NOT PEER-REVIEWED | Posted: 8 September 2021
Figure 7. Timing synchronization framework showing (a) the estimated round-trip sync exchange
latency in ms, (b) the station clock offset correction from the reference clock in seconds, and (c)
location height above ground in km. There is a single latency point after 600 s that does not show in
the line graph.
3. Results
Each sensor modality provides useful and complementary information on the descent
chronology, as well as reveals the capabilities and limitations of the sensor system. This section seeks
to reconstruct the Skyfall chronology from the available Bounder and smartphone data.
3.1.1. Bounder location and estimated speed
The Bounder platform provided the most complete record of the payload position, although it
does not contain information about its orientation. The Bounder position is converted to cartesian
East North Up (ENU) XYZ coordinates in Figure 8 to show its trajectory with time relative to the end
of flight terminus. A scalar speed is computed from the derivative of the cartesian coordinates in
Figure 8, and shown in Figure 9. The speed direction follows the trajectory. The balloon was moving
briskly (~50 m/s) towards the Southeast in the upper stratosphere (above 25 km) when it began its
descent, but swerved to the Southwest in the troposphere (below 10 km). The fastest descent was
when it was released, when it hit a top speed of ~80 m/s. It slowed down as the parachute deployed
in the thin, cold stratosphere, and then it approached the troposphere where it was struck by a
shearing wind that reversed its Eastward journey. Surprisingly, it sped up again in the upper
troposphere; whether this was due to a parachute malfunction or strong winds is unclear from the
location record.Preprints (www.preprints.org) | NOT PEER-REVIEWED | Posted: 8 September 2021
Figure 8. Bounder height chronology relative to the end of the record.Preprints (www.preprints.org) | NOT PEER-REVIEWED | Posted: 8 September 2021
Figure 9. Bounder speed estimated from position.
3.1.2. Smartphone location and estimated speed
The S10 smartphone location failed to provide location data above ~20 km (Figure 10). Once the
payload was well on its descent, but only after its maximum descent speed, did the S10 begin to
record a location. Although the location and speed values are comparable to the Bounder, the S10
location data gap at height remains an unexpected surprise. As inferred from the synchronization
data, cell position was only available below ~8 km. In summary, below 20 km and up to its terminus,
the S10 location framework performed adequately (but not exceptionally) well, and was the first
sensor to report its position upon landing. Both the Bounder and the S10 show two regions of slow,
near-vertical descent, likely where horizontal winds were low and the parachute performed as
specified. The parachute reached its nominal 6 m/s descent rate in the lower troposphere before
landfall, when it mattered most.Preprints (www.preprints.org) | NOT PEER-REVIEWED | Posted: 8 September 2021
Figure 10. Range, altitude, and speed inferred from the phone location framework. It did not report
during the fastest descent, but it performed adequately below 20 km. The descent speed was in
excess of 10 m/s in the upper troposphere until it reached the lower troposphere where the
atmosphere is most dense.
3.1.3. SOH Power and Temperature
The station power and temperature were coarsely sampled at intervals of ~30s. Not surprisingly,
the internal battery was discharging during the descent. The reported internal temperature of the
station dipped below -8C before it appears to rise again after the terminus. It is likely the station
would have shut down and/or drained power rapidly had such low temperatures persisted.
Additional SOH parameters at finer sample intervals will be collected under API M.
Figure 11. Power status during Skyfall descent showing (a) pressure during fall, (b) temperature,
and (c) remaining battery percentage.
3.1.4. Acoustic pressure, barometric pressure, and vertical accelerationPreprints (www.preprints.org) | NOT PEER-REVIEWED | Posted: 8 September 2021
The microphone, barometer, and vertical accelerometer sensors provide useful insight into
Skyfall. These three channels are often complementary during ground-based measurements and are
thus presented together. The audio channel, raw vertical acceleration, and height inferred from the
barometer data are presented in Figure 12. There is not much audio signal during the release, but
flow noise does increase during descent. The payload hits the tropopause (~10 km) halfway through
the record (~900 s), and the ground impact is evident at ~1700 s. Figure 12 suggests that the S10 was
laid down screen down, with gravity pointing up before release (+9.8 m/s). The release was a
turbulent event with some tumbling, as suggested by the oscillations in the vertical acceleration. At
the terminus, the payload enclosure flipped over, reversing the sign of gravity (-9.8 m/s). The
microphone (mic) channel also clearly shows the impact.
Figure 12. Sensor payloads for (a) audio, (b) z-component acceleration, and (c) height inferred from
barometric pressure.
High-pass filtering the signal above 100 Hz (Figure 13) enhances the fine-scale
variability in the barometer and vertical acceleration sensors, in particular for the
barometric pressure. The sudden stop at the end (with a deceleration >6G) produced an
overpressure of ~400 Pa in the barometer and, unsurprisingly, clipped the microphone.Preprints (www.preprints.org) | NOT PEER-REVIEWED | Posted: 8 September 2021
Figure 13. Sensor payloads for (a) audio, (b) high-pass filtered z-component of acceleration, and (c)
high-pass filtered barometric pressure.
3.1.4. Three-component sensors: Accelerometer, Gyroscope, and Magnetometer
The three-component (3C) sensors provide insight into changes in the orientation of the payload.
Accelerometers are included in almost all smartphones to detect when the device is picked up, and
for gaming apps. Gyroscopes are often bundled in with accelerometers to correct for a smartphone’s
rotational orientation relative to gravity (e.g. screen orientation), and magnetometers are used for
navigation. All the 3C channels are sampled unevenly, and show three clear stages of descent: the
release of the payload with a freefall in the low-density stratosphere, the transition to the denser
atmosphere in the tropopause at ~900 s, and the impact with the ground. The accelerometer suggests
the phone was deployed screen down, and remained so through most of the turbulent descent. The
horizontal (X-Y) channels show high accelerations during the stratospheric descent, and stabilized
penetrating into the troposphere.Preprints (www.preprints.org) | NOT PEER-REVIEWED | Posted: 8 September 2021
Figure 14. Acceleration channel payload for (a) z-direction component, (b) y-direction component,
and (c) x-direction component.
All three gyroscope channels in Figure 15 indicate a stable payload while tethered to the balloon
with the initiation of rapid rotation after release. The gyration about the horizontal X and Y axes
(panels (c) and (b) in the figure, respectively) along the base of the payload box are dominated by
fluctuations about 0 rad/s during the descent, while the Z channel (panel (a)) appears to show
continuous and rapid rotation of the device about the Z axis from approximately 300 to 900 seconds
into the descent through the stratosphere. The maximum rotation rate is 13.43 radians/second (2.14
rotations/s). After the 900 second mark, after entry into the troposphere, the readings drop and
fluctuate about 0 rad/s. All channels spike at ground impact.
Figure 15. Gyroscope channel payload for (a) z-axis component, (b) y-axis component, and (c) x-axis
component. The maximum rotation rate is 2.14 rotations/s (~2.14 Hz) about the z axis.Preprints (www.preprints.org) | NOT PEER-REVIEWED | Posted: 8 September 2021
Data collected by the magnetometer along the three axes of the device are shown in Figure 16.
A slow rotation about the z axis is evident while tethered to the balloon, while the magnetic line
component along the z axis is stable. In the X and Y directions (shown in panels (b) and (c),
respectively), readings oscillate about 0 µT during descent. For both the X and Y channels, the
frequency is markedly higher from about 350 to 950 seconds into the descent. The amplitudes,
however, are similar throughout the descent for both the X and Y channels. The data in the Z direction
are shown in panel (a). Unlike those of the other channels, the readings in the Z direction do not
oscillate about 0 µT, but instead remain near -5 µT after the initial moments of the descent, indicating
that the compass direction of the Z axis remained relatively steady during the rapid descent, flipping
only upon impact as inferred from the vertical accelerometer channel.
Figure 16. Magnetometer channel payload for (a) z-direction component, (b) y-direction component,
and (c) x-direction component.
High-passed filtered channels are shown in Figure 17, with their corresponding estimated short-
term Fourier transforms in Figure 18. The waveform plot amplitudes are normalized relative to the
maximum values. The three main stages of the Skyfall are clear in all channels: initiation, transition
to troposphere, ground impact. Throughout the flight and descent, the payload is in a flat spin along
the vertical axis, with different rates of rotation at different stages; slow before descent, frantic (>10
rad/s) in the stratosphere, slowing down in the thermosphere. The tonal structure in the spectra in
the rotation-sensitive channels (Figure 18) is a measure of the flat spin rotation frequency, and there
is no evidence for tumbling. The payload flips over only after impact.Preprints (www.preprints.org) | NOT PEER-REVIEWED | Posted: 8 September 2021
Figure 17. High pass filtered (hp) waveforms for sensors: audio, barometer (Bar), accelerometer (Acc),
gyroscope (Gyr) and magnetometer (Mag). The vertical axes are normalized to the peak absolute
magnitude of each channel.
Figure 18. Short-term Fourier Transforms of high pass filtered (hp) waveforms for sensors: audio,
barometer (Bar), accelerometer (Acc), gyroscope (Gyr) and magnetometer (Mag). The color scales to
the maximum amplitude. The vertical axes represent logarithmic frequency in Hertz to the sensor
Nyquist. The standardized minimum frequency scales with the record duration and the sample rate
[21].
The gyroscope spectra reinforce the time-domain representation, as expected. More
interestingly, the X and Y components of the magnetometer spectrograms confirm the ~2 Hz
maximum revolution rate of the payload in the stratosphere. The magnetometer was sampled at ~100
Hz, with a Nyquist frequency at 50 Hz. The base-2 logarithm (bits)[21] of the spectral magnitude of
the X component of the magnetometer is shown in Figure 19. As expected, the peak spectralPreprints (www.preprints.org) | NOT PEER-REVIEWED | Posted: 8 September 2021
magnitude envelope matches the vertical component of the gyroscope in Figure 15, with a peak
revolution rate of ~ 2 Hz.
Figure 19. Short-term Fourier Transforms of high pass filtered (hp) waveforms for the X component
of the magnetometer (Mag); the Y component is nearly identical.
Raw data and python code are provided to reconstruct the results in this paper, as well as
produce additional results not presented herein. The reader is welcome to explore these openly-
available data and software to search within the various intriguing spectral patterns within each
channel.
4. Discussion and Conclusion
We described some of the internal smartphone sensor components and configurations that are
accessible through the Android OS and the RedVox API for a Samsung Galaxy S10. The first-of-kind
smartphone deployment in a high-altitude balloon and parachute to the ground provided useful and
verifyable data [1]. This is the first scientific study of such an extreme phone data collection and drop
test, and presents smartphones as viable sources of geophysical data.
The Bounder and S10 data study present a cohesive narrative. At the beginning of the record,
the balloon is ascending through the stratosphere with the payload slowly spinning about its vertical
axis. The Skyfall event begins with the dropping of the payload and substantial movement and
rotation along all axes. The fastest descent occurred during the initial freefall. The first stage of the
Skyfall event is the fall through the thin stratosphere, where the parachute has little to work with.
The second stage corresponds to penetration into the troposphere and a reduction in rotational
motion of the payload enclosure. The Skyfall terminates with impact on the ground, as shown by
high amplitudes on all channels. The final minutes of the record show the payload enclosure flipped
upside down and remains static and awaiting recovery.
There is an abundance of fine structure within the records and their spectra that can be explored
by the interested researcher, as all data and software are openly available. Ongoing and future [5]
research will use these frameworks and methods to study signals of interest on Earth and beyond.
Supplementary Materials: The following are available online at www.mdpi.com/xxx/s1, Figure S1: title, Table
S1: title, Video S1: title. The raw data are openly available at http://redvox.io/@/3f3f, the RedVox SDK is at
https://pypi.org/project/redvox/, and the Python software used to process the data and construct the figures is
at https://pypi.org/project/redvox-pandas/.Preprints (www.preprints.org) | NOT PEER-REVIEWED | Posted: 8 September 2021
Author Contributions: Conceptualization, M. Garces, D. Bowman, C. Zeiler; methodology, software, A. Christe,
T. Yoshiyama, M. Colet; validation and analysis, B. Williams, M. Colet, S. Takazawa, S. Popenhagen, Y.
Hatanaka, J. Tobin; resources, D. Bowman, C. Zeiler, K. McLin; data curation, T. Yoshiyama, M. Colet; writing—
original draft preparation, M. Garces; writing—review and editing, all authors; supervision, M. Garces. All
authors have read and agreed to the published version of the manuscript.
Funding: This paper was supported by the Department of Energy National Nuclear Security Administration
under Award Numbers DE-NA0003920 (MTV) and DE-NA0003921 (ETI).
Disclaimer: This report was prepared as an account of work sponsored by agencies of the United States
Government. Neither the United States Government nor any agency thereof, nor any of their employees, makes
any warranty, express or implied, or assumes any legal liability or responsibility for the accuracy, completeness,
or usefulness of any information, apparatus, product, or process disclosed, or represents that its use would not
infringe privately owned rights. Reference herein to any specific commercial product, process, or service by
trade name, trademark, manufacturer, or otherwise does not necessarily constitute or imply its endorsement,
recommendation, or favoring by the United States Government or any agency thereof. The views and opinions
of authors expressed herein do not necessarily state or reflect those of the United States Government or any
agency thereof. The United States Government is authorized to reproduce and distribute reprints for
Governmental purposes notwithstanding any copyright notation thereon.
Acknowledgments: The author is grateful for anonymous reviewers who helped improve the manuscript.
Conflicts of Interest: The author declares no conflict of interest. The funders had no role in the design of the
study; in the collection, analyses, or interpretation of data; in the writing of the manuscript, or in the decision to
publish the results.
References
1. Popenhagen, S., Garcés, M. A., Bowman, D., Zeiler C. Analysis of explosion data collected on an airborne
platform, NNSA University Program Review (UPR), 8-10 September 2021, Atlanta, GA.
2. RedVox for Android on the Google Play Store. Available online:
https://play.google.com/store/apps/details?id=io.redvox.InfraSoundRecorder&hl=en
3. RedVox for iOS and M1 chip on Apple App store. Available online:
https://apps.apple.com/sz/app/redvox-recorder/id969566810
4. Balloon Ascent Technologies HAB Bounder Balloon Cut-Down Device. Available online:
https://loonatec.com/blog/wp-content/uploads/2020/09/HAB_Bounder_User_Guide_rev5.pdf
5. Takazawa, S., M. A. Garcés, L. O. Giraldo, J. Hix, S. Watson, D. Chichester, C. Zeiler (2021). Explosion Data
Fusion of Acoustic, Barometric, and Accelometric Data Collected on Smartphones, University Program
Review (UPR), 8-10 September 2021, Atlanta, GA.
6. RedVox Application Programming Interface (API). Available online:
https://github.com/RedVoxInc/redvox-api-1000
7. RedVox Software Developer Kit (SDK). https://github.com/RedVoxInc/redvox-python-sdk
8. RedVox-Pandas Framework. Available online: https://github.com/RedVoxInc/redpandas,
9. McKinney W, others. Data structures for statistical computing in python. In: Proceedings of the 9th Python
in Science Conference. 2010. p. 51–6. Available Online: https://pypi.org/project/pandas/
10. Raw Skyfall data available from the collection of event reports at RedVox.io Analysis/Featured Events.
Available online at: http://redvox.io/@/3f3f
11. Totex Corporation Meteorological Balloon. Available online: https://totex.info/hinmoku_kikyu_e.html
12. Rocketman Parachutes. Available online: https://the-rocketman.com/
13. High Altitude Science StratoTrack APRS. Available online:
https://www.highaltitudescience.com/products/stratotrack-aprs-transmitter
14. Globalstar SPOT Trace. Available online:
https://www.globalstar.com/en-us/products/spot-for-business/spot-trace
15. Samsung Galaxy S10 specifications, https://www.samsung.com/global/galaxy/galaxy-s10/specs/
16. Asmar, K., Garcés, M. A., Williams B. A method for estimating the amplitude response of smartphone built-
in microphone sensors below 4 kHz. J. Acoust. Soc. Am. 2019, 146 (1).Preprints (www.preprints.org) | NOT PEER-REVIEWED | Posted: 8 September 2021
17. Asmar, K., Hart, D., Garcés, M. A., Williams, B. Digital acoustic sensor performance across the infrasound
range in simulated field conditions. J. Acoust. Soc. Am., 2018, 144 (5),
https://asa.scitation.org/doi/10.1121/1.5078591
18. ST Microelectronics LPS22HH Barometer specifications,
https://www.st.com/resource/en/datasheet/lps22hh.pdf
19. ST Microelectronics LSM6DSO Accelerometer and Gyroscope specifications,
https://www.st.com/resource/en/datasheet/lsm6dso.pdf
20. Asahi Kasei Microdevices (AKM) AK09918 3-axis Electronic Compass specifications,
https://www.akm.com/content/dam/documents/products/electronic-compass/ak09918c/ak09918c-en-
datasheet.pdf
21. Garcés, M. A. Quantized constant-Q Gabor atoms for sparse binary representations of cyber-physical
signatures, Entropy, 2020, 22, 936; doi:10.3390/e22090936You can also read