Spatial Propagation of COVID-19 in the Democratic Republic of Congo
←
→
Page content transcription
If your browser does not render page correctly, please read the page content below
Special Feature: COVID-19 and Africa

 Spatial Propagation of COVID-19 in the
Article

 Democratic Republic of Congo
 コンゴ民主共和国における新型コロナウイルスの空間的拡散

 Otchia Christian Samen

 Abstract(要約)
 :
 We combine spatial econometrics with district-level data to assess the spatial spread of COVID-19
in the Democratic Republic of Congo. We find that Kinshasa was the initial hot spot for the outbreak,
subsequently spreading to its neighboring districts. Other hot spots emerged in large districts at the
borders, such as the Haut-Katanga and Sud-Kivu. Our findings show that districts with a high
prevalence of Ebola, Cholera, and other endemic diseases are predicted to have more confirmed cases
of COVID-19. We find strong evidence that districts with a high prevalence of conflicts are more
susceptive to COVID-19. Our findings also show that meteorological factors such as temperature,
physical elevation, and wind speed have played an important role in containing the spread. Taken
together, our findings suggest that DRC could have better survived the spread of COVID-19 if it had
used the experiences accumulated in the struggle against previous pandemics.
 本論文では、地区レベルのデータを利用して空間計量経済分析を行い、コンゴ民主共和国
における新型コロナウイルスの感染拡大の状況を検討した。その結果、キンシャサから始ま
った感染拡大が近隣の地区に波及したこと、また、上カタンガ州や南キヴ州といった国境に
接する州も感染拡大の中心地であったことが明らかになった。さらに、エボラ出血熱やコレ
ラ、その他の感染症の感染者が多い地区や、紛争が多発する地区では新型コロナウイルスの
感染者が多いことが分かった。気温、標高、風速などの気候条件も感染と関連していた。こ
れらの結果から、過去の感染爆発の経験を活かすことができていれば、コンゴ民主共和国は
新型コロナウイルスの流行を現状よりも抑えることができたと思われる。
 (訳:福西隆弘)
弘)。
Keywords:COVID-19 Ebola Cholera Conflict Spatial econometrics

 アフリカレポート(Africa Report)2021 No.59 pp.49-64

 Ⓒ IDE-JETRO 2021
Spatial Propagation of COVID-19 in the Democratic Republic of Congo

 1. Introduction

 The global confirmed cases of COVID-19 have passed 54 million and continues to grow rapidly1. In Africa,
the incidence of confirmed cases and deaths remains lower than in the rest of the world. As of October 1,
2020, 32 African countries have still not reached 10,000 cases, and the total amount of deaths in the continent
remained at less than 50,000. Africa has also done well with daily recoveries, which averaged 79% against
65% in the United States. However, it is worth noting that the cases are rising rapidly with large variations
across and within countries. There are many reasons for these new waves, but two stand out. On the one hand,
economic needs and political pressure have led governments to loosen movement restrictions across and
within borders. On the other hand, people are getting lax on precautions after spending more than nine months
under the pandemic. While considerable attention has been paid to the impacts of COVID-19, socioeconomic
factors influencing the spatial spread of COVID-19 are much less well understood. It is now a fact that only
by addressing the spread of the virus will we tackle the economic and political problems.
 We examine the relationship between socioeconomic factors, spatial effects, and the spread of COVID-19
using the Democratic Republic of Congo (DRC) as a case study. This is an important case for several reasons.
Most importantly, COVID-19 hit the DRC when the country was already overburdened by Cholera, measles,
Ebola, and other endemic diseases such as malaria. Ongoing civil conflicts and security issues also hit the
country. An important fear is a mass displacement of the population fleeing conflicts, which may hinder
efforts to contain the spread of those diseases. The pandemic and civil war both have a definite impact on
communities’ productivity, exposing them to food insecurity and malnutrition challenges. Finally, the reliance
of the DRC on commodity exports may reduce its capability to respond to the crisis. Macroeconomic
responses have led to high inflation, further putting pressure on households and firms (INS 2020). Despite
this background, there has been surprisingly little empirical guidance on how the DRC can survive with these
threads.
 We address three specific questions. First, does the presence of COVID-19 cases in one district make the
prevalence of the COVID-19 cases in neighboring districts more or less likely? Second, do high health risk
measures correspond to more COVID-19 confirmed cases? And third, what other variables might be
correlated with COVID-19 confirmed counts? To answer these questions, we begin by building a novel
dataset that includes district-level 2 information of COVID-19 confirmed cases from April 6, 2020, to
October 7, 2020, and conduct an exploratory spatial analysis. We find strong spatial spillovers, which are
also increasing over time. Our results indicate three main hot spots located in the neighborhoods of Kinshasa,
Haut-Katanga, and Sud Kivu. We then explore the potential of combining spatial dependencies and
socioeconomic factors to assess the spatial spread of COVID-19 cases. Our findings confirm the importance
of modeling spatial factors in evaluating the transmission of the pandemic. We also find that residents of

 1 As of October 1, 2020. Source: Johns Hopkins Coronavirus Resource Center
 2 Specifically, we use second-level administrative boundaries, which include territories and cities.

 50 アフリカレポート 2021 年 No.59
Spatial Propagation of COVID-19 in the Democratic Republic of Congo

districts with health risk factors and conflicts are more susceptible to have high COVID-19 infection rates.
Sadly, our results point to the fact that the experiences accumulated in the struggle against previous
pandemics have not been used to contain the current COVID-19 outbreak. We also find that meteorological
factors such as temperature, physical elevation, and wind speed have played an important role in containing
the spread.
 Our paper is related to fast-growing literature on COVID-19, for which we provide a (very) incomplete
summary to emphasize our relative contribution. Our study builds on a growing body of work examining the
spatial geographic aspect of COVID-19 (Bailey et al. 2020; Coven and Gupta 2020; Guliyev 2020; Kang et
al. 2020; Kuchler, Russel and Stroebel 2020; Mollalo, Vahedi and Rivera 2020). Our paper also contributes
to extensive literature on COVID-19. While it is difficult to summarize this literature as the number of papers
continues to grow, a recent summary can be found in Brodeur et al. (2020) and van Barneveld et al. (2020).
 The remainder of the paper is as follows. Section 2 presents background information on COVID-19 and
other diseases in the DRC. Section 3 presents the methodology and data. In section 4, we present the results,
and section 5 concludes.

 2. Background

 The DRC is prone to epidemics. Recently, the country has faced an unprecedented health crisis, with
several epidemic outbreaks co-occurring. More than 288,000 people contracted measles in 2019, with 5,700
deaths. There are over 2,000 reported cases of Ebola and a high prevalence of malaria, with over 7.6 million
reported cases, including 7,652 reported deaths. Besides, as a post-conflict country, the DRC continues to
face security problems. Armed conflicts still exist in the eastern part of the country and are increasingly
concentrated in North Kivu and Ituri provinces. These conflicts continue with periods of varying intensity.
This is a big challenge for the country, given its fragility and the deficiency of medical infrastructure,
equipment, and personnel.
 The DRC has been widely described as a failed state, unable to meet its citizens’ basic needs. In addition
to affecting the ability to provide public services, state failure has led to a deeply hybrid form of governance
where central state rule has become secondary to localized arrangements (De Herdt and Titeca 2019; Pearson
2011; Seay 2013; Devisch 1998). In many DRC provinces, the non-state provision of public health services
has been the cornerstone behind the “survival” of the health sector (Seay 2013). The main actors behind these
provisions are faith-based organizations, with support from international NGOs and donors. While the
localized arrangement can be efficient when the number of actors is small, the lack of coordination and
control of joint action and the conflict of interests pose a severe challenge to the provision of the health
system in the DRC. This might explain why the DRC has been unable to eradicate many types of epidemics
on its soil.
 In the DRC, the first COVID-19 case was confirmed in Kinshasa on March 10, 2020. It was an imported
case from abroad. The first case of local transmission was reported on March 17, 2020. As of March 20, 2020,

 51 アフリカレポート 2021 年 No.59
Spatial Propagation of COVID-19 in the Democratic Republic of Congo

the country had 23 confirmed cases of COVID-19 in Kinshasa, including one death. Of these cases, 15 were
imported from other countries, and eight were local transmissions. As shown in Table 1, the DRC government
took timely measures to control the spread of COVID-19. The measures consisted mainly of closing the
borders, suspending major shopping centers, bars, churches, and schools. In addition to these two initiatives,
government officials at the national and provincial levels have taken measures of isolation and containment.
For instance, Kinshasa has been completely locked down from the rest of the provinces. Inside Kinshasa, the
area of Gombe (business district) was also locked down. Over time, these measures were gradually replaced
to keep hand washing, masks, and social distance. Testing was specifically required for travelers.

 Table 1: COVID-19 response timeline in 2020
 Date Events
 March 18 Bars, restaurants, and non-food businesses closure
 March 18 Gatherings of more than 20 people banned
 March 19 External border restrictions (High risk countries)
 March 29 National state of health emergency declared
 April 6 Curfew (Gombe)
 April 17 Schools and universities closure
 April 22 Curfew (Gombe) ends
 May 20 Curfew (Kinshasa)
 June 10 Demission de Mukwege
 July 22 Shops, banks, restaurants, bars, and public transport were reopened
 August 3 Schools and universities reopening
 August 15 DRC closes bars, restaurants, and non-food businesses reopen
 August 15 External border restrictions were lifted
 Source: Author’s construction

 Lockdown measures were not observed unequivocally, as many households depend on daily work from
the informal sectors. Also, several (non-authorized) demonstrations were organized in Kinshasa in July to
protest the appointment of the head of the Electoral Commission. Public servants involved in the COVID-19
taskforce also went on strike to demand their unpaid wages and protest their hard working conditions. Perhaps
the most significant event was the resignation of the 2018 Nobel peace laureate Doctor Denis Mukwege from
the COVID-19 taskforce in Sud Kivu and Ituri. Doctor Mukwege pointed out the lack of testing equipment,
a slackening of preventive measures, the impossibility of enforcing barrier measures, and the porosity of
borders with the massive return of thousands of Congolese from neighboring countries without having been
quarantined.
 In addition to measures to control the spread of COVID-19, the government took additional steps to support
the economy. In particular, the government designed a multisectoral emergency program evaluated at US$ 2.3

 52 アフリカレポート 2021 年 No.59
Spatial Propagation of COVID-19 in the Democratic Republic of Congo

billion (DRC 2020). The plan was based on three pillars: (i) response to Covid-19, surveillance and
strengthening of the health system, (ii) support for macroeconomic stability and recovery, and (iii) risk
mitigation and support to the population. Additional support measures directly to households through the
provision of free water and electricity services were also executed. Furthermore, the central bank of the DRC
created a special refinancing window to support sectors affected by the pandemic. However, all these
measures, combined with the growing uncertainties resulting from the exponential increase in contagion,
have not mitigated the macroeconomic impact of COVID-19, particularly on growth, inflation, and
unemployment (INS 2020).

 3. Methodology and Data

(1)Methodology
 Given our interest in the extent to which the presence of COVID-19 cases in one district makes the
prevalence of the COVID-19 cases in neighboring districts more or less likely, a natural empirical approach
is to examine the spatial autocorrelation. We thus begin by calculating the global Moran’s I index for global
spatial correlation (Anselin 1995) as follows:

 = (1)

 − ( )
 ( ) = (2)
 √ ( )
 where is an N-vector of standardized COVID-19 confirmed cases in the districts, is an N N row-
standardized spatial weight matrix (SWM), N is the number of districts, ( ) is the standardization of
Moran’s I, with ( ) the expected value of I and ( ) the variance of I under the spatial randomization.
 ( ) and ( ) are computed as:
 −1
 ( ) = (3)
 −1
 ( ) = ( 2 ) − ( )2 (4)

 The global Moran’s I is within a range of -1 to 1. A negative value indicates a negative spatial correlation,
meaning that districts neighboring a region with high COVID-19 cases show low confirmed cases. A positive
value is a sign of a positive correlation in the data. This implies that provinces neighboring a region with high
COVID-19 confirmed cases also show high COVID-19 confirmed cases. A value of 0 means that COVID-
19 cases are randomly distributed in space as there is no spatial correlation. Finally, the larger the absolute
value is, the stronger the spatial correlation.
 In a second step, we estimate a spatial autoregressive (SAR) model to explain the spatial spread of COVID-
19 confirmed cases using cross-sectional data. In particular, we model the recent confirmed cases for district

 53 アフリカレポート 2021 年 No.59
Spatial Propagation of COVID-19 in the Democratic Republic of Congo

 in October 2020, ( , ), as a function of lagged cases (July 2020 ( , −3) or May 2020 ( , −5)) and other
predetermined independent variables. We also make use of both a spatial lag of the dependent variable,
specified by the spatial contiguity matrix , as well as a spatially lagged error term utilizing the same spatial
matrix . The spatial weight matrix is derived using rook contiguity. As such, districts are considered first-
order neighbors if they share a common border of non-zero length. For other explanatory variables, the
empirical literature on COVID-19, from which the potential explanatory variables could be selected, is too
vast and new to review. The rationale for choosing variables is motivated by our research objectives and the
brief discussion in the background. In what follows, we consider a broad range of regressors grouped into
four categories: meteorological, health risk factors, conflicts, and other socioeconomic factors. We discuss
the variables in the next section.

(2)Data
 We have assembled district data on COVID-19 and related variables from several sources. In the DRC, the
Multisectoral COVID-19 Response Committee under the Health Ministry maintains a daily database of
COVID-19 containing information on the number of infections, death, and recovery. For this study, we use
COVID-19 confirmed cases data aggregated bi-weekly from April 6, 2020, to October 7, 2020. In particular,
we focus on the number of confirmed infected cases, as the death cases are very small for econometric
analysis. Table 2 shows descriptive statistics. While the first COVID-19 case was confirmed in the DRC on
March 10, 2020, the number of confirmed cases increased to 168 by April 6. On June 6, the number of
reported cases accumulated to 6323 and crossed 8107 on September 19.

 Table 2: Confirmed COVID-19 cases (N=190)
 Variable Min p25 p50 p75 p99 Mean max Date
 , 0 1 6 157 983 169 8188 7-Oct
 , −1 0 1 6 149 899 157 8107 19-Sep
 , −2 0 0 5 76 404 116 7679 4-Aug
 , −3 0 0 2 17 325 76 6323 1-Jul
 , −4 0 0 0 2 212 40 3625 6-Jun
 , −5 0 0 0 2 10 4 675 4-May
 , −6 0 0 0 0 5 1 168 6-Apr
 Source: Author’s construction using data from the DRC Multisectoral COVID-19 Response Committee

 54 アフリカレポート 2021 年 No.59
Spatial Propagation of COVID-19 in the Democratic Republic of Congo

 Table 3: Descriptive statistics (N=190)
 Variable Unit Source Observations Period Mean Std. Dev. Min Max
 Digital
GDP (gridded) number aiddata.org 190 2019 0.19 0.49 0.00 1.61
 values
 Digital
Nightlights
 number aiddata.org 190 2018 0.89 1.24 0.35 5.21
(mean)
 values
Temperature Degree aiddata.org 190 2017 18.63 3.19 13.08 21.50
 Micrograms
PM2.5 per cubic aiddata.org 190 2013 17.37 3.91 9.74 30.27
 meter
Physical
 Meters aiddata.org 190 2019 683.31 312.70 205.95 1242.73
elevation
Wind Speed at
 Meters per
50 meters of aiddata.org 190 2019 2.28 0.45 1.58 3.26
 second
altitude
Hospitalization
 % INS 190 2019 1.75 1.04 0.5 4.3
rate
Ebola Cases INS 190 2019 181.54 657.34 0 2921
Cholera Cases INS 190 2019 2635.48 4189.46 0 15050
Tuberculosis Cases INS 190 2019 4725.90 2663.06 1047 21212
Malaria Cases INS 190 2019 461167.30 271224.10 65259 1323229
Meningitis Cases INS 190 2019 430.09 362.14 61 1705
Plague Cases INS 190 2019 0.85 3.83 0 18
Acute Flaccid
 Cases INS 190 2019 84.03 131.79 16 791
Paralysis (AFP)
Monkeypox Cases INS 190 2019 96.64 192.78 0 786
 2019-
Battles Cases ACLED 190 32.94 82.91 0 349
 2020
 2019-
Protests Cases ACLED 190 11.54 18.82 0 68
 2020
 2019-
Riots Cases ACLED 190 8.89 14.78 0 54
 2020
Violence
 2019-
against Cases ACLED 190 6.68 13.53 0 49
 2020
civilians
Wageworker Cases INS 190 2019 11.54 7.17 2.6 35.7
Moonlighting Cases INS 190 2019 8.75 4.04 0 24.2
Provincial
 Count INS 190 2019 63.84 52.71 6 190
parks
Population
 % INS 190 2019 4.85 1.01 2.40 6.55
(50 and older)
National roads Km INS 190 2019 869.84 294.73 252 1370

 Note: This table presents descriptive statistics based on 190 districts. The original shapefiles of the DRC
contain 240 districts and territories with 190 unique entities and 50 duplicates. The duplicates are entities that
are both cities and districts at the same time. Examples include Matadi, Kananga, Goma, among others.

 55 アフリカレポート 2021 年 No.59
Spatial Propagation of COVID-19 in the Democratic Republic of Congo

 We first use the districts’ and territories’ administrative boundaries from the Humanitarian Data Exchange
(HDX). The data includes the shapefiles of 240 cities and territories, but 50 shapefiles are duplicates of cities.
For this study, we remove the 50 duplicates and use 190 unique districts and territories. The regressors are
measured in various years, but all are predetermined and dated before March 2020. The National Institute of
Statistics (INS) of DRC combines several data to produce non-frequent yearbook statistics. The yearbook
also includes information on demographics and other characteristics such as national roads, moonlighters,
wageworkers, and hospitalization rates 3 . We obtained data on nightlight intensity 4 , gridded GDP 5 , and
meteorological data from aiddata.org. We particularly include temperature, PM2.56, physical elevation7, and
wind speed8. We use conflict data from the Armed Conflict Location & Event Data (ACLED) Project. Table
3 provides variable names, together with their descriptions and descriptive statistics. In the empirical analysis,
all the variables are transformed using the inverse hyperbolic sine function to deal will many zero-valued
observations.

 4. Result

(1)Case distribution
 Figure 1 panel A illustrates the district level geographical distribution of the cumulated confirmed Cases
of COVID-19 on October 7, 2020. The distribution of confirmed cases is markedly concentrated in the
regions near the borders and surrounded by districts with higher than average levels of confirmed cases of
COVID-19. Most of the regions in the center have zero or a very small number of infected cases. Kinshasa,
the capital city, is a definite outlier as it represents about 75% of COVID-19 counts. Kinshasa has the status
of city and province. For better comparison, we present the aggregated COVID-19 case counts at the province
level in the panel B of Figure 1. The results reveal that Kongo-Central, Haut-Katanga, and Sud-Kivu have a
high concentration of confirmed cases. Since the beginning of the COVID-19 spread, Kinshasa has been a
hot spot and influenced the spread of COVID-19 in Kongo-Central first. However, a few regions in the Sud
Kivu also revealed high cases in early April. A few districts of Lualaba, Ituri, and Nord-Kivu, become hot
spots in July, and we see the progress of clusters of high confirmed cases among neighboring districts.
Regarding regions at the center, Figure 1 reveals that they are less hit by COVID-19, mainly due to their
remoteness. We see regions such as Kwilu and Kasai have high cases because of their proximity and
economic relation with Kinshasa. This indicates that the clustering of lower contamination of COVID-19
among neighboring districts is not random. In the next section, we identify the drivers behind.

3 Hospitalization rates measure the 25-54-year-old hospitalization for curative diseases.
4 Nightlight intensity data go from 0 to 63, with higher values implying more intense nightlights.
5 The GDP data is created from nighttime lights and LandScan population grid to map both formal and informal economic
 activities.
6 Also known as Particular Matter, PM2.5 describes fine inhalable particles, with diameters 2.5 micrometers and smaller.
7 Global elevation (in meters) of districts at the height above sea level.
8 Wind speed potential at 50m height.

 56 アフリカレポート 2021 年 No.59
Spatial Propagation of COVID-19 in the Democratic Republic of Congo

 Figure 1: Confirmed cases of COVID-19 in the DRC (as of October 7, 2020)

 Source: Author’s computation using data from the DRC Multisectoral COVID-19 Response Committee

 Because districts had their first cases at different times, we normalized each district’s case by isolating
when each district had its first case to establish a baseline and calculate the average growth rate. Table 4,
which presents aggregated results at province level for easy exposure, shows a broad spread across the DRC,
with a particularly high concentration of confirmed cases in the West, South-East, and East. The findings
show that high-confirmed cases can be seen in Kinshasa and other provinces located at the frontier with a
high connection with neighboring countries. Lower confirmed cases are predominately in the center of the
country. It should be noted that by the end of September, five districts had no confirmed cases.
 Another important finding is that districts with high cases have neighbors with similar characteristics,
suggesting a positive spatial autocorrelation in district cases of COVID-19. This is confirmed by the months’
variations when each district had its first case (Table 4). Kongo-Central had its first case one month after
Kinshasa. Provinces with lower confirmed cases like the Kasai, Kasai-Central, and Kasai Oriental, had their
first cases in August or September. A sharp increase was observed in Kasai-Oriental and Nord-Ubangi, mainly
because of late contamination. The compound monthly growth rate shows that the number of cases increased
by 200% in Kasai-Oriental and 474.46% in Nord-Ubangi. The second group of provinces observed high
growth rates (more than 100%) despite discovering the first cases earlier in May. This includes Tshopo,
Kongo-Central, Nord-Kivu, Ituri, Sud-Kivu, and Haut-Katanga. Other provinces such as Equateur, Haut-
Uele, Kasai-Oriental, Kinshasa, and Lualaba have realized growth rates between 50% and 100%. The last
group realized lower rates despite starting earlier. This group includes Kwilu, Sud-Ubangi, Kwango, and
Haut-Lomami.

 57 アフリカレポート 2021 年 No.59
Spatial Propagation of COVID-19 in the Democratic Republic of Congo

 Table 4: Distribution of cases
 Population
 Months since the
 Initial confirmed adjusted number of Compound
 Provinces first case to
 cases confirmed cases in growth rate
 October
 October
 Bas-Uele 0.00 0.00 0.00 0
 Equateur 0.61 9.22 96.80 5
 Haut-Katanga 2.52 84.32 101.72 6
 Haut-Lomami 0.39 0.39 0.00 5
 Haut-Uele 5.73 44.77 98.47 4
 Ituri 0.47 37.02 106.92 7
 Kasai 0.31 0.31 0.00 3
 Kasai-Central 0.34 1.01 73.21 3
 Kasai-Oriental 0.18 0.55 200.00 2
 Kinshasa 13.29 647.71 91.12 7
 Kongo-Central 1.08 92.91 143.91 6
 Kwango 0.50 0.50 0.00 5
 Kwilu 0.27 1.65 34.80 7
 Lomami 0.00 0.00 0.00 0
 Lualaba 13.12 71.54 76.03 4
 Maï-Ndombe 0.00 0.00 0.00 0
 Maniema 0.86 0.86 0.00 2
 Mongala 0.00 0.00 0.00 0
 Nord-Kivu 0.56 109.40 141.14 7
 Nord-Ubangi 0.96 31.82 474.46 3
 Sankuru 0.00 0.00 0.00 0
 Sud-Kivu 0.69 53.19 106.15 7
 Sud-Ubangi 1.09 2.19 25.99 4
 Tanganyika 2.42 2.42 0.00 2
 Tshopo 0.38 19.12 165.91 5
 Tshuapa 0.76 0.76 0.00 2

 Note: This table presents the distribution of COVID-19 confirmed cases from the 190 districts grouped
into 26 provinces. The population-adjusted number of confirmed cases is obtained by dividing the confirmed
cases by the district population and multiplied it by one million. The compound growth rate is calculated as
the monthly rate of change between the first month where the first cases were reported and the final month
of our sample (October).

 58 アフリカレポート 2021 年 No.59
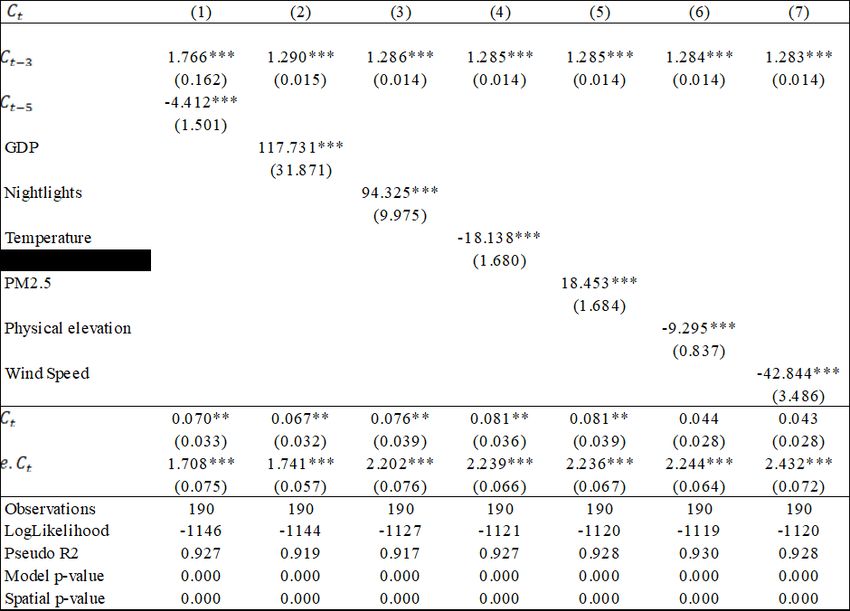
Spatial Propagation of COVID-19 in the Democratic Republic of Congo

(2)Spatial statistics
 In the present study, we use the global Moran’s I to investigate the spatial distribution pattern of each
district’s COVID-19 incidence rate. In the analysis, we use the population-adjusted number of confirmed
cases obtained by dividing the confirmed cases by the district population and multiplied it by one million to
get the population-adjusted number of confirmed cases. The findings reveal positive spatial autocorrelation
patterns for confirmed cases of COVID-19 in the DRC (Table 5). Put differently, the global Moran’s I index
indicates highly clustered patterns for the entire period, implying that the distribution of COVID-19
confirmed cases is not random. We also find some interesting temporal changes in global patterns of spatial
autocorrelation that are worth noting. In April and May, the Moran’s I index was small and was even smaller
in May. However, we see a robust trend of Moran’s I index from June to October, resulting in increased
spatial dependence among neighboring districts. The spatial correlations are particularly high in September
and October, as the Moran’s I index values are greater than 0.3 (Cressie 1992). It is important to note here
that the increasing clustering of COVID-19 cases in June to October appears to be the outcome of a dynamic
wave of contaminations induced by protests and demonstrations resulting in expanding clusters of confirmed
cases and overall growth in the number of testing.

 Table 5: Moran’s I index of spatial autocorrelation
 Date Moran's Index Expected Index Variance z-score p-value
 6-Apr 0.03326 -0.00529 0.0200 1.9271 0.0540
 4-May 0.02776 -0.00529 0.0137 2.4128 0.0158
 6-Jun 0.27359 -0.00529 0.0383 7.2833 0.0000
 1-Jul 0.25529 -0.00529 0.0394 6.6224 0.0000
 4-Aug 0.29432 -0.00529 0.0438 6.8432 0.0000
 19-Sep 0.37021 -0.00529 0.0491 7.6517 0.0000
 7-Oct 0.40402 -0.00529 0.0510 8.0310 0.0000
 Note: This table reports Moran's I tests for spatial autocorrelation for the COVID-19 confirmed cases for
the 190 districts under the null hypothesis of spatial randomization (no spatial autocorrelation). Moran’s I
index, z-score, expected index of the Moran’s I and the variance have been calculated using equations 1-4 in
the main text.

(3)Spatial regression
 Since we found strong spatial correlations in the previous analysis, we present in Table 6 through Table 9
the estimates from the SAR model. We assume that the confirmed cases count in district j is affected by
confirmed case counts in the previous months and the confirmed cases in district j’s neighbors. Table 6
presents the results regarding the initial level of development and meteorological factors. Column 1 presents
our primary specification, where we include two autoregressive terms, , −5 , and , −3 . The first term
corresponds to May, where the lockdown policies were put in place, and the second term is July when these
measures started to be gradually removed. The coefficient associated with the autoregressive term of July
( , −3) is positive and statistically significant. The magnitude is 1.766 and larger than unity. This means that

 59 アフリカレポート 2021 年 No.59
Spatial Propagation of COVID-19 in the Democratic Republic of Congo

the COVID-19 pandemic has progressed exponentially after the government removed the preventive health
measures. The magnitude is somehow smaller than expected because the reopening of activities was officially
announced at the end of July. The coefficient related to May ( , −5) is negative and estimated at -4.412,
implying that lockdown measures had reduced the spread of COVID-19 more than proportionally. Column
2 shows that districts with higher mean GDP are likely to have more confirmed cases. Column 3 introduces
nightlights as a proxy of agglomeration and industrialization9. We find the magnitude of nightlights is also
large, positive, and statistically significant. This implies that districts with larger agglomeration are more
likely to have significantly larger confirmed cases. Columns 4 through 7 present the results for the
meteorological variables. The coefficient of temperature in column 4 is statistically significant but negative.
This shows that districts with lower temperatures are more likely to have higher confirmed cases of COVID-
19. We find in column 5 that the coefficient of PM2.5, proxy of air pollution, is positive and statistically
significant, meaning that residents in districts with higher levels of air pollution are likely to be more exposed
to COVID-19. In column 6, our estimates indicate that residents of high-altitude districts are likely to have
low COVID-19 cases, whereas those in districts with low wind speed are likely to have more COVID-19
cases (column 7). This finding broadly supports the recent work (Fernández-Raga et al. 2021; Rendana 2020)
linking meteorological factors to COVID-19 confirmed cases.

 Table 6: Spatial models of COVID-19 Cases: I

 Note: The table reports estimates from a cross-sectional SAR regression where the dependent variable is
the COVID-19 confirmed cases in October 2020. Each regression includes the autoregressive term of
confirmed cases in July and adds an additional independent variable. Robust standard error in parentheses.
 ∗ p < 0.1, ∗∗ p < 0.05, ∗∗∗ p < 0.01

 9 For a discussion on the relation between nightlights and industrialization in Africa, see Otchia and Asongu (2020).

 60 アフリカレポート 2021 年 No.59
Spatial Propagation of COVID-19 in the Democratic Republic of Congo

 A large variety of health risk factors has been associated with the spread of COVID-19. In Table 7, we
study several diseases that spread in the DRC between 2017 and 2019. We start in column 1 with
hospitalization rates for curative diseases used as a proxy for the local health system. We find that the
residents of districts with high hospitalization rates are more susceptible to COVID-19. Column 2 of Table 7
includes confirmed cases of Ebola. We find that districts with a higher prevalence of Ebola have significantly
higher confirmed cases of COVID-19. Column 3 includes the prevalence of Cholera and shows that districts
with a high prevalence of Cholera are likely to be more susceptible to COVID-19. Columns 4 through column
9 include the district’s level prevalence of tuberculosis, malaria, meningitis, plague, AFP, and monkeypox,
respectively. The magnitude of tuberculosis, malaria, meningitis, AFP, and monkeypox are positive and
statistically significant. The coefficient associated with malaria is relatively small, as compared to
tuberculosis and Cholera, for example. This finding should be interpreted with caution, as malaria shares
some of the highly recognizable symptoms with COVID-19, such as fever, difficulty in breathing, fatigue,
and acute onset headaches. According to Chanda-Kapata, Kapata, and Zumla (2020), a malaria case may be
misclassified as COVID-19 if symptoms alone are used to define a case during the emergency period and
vice versa. The coefficient associated with plague is found to be negative but not statistically significant.
Finally, the second panel of Table 7 shows the spatial lag of the dependent variables and the spatial error lag.
Both of these statistics are statistically significant and positive in all the models. This indicates that
neighboring districts have significant, positive effects in the COVID-19 confirmed cases, implying that we
cannot ignore neighbors’ spatial impacts.

 Table 7: Spatial models of COVID-19 Cases: II

 Note: The table reports estimates from a cross-sectional SAR regression where the dependent variable is
the COVID-19 confirmed cases in October 2020. Each regression includes the autoregressive term of
confirmed cases in July and adds an additional independent variable. Robust standard error in parentheses.
 ∗ p < 0.1, ∗∗ p < 0.05, ∗∗∗ p < 0.01

 61 アフリカレポート 2021 年 No.59
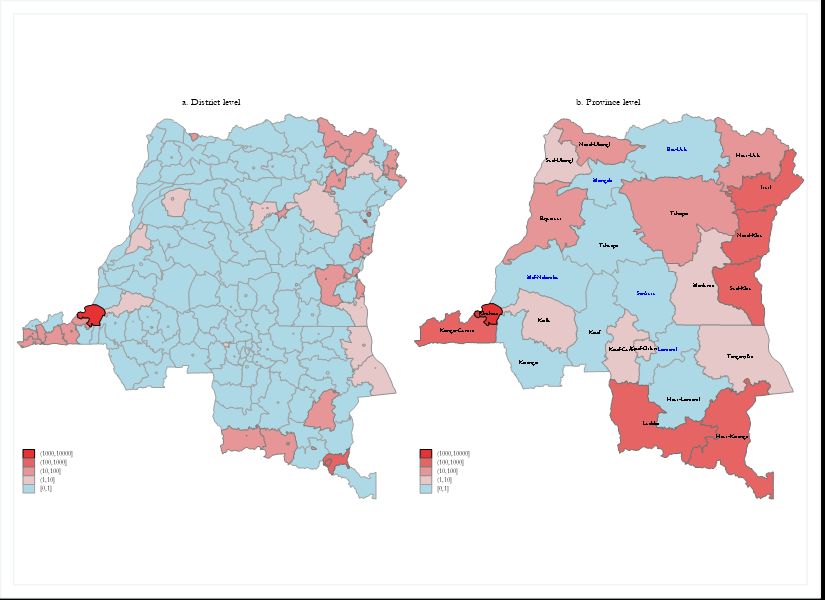
Spatial Propagation of COVID-19 in the Democratic Republic of Congo

 We next discuss results from SAR models for the set of explanatory variables related to conflicts. The top
part of Table 8 describes the effects of variables related to conflicts, while the bottom panel describes the
spatial features. As is evident from Table 8, we see a positive correlation between conflicts and COVID-19
confirmed cases. In Column 1, we show that districts with a high prevalence of battles are likely to have more
confirmed cases. Column 2 illustrates the districts with high prevalence of protests also are predicted to have
high COVID-19 confirmed cases. Columns 3 and 4 show similar patterns in districts with a high prevalence
of riots and violence against civilians. The bottom panel of Table 8 demonstrates the importance of including
spatial impacts from neighboring districts in all models.

 Table 8: Spatial models of COVID-19 Cases: III

 Note: The table reports estimates from a cross-sectional SAR regression where the dependent variable is
the COVID-19 confirmed cases in October 2020. Each regression includes the autoregressive term of
confirmed cases in July and adds an additional independent variable. Robust standard error in parentheses.
 ∗ p < 0.1, ∗∗ p < 0.05, ∗∗∗ p < 0.01

 Table 9 finally focuses on other socioeconomic variables that have been viewed as important in the
literature. We start by including the district level share of wageworkers in column 1. Our results show that
districts with higher shares of wageworkers are likely to have significantly higher confirmed cases. We also
examine the case of districts with a high number of moonlight workers in column 2 and found positive and
statistically significant effects. Column 3 includes the number of provincial parks as a proxy of tourism-
oriented places. We find that the residents of these districts are likely to be more susceptible to COVID-19.
We also find in column 4 that districts with a high share of 50+ people are predicted to have more COVID-
19 cases. In results not reported here, we find that the gender composition of the population does not matter.
Column 5 adds national roads. As expected, we find that highly connected districts are likely to have
significantly higher confirmed cases. The bottom panel of Table 9 shows that the neighboring districts have
a positive and significant effect on the confirmed cases of COVID-19.

 62 アフリカレポート 2021 年 No.59
Spatial Propagation of COVID-19 in the Democratic Republic of Congo

 Table 9: Spatial models of COVID-19 Cases: IV

 Note: The table reports estimates from a cross-sectional SAR regression where the dependent variable is
the COVID-19 confirmed cases in October 2020. Each regression includes the autoregressive term of
confirmed cases in July and adds an additional independent variable. Robust standard error in parentheses.
 ∗ p < 0.1, ∗∗ p < 0.05, ∗∗∗ p < 0.01

 5. Conclusion

 We have presented an empirical assessment of the COVID-19 confirmed cases in the DRC from April to
October 2020. Overall, we find that the DRC appears to have few confirmed COVID-19 cases and few deaths
but a wide variation across the country. This led to an important question: what are the causes of these
subnational variations?
 To explain why the subnational variations are so high, we have explored whether the spatial autocorrelation,
which leads to spillover from one region to another in the case of COVID-19, is present in the DRC. For this
purpose, the richness of our data has allowed us to perform a spatial autocorrelation regression and test a
variety of factors that have not been addressed in the literature. It has also enabled us to accurately measure
the evolution of the spread and observe the effects of socioeconomic variables separately from other
components such as the spatial lag and the error lag.
 The analysis reveals that the subnational spread of the COVID-19 confirmed counts is correlated with (i)
the high prevalence of several epidemics, which is, in turn, explained by the weak health system and by the
lack of a coordinated vision and budget, and by (ii) the prevalence of conflict. Our results further confirm
that confirmed cases are also associated with connectivity and population characteristics. Finally, we show
that meteorological factors can play an essential role in containing the pandemic. Taken together, this study

 63 アフリカレポート 2021 年 No.59
Spatial Propagation of COVID-19 in the Democratic Republic of Congo

suggests that countries can learn from previous epidemics’ experience, at least in the short run. This is what
the DRC failed to do.

 References

Anselin, Luc 1995. “Local Indicators of Spatial Association—LISA.” Geographical Analysis 27 (2):93-115. DOI:
 https://doi.org/10.1111/j.1538-4632.1995.tb00338.x.
Bailey, Michael, Drew Johnston, Theresa Kuchler, Dominic Russel, Bogdan State and Johannes Stroebel 2020. “The
 Determinants of Social Connectedness in Europe.” in Social Informatics. SocInfo 2020. Lecture Notes in Computer
 Science, vol 12467, edited by S. Aref, Cham: Springer. DOI: https://doi.org/10.1007/978-3-030-60975-7_1.
Brodeur, Abel, David M. Gray, Anik Islam and Suraiya Bhuiyan 2020. “A Literature Review of the Economics of Covid-19.”
 IZA Discussion Paper No. 13411.
Chanda-Kapata, Pascalina, Nathan Kapata and Alimuddin Zumla 2020. “COVID-19 and Malaria: A Symptom Screening
 Challenge for Malaria Endemic Countries.” International Journal of Infectious Diseases 94:151-153. DOI:
 https://doi.org/10.1016/j.ijid.2020.04.007.
Coven, J. and A. Gupta 2020. “Disparities in Mobility Responses to COVID-19.” Working paper, Stern School of Business,
 New York University.
Cressie, Noel 1992. “Statistics for Spatial Data.” Terra Nova 4 (5):613-617. DOI: https://doi.org/10.1111/j.1365-
 3121.1992.tb00605.x.
De Herdt, Tom and Kristof Titeca, eds. 2019. Negotiating Public Services in the Congo: State, Society and Governance.
 London: Zed Books.
Devisch, R. 1998. “Colonial State Building in the Congo, and Its Dismantling.” The Journal of Legal Pluralism and
 Unofficial Law 30 (42):221−244.
DRC 2020. Programme multisectoriel d’urgence d’atténuation des effets de la COVID-19 en République démocratique du
 Congo (PMUAIC-19). Kinshasa: Ministère du Plan.
Fernández-Raga, María, Laura Díaz-Marugán, Marta García Escolano, Carlos Bort and Víctor Fanjul 2021. “SARS-CoV-2
 Viability Under Different Meteorological Conditions, Surfaces, Fluids and Transmission Between Animals.”
 Environmental Research 192:110293. DOI: https://doi.org/10.1016/j.envres.2020.110293.
Guliyev, Hasraddin 2020. “Determining the Spatial Effects of COVID-19 Using the Spatial Panel Data Model.” Spatial
 Statistics 38:100443. DOI: https://doi.org/10.1016/j.spasta.2020.100443.
INS 2020. Mesure de l’impact du COVID-19 sur les Unités Economiques. Bulletin Numéro 01 : juillet 2020.
Kang, Dayun, Hyunho Choi, Jong-Hun Kim and Jungsoon Choi 2020. “Spatial Epidemic Dynamics of the COVID-19
 Outbreak in China.” International Journal of Infectious Diseases 94:96-102. DOI:
 https://doi.org/10.1016/j.ijid.2020.03.076.
Kuchler, Theresa, Dominic Russel and Johannes Stroebel 2020. “The Geographic Spread of Covid-19 Correlates with
 Structure of Social Networks as Measured by Facebook.” CESifo Working Paper Series 8241, CESifo.
Mollalo, Abolfazl, Behzad Vahedi and Kiara M. Rivera 2020. “GIS-Based Spatial Modeling of COVID-19 Incidence Rate in
 the Continental United States.” Science of the Total Environment 728:138884. DOI:
 https://doi.org/10.1016/j.scitotenv.2020.138884.
Otchia, C.S. and S. Asongu 2020. “Industrial Growth in Sub-Saharan Africa: Evidence from Machine Learning with Insights
 from Nightlight Satellite Images.” Journal of Economic Studies. DOI: https://doi.org/10.1108/JES-05-2020-0201.
Pearson, N. 2011. “Case Study: Democratic Republic of the Congo.” DFID, Practical Action Consulting, Save the Children,
 and CfBT Education Trust (https://infohub.practicalaction.org/bitstream/handle/11283/366190/4f19819e-5154-49ad-
 8e90-221c0ae4f5bb.pdf?sequence=1).
Rendana, Muhammad 2020. “Impact of the Wind Conditions on COVID-19 Pandemic: A New Insight for Direction of the
 Spread of the Virus.” Urban Climate 34:100680. DOI: https://doi.org/10.1016/j.uclim.2020.100680.
Seay, Laura E. 2013. “Effective Responses: Protestants, Catholics and the Provision of Health Care in the Post-War Kivus.”
 Review of African Political Economy 40 (135):83-97. DOI: https://doi.org/10.1080/03056244.2012.761601.
van Barneveld, Kristin, Michael Quinlan, Peter Kriesler, Anne Junor, Fran Baum, Anis Chowdhury, PN Junankar, Stephen
 Clibborn, Frances Flanagan, Chris F. Wright, Sharon Friel, Joseph Halevi and Al Rainnie 2020. “The COVID-19
 Pandemic: Lessons on Building More Equal and Sustainable Societies.” The Economic and Labour Relations Review 31
 (2):133-157. DOI: https://doi.org/10.1177%2F1035304620927107 .

 (Otchia Christian Samen / Nagoya University)

 64 アフリカレポート 2021 年 No.59
You can also read